 Cheng Gong1
 Wenhan Zhang
- 1Electric Power Research Institute, State Grid Beijing Electric Power Company, Beijing, China
- 2School of Electrical and Electronic Engineering, North China Electric Power University, Beijing, China
Introduction: When a distributed photovoltaic (PV) system has access to a large urban distribution network, the active balance is primarily borne by the main network gas unit; when the scale of the distributed PV system is very large, the main network can only provide limited regulation capacity, and the distribution network must determine the active optimal scheduling strategy.
Methods: This work proposes an active optimization scheduling model for the distribution network by considering the regulation capacity of the main network. In terms of the optimisation objectives, the maximum consumption of the distributed PVs and minimum power fluctuation at the demarcation point of the main distribution network are proposed as the main objectives, while the minimum total exchanged power in a cycle at the main distribution demarcation point and minimum distribution network loss are considered as the secondary objectives. In terms of constraints, it is proposed that the main network’s regulation capacity be characterized by the main network’s gas-fired unit creep constraints. A fast solution method for active optimization of the distribution network is designed herein to formulate the priority control order of the adjustable units according to the dispatch economic performances of various types of adjustable resources in the distribution network; this reduces the number of variables involved in the optimization at each step and improves the optimized solution speed.
Results: Finally, Simulation verification by IEEE 33-node distribution network arithmetic example based on Matlab simulation platform.
Discussion: Simulation results show the effectiveness of the method in achieving maximum PV consumption and reflecting the limited regulation capacity of the main grid.
1 Introduction
Large urban distribution networks often experience large loads, and the distribution network has a few conventional power sources with small capacities that are mostly supplied by the main grid (Lu et al., 2015). The power in the main urban grid is partly derived from the external grid and partly from the gas-fired units in the main grid. The power supplied by the external grid cannot fluctuate significantly according to the power supply agreement; therefore, the gas units in the main grid assume the function of active balance regulation.
With the rapid development of new energy generation methods, distributed photovoltaic (PV) systems have gained a high proportion of access to urban distribution networks. When the PV output is high and load is low, the gas-fired units in the main grid must reduce their outputs or even shut down; conversely, when the PV output is low and load is high, the gas-fired units in the main grid must increase their outputs or even startup the standby units. The main grid units are generally operated within the economic output range, and the maximum regulation capacity is ensured to not exceed the safe output range; this means that the units require a lot of time to startup, and frequent startups and shutdowns could affect the lifetimes of the units (Hu et al., 2008). Therefore, the startup mode of the main network units cannot be changed over a wide range, resulting in limited regulation capacity of the main network. When the PV supply fluctuates widely in the distribution network, the main network can only provide limited regulation capacity. Therefore, urban distribution networks must perform active balancing and carry out optimal dispatch within the main grid regulation capacity.
The optimal scheduling of large urban distribution networks containing distributed PV sources is studied by considering the main grid regulation capacity as follows:
(1) How to take into account the regulating capacity of the main network in terms of the distribution network.
(2) What are the dispatchable resources in a large urban distribution network, and what optimization objectives must be considered.
(3) What constraints should be imposed on the optimization model, and how to design a solution method applicable to real scheduling operations.
Problem (1) entails cooperative active scheduling of the main distribution. Owing to the randomness and volatility of distributed PV output, there is easy lack of coordination between the distribution and main grids in terms of the power generation and consumption plans, making it difficult to fully consume the distributed energy. Therefore, optimal scheduling of the main and distribution networks is necessary to achieve main power balance and other objectives while maximally consuming the distributed PV power. The existing cooperative optimal scheduling of the main and distribution networks is divided into subproblems concerning optimization of the main and distribution networks, which are then solved iteratively (Zhang et al., 2017; Deng, 2019; Wu et al., 2019; Zhang and Wang, 2019). The optimization objective is to optimize the overall economy of the main distribution network while ensuring that the active power transmitted at its boundary meets the consistency constraints. In distribution network optimization, the main network is considered to be an infinite power source, and only the active power exchanged by the main and distribution networks is required to be within the capacity of the transmission channel without considering the regulation capacity of the main network units and their ability to support a wide range of changes in the exchanged power.
Jiang et al. (2019) proposed a collaborative optimal operation method based on multiparameter planning for the main and distribution networks, where the distribution network needs to be optimized under the conditions of the power planning curve transmitted by the main network. This is to solidify the main network power supply capacity as the planning curve, which does not reflect the power supply margin of the main network, thereby producing conservative scheduling results. Therefore, to fully exploit the regulation capacity of the main network, it should be reflected as a limited range of power variations. Moreover, the amount of power exchange in the main network synergy should be minimized.
Problem (2) is the optimization objective of the distribution network. When a high proportion of the distributed PV supply is connected to the distribution network, it will impact the voltage security of the distribution network, which causes not only voltage overruns at the grid nodes but also branch current overloads, voltage shifts, and high harmonics (Ge, 2023). Among these, voltage overrun is one of the most important reasons affecting the ability to consume PV power (Zhang, 2021).
Most of the existing optimization objectives of distribution networks containing distributed PVs are strategies for ensuring their voltage stabilities. Li et al. (2018) investigated the impacts of various voltage regulation measures on the PV admittance capacities of the distribution network and used the trial method to solve for the maximum PV admittance capacity before and after adding the voltage regulation measures without voltage regulation; some authors analyzed the impact of the access power at each node on the voltages at the other nodes based on the voltage sensitivity matrix (Xu et al., 2016; Cai et al., 2017) along with the PV admittance capacity of the distribution network based on the analytical method. Huang et al. (2020) used the intelligent optimization method and proposed a distributed PV grid-connected limit capacity calculation method based on the adaptive weighted particle swarm optimization algorithm. Ding et al. (2017) proposed a method to avoid network overvoltage by controlling the PV inverters and formulated a two-stage robust centralized optimal scheduling model by considering the PV output uncertainties.
The optimal distribution network operation economics has also been considered based on the voltage stability of the distribution network. Lin et al. (2017) developed a multiregion dynamic economic dispatch model to minimize the total multiregion generation cost. Pan (2015) established an optimal scheduling model for the units by reflecting the demands for energy savings and emission reductions in the power grid. In terms of the demand-side responses, Chen et al. (2024) developed an operation scheduling optimization methodology for electric ready-mixed concrete vehicles (ERVs). These studies do not analyze the roles of adjustable devices, such as energy storage systems (ESSs), gas units, and controllable loads (CLs), in achieving the maximum consumption of distributed PV power; at the same time, they do not take into account the impact of the regulating capacity of the main grid on PV consumption in the distribution network.
Problem (3) is concerned with the distribution network constraints and solution methods. Lin et al. (2017) considered the generator set creep constraints as well as the contact line transmission power constraints; Pan (2015) considered the unit start–stop and creep rate constraints. These studies only focus on the units within the distribution network and do not consider the main network units or analyze the impacts of the creep rate constraints of the units on distributed PV consumption. Therefore, the creep rate constraints of the gas-fired units in the main grid should be considered, which are reflected in the fact that the exchanged power between the main and distribution networks cannot fluctuate significantly during adjacent time periods.
In terms of optimal solutions, there are various algorithms in literature to solve the scheduling model (Dvorkin et al., 2015; Pandžić et al., 2016; Li et al., 2021; Wang et al., 2023). Ruan et al. (2020) proposed a distributed voltage control model with a novel network partitioning approach. Li et al. (2016) proposed a coordinated transmission and distribution AC optimal flow model based on a heterogeneous decomposition algorithm; Li (2013) proposed an application-based coordinated optimal flow for transmission and distribution network decomposition. The above algorithms require large numbers of control quantities to participate in the iterative solution at the same time, and the solution space of the problem is too large, which may slow or fail to solve the computation. Therefore, to meet the real-time scheduling requirements, it is necessary to develop a fast and reliable optimization method that minimizes the amount of control involved in the solution each time.
The main contributions of this work are as follows:
1. In the optimization objective of the distribution network, the regulating capacity based on the gas units in the main network is taken into account to minimize the fluctuations in the interaction power of the main distribution network during a dispatch cycle while ensuring that the total exchanged power is minimal.
2. A distributed PV maximum consumption model is proposed for the distribution network by taking into account multiple adjustable resources such as reactive power compensation equipment, ESSs, and CLs, and the impact of the limited regulation capacity of the main network on maximum PV consumption is analyzed.
3. The limitations imposed by the creep rates of the gas units in the main network are considered in the constraints, and a fast solution method is designed for active optimization of the distribution network; here, the priority control order of the adjustable units is formulated on the basis of economy, and a stepwise solution process is designed to optimize the distribution network, which reduces the number of variables participating in the optimization at each step while improving the speed of the optimization solution.
2 Model assumptions
2.1 Basic assumptions
1. It is assumed that the transmission line parameters of the distribution network remain constant during operation.
2. At each moment in time, the load demand at each node is either known or predictable.
2.2 Assumptions for the regulatory capacity of the main network
1. We assume that the power supplied by the main grid to the distribution network is determined only by the outputs of the gas units in the main grid, and the influences of the power injected into the main grid from the external network and power delivered to other distribution networks are not taken into consideration.
2. The maximum and minimum outputs of the gas units are known and remain unchanged during a dispatch cycle.
3. The rate of change (creep rate) of the output of a gas unit is known and remains constant during a dispatch cycle while not exceeding the specified range.
2.3 Assumptions for the adjustable units of the distribution network
1. We assume that the distributed PV power generation can be predicted accurately and that the predicted value is certain during a dispatch cycle based on ignoring the effects of volatility due to changes in the solar radiation intensity and temperature factors as well as disregarding the effects of sudden weather changes (e.g., cloudy and rainy) on the PV outputs.
2. The PV inverter can be controlled to reduce the PV output and may also be withdrawn from operation if necessary so that the minimum PV output can be reduced to 0.
3. We assume that the customer loads respond positively and instantly to the load regulation commands while ignoring the influences of factors such as customer behaviors and satisfaction.
4. It is assumed that the energy storage devices can be charged and discharged many times in a single dispatch cycle while ignoring the limitations on the rates of change of charging and discharging.
5. The impacts of short-circuits, disconnections, equipment failure, and other unexpected accidents on the power grid are not considered.
3 Optimized scheduling model for the urban distribution network considering the regulation capacity of the main network
3.1 Objective function
In this work, the objective function was established with the optimization objectives of maximum consumption of the distributed PV power and minimum active fluctuations at the demarcation point of the main distribution network; furthermore, the objectives accounted for the minimum distribution network loss as well as minimum total exchanged power of the main distribution network during a scheduling cycle, are shown in Equation 1–Equation 5:
where
In the above formulas,
Here,
3.2 Main network regulation capacity constraints
3.2.1 Range of power changes at the main distribution cutoff point
Under the condition of transmitting a certain active power at the demarcation point of the main distribution network, there are corresponding active and reactive power regulation ranges that indicate the power supply capacity of the main network to the distribution network. The expressions are shown in Equation 7 and Equation 8, respectively.
Here,
where
3.2.2 Creep power constraint at the main distribution cutoff point
Since the regulation capacity of the main network is determined by its gas units, the creep power constraints of the gas units in the main network limit the power exchanged at the demarcation point from varying over a wide range per unit of time. The creep power constraint of the transmission power at the demarcation point of the main distribution network is given as Equation 11
where
3.3 Adjustable unit operation constraints of the distribution network
The adjustable units in the distribution network include the distributed PVs, CLs, ESSs, on-load tap changers (OLTCs), static var compensators (SVCs), and capacitor banks (CBs) that have their own constraints
3.3.1 Power regulation range of the distributed PV
The active regulation of PV power is embodied by self-curtailment of the active outputs, which can be expressed with the range of curtailment as Equation 12.
3.3.2 Active range of the CL
The load that can be shifted at time t cannot exceed 20% of the total load at that moment. As shown in Equation 13, Equation 14
The CLs dispatched in a cycle should therefore be managed such that the total load transfers in and out are equal as shown in Equation 15:
3.3.3 Operational constraints of the OLTC
The main voltage constraint is given by Equation 16
where
The variable ratio constraints are given by Equation 17–Equation 19
where
3.3.4 Capacity constraints of the ESS
The charge/discharge state constraint is given by Equation 20
where
The upper and lower bound constraints of the charging and discharging power are given by Equation 21, Equation 22
where
The energy storage capacity constraints are given by Equation 23, Equation 24
where the energy storage capacity is dynamically balanced over a dispatch cycle as shown in Equation 25.
Here,
3.3.5 Operational constraint of the SVC
The SVC reactive output constraint is shown in Equation 26
where
3.3.6 Operational constraints of the CB
The CB reactive output constraint is shown in Equation 27
where
The constraint on the change in the number of cast–cut groups at adjacent time periods is given by Equation 28.
The throw–cut CB constraint is given by Equation 29.
where
3.4 Branch circuit tidal equation constraints
A second-order cone-relaxation-based branch current model can be used for the distribution network as follows Equation 30–Equation 32:
In these equations,
3.5 System operational constraints
The system voltage constraints and branch current constraints are given in Equations 35–36.
where
4 Solution for the active optimal scheduling model
4.1 Design considerations
The active optimization dispatch method of the distribution network with distributed PVs must achieve maximum consumption of the distributed PV power under the limited regulation capacity of the main network by integrating all kinds of adjustable equipment in the distribution network; simultaneously, the auxiliary OLTCs and reactive power compensation equipment must maintain the voltage stability, minimize the network loss, and enhance the economy of system operation. Under the premise of main power balance, the limited regulating capacity of the main network mainly includes the following considerations:
(1) The main network ideally supplies the least total power to the distribution network during a dispatch cycle.
(2) There must be minimal fluctuations in the power supply from the main network to the distribution network during a dispatch cycle.
(3) The main network supplying power to the distribution network must have minimal variation between adjacent time periods.
The distribution grid system studied herein is powered only by large-scale distributed PVs and needs to be configured with large-capacity distributed ESSs combined with PVs; this can smooth the fluctuations in PV power generation while improving the self-usage rate of the distribution grid and economic benefits. Through the ESSs, users can store excess PV power during low electricity demand and use this stored power during peak electricity demand. This reduces the dependence on grid power, avoids the phenomenon of abandoned daylight, and improves the self-use rate of PV power. The ESSs can also respond to grid demand in milliseconds, and this rapid response capability allows them to quickly respond to fluctuations in grid loads to provide immediate power support while also providing the grid with certain degrees of frequency regulation and voltage support capabilities.
Although direct optimization of CL regulation helps maintain balance between power supply and demand in the grid, it must be achieved through price signal or incentive mechanisms to guide the user to adjust to electricity behaviors; hence, the user must be involved in the regulation of user needs to achieve high economic compensation, which increases the operating cost of the power system compared to that of the ESS as the scheduling cost is high. Concurrently, the response speed is significantly lower than that of the ESS, and it may be difficult to meet the needs of a power grid system that requires high real-time regulation capabilities. In terms of the regulation order of adjustable units, ESSs have higher priority than the CLs.
The present study is dedicated to maximizing the consumption of distributed PV power to achieve the goals of sustainable development while meeting the regulation capacity limitation of the main grid. Optimal scheduling of the power system through curtailing distributed PV not only wastes renewable energy but also negatively affects sustainable development goals. Maximizing the use of PV power could help reduce carbon emissions and environmental pollution, mitigate climate changes, reduce energy costs, reduce dependence on imported fossil fuels, and enhance energy independence and security while helping accelerate the construction of smart grids, establish a sound power market mechanism, and improve the new power system.
In summary, when the interacting power at the demarcation point of the main distribution network exceeds the range of its regulation capacity, the outputs of the adjustable units in the distribution network are regulated in the following order of priority:
1. Increasing the charging and discharging powers of the ESSs;
2. Shifting the CLs;
3. Reducing the distributed PV power.
The principle of regulation is based on minimizing the active fluctuations in the main distribution network with minimal transfer of CLs and minimal PV curtailment.
4.2 Solution strategy for the active optimal scheduling model
From the planned outputs of the distributed PVs and predicted outputs of the loads in a complete dispatch cycle (24 h) without consideration of other adjustable devices in the distribution network, the initial interactive power at the demarcation point of the main distribution network is calculated using the forward backgeneration trend to obtain the voltage overruns at each node, and the specifics of the forward power flow are shown in Figure 1.

Figure 1. Flowchart of the power flow calculation.
The power of the root-node-connected branch circuit obtained from this trend calculation is the power exchanged at the demarcation point of the main distribution network, and the subsequent optimization is based on this power. The flowchart showing specific regulation of the active optimization scheduling method of the distribution network with distributed PVs considering the regulation capacity of the main network is shown in Figure 2.
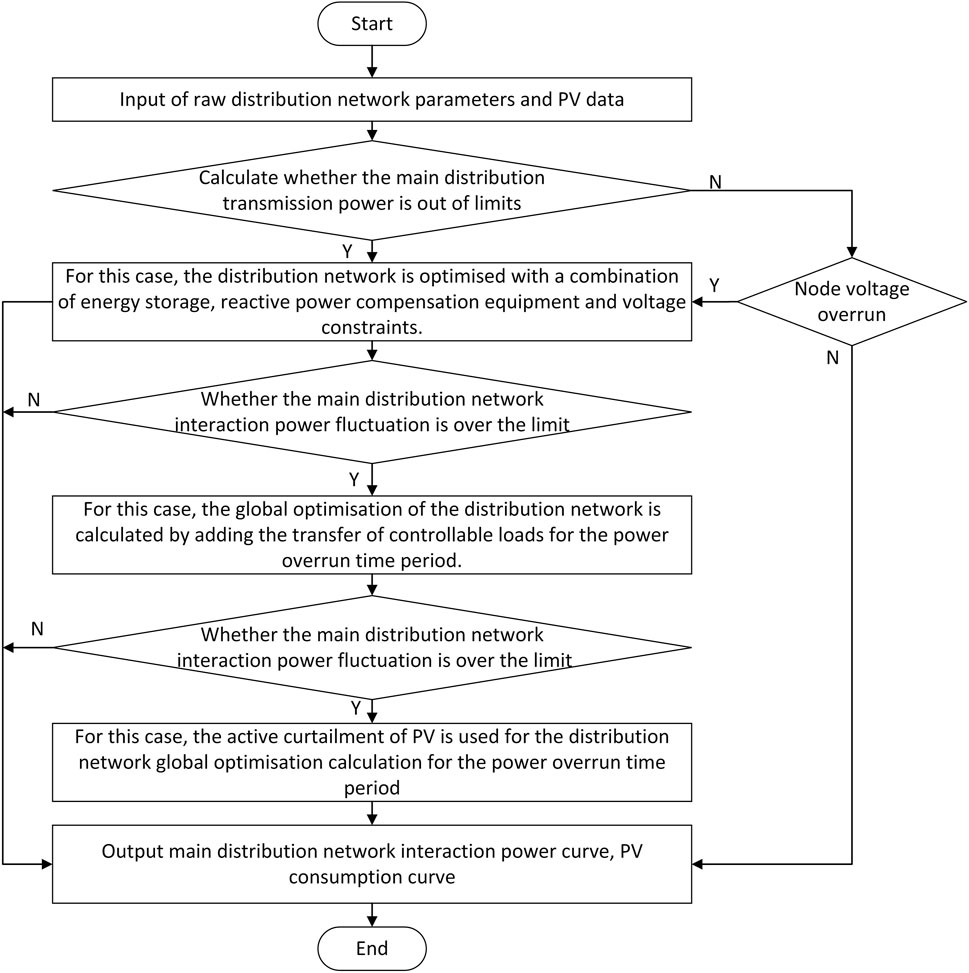
Figure 2. Flowchart for the optimisation strategy.
5 Example analysis
In this section, we demonstrate improvement of the basic IEEE 33 node power network by adding some active and reactive power regulation devices as well as conducting arithmetic simulations on this test system to verify the effects of the active optimal scheduling method of the distribution network with distributed PVs limited by the main grid regulation capacity. The optimization algorithm implementation is achieved using MATLAB software and the YALMIP toolbox along with the Cplex12.10 solver.
5.1 Calculation setup
The system diagram of the 33-node distribution network modified based on the setup scheme in this work is presented in Figure 3. The base capacity of the system is 1 MVA, base voltage level is 12.66 kV, total active load capacity of the system is 3,715 kW, total reactive load capacity is 2,300 kVar, and voltage per-unit value at the balancing node (i.e., node 33) is 1 p.u. As shown in Figure 3, reactive power compensation devices such as the OLTCs, PV generator, ESSs, and CBs are added on the basis of the network structure of the basic IEEE 33 node distribution system, and the specific configurations are shown in Table 1.
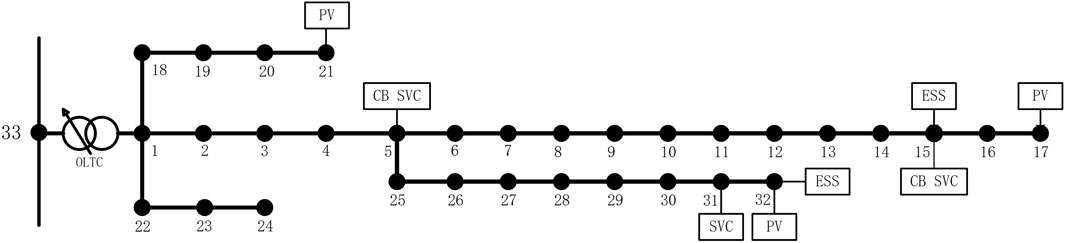
Figure 3. Arithmetic grid map of the modified IEEE 33 node distribution system.
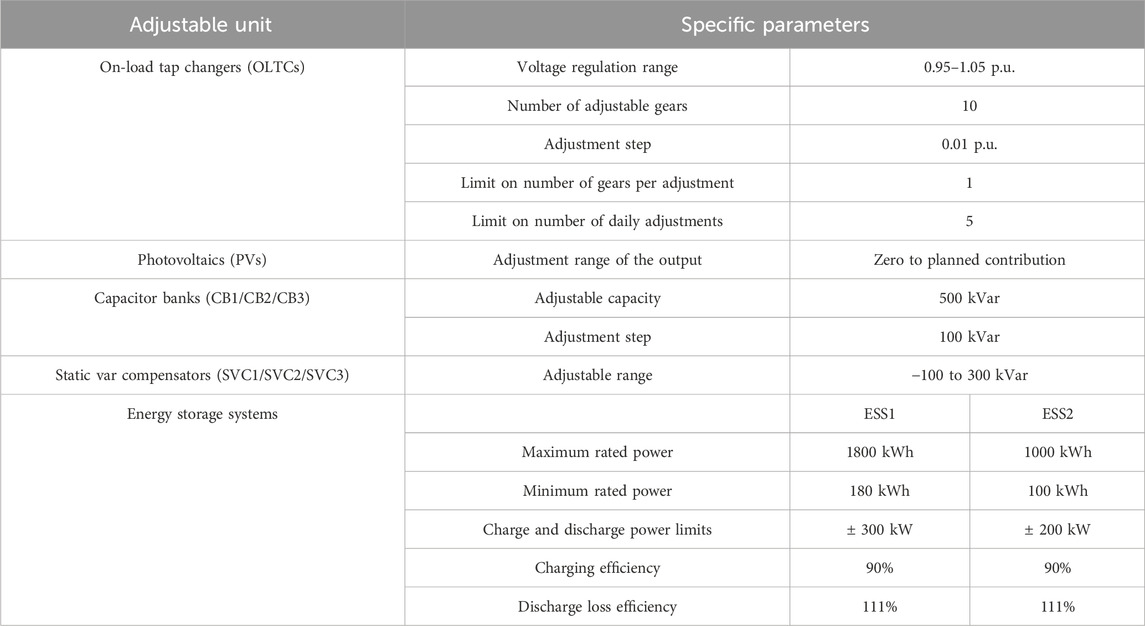
Table 1. Parameters of the adjustable units.
Under actual conditions, the area encompassed by the distribution network system is often not very large; however, to facilitate analysis of the results, the system access between the PVs as well as between the power characteristics of the loads are set to be only slightly different so as to be considered the same output characteristics, based on the same predicted power curve that would be analyzed. The typical load demand and PV active power curves during summer are normalized to obtain the all-day predicted power curves for the total system load and total distributed PV output, as shown in Figure 4.
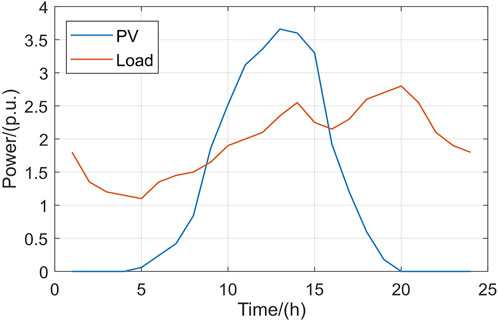
Figure 4. Photovoltaic (PV) and output load curves.
5.2 Analysis of simulation results
To reflect the influence of the main grid regulation capacity on the output of each equipment in the distribution network and maximum consumption of PV power, the weighting coefficients in Equation 1 are set to
Scenario 1: No controls are considered.
Scenario 2: The controls used include PV curtailment, ESSs, SVCs, and CBs.
Scenario 3: Based on Scenario 2, optimization calculations are carried out with the objective of minimizing the active fluctuations between the main distribution network by considering the creep power constraints of the gas units in the main network and CLs.
5.2.1 Analysis of simulation results for scenario 1
In the modified IEEE 33 node distribution system, nodes 17, 21, and 32 are selected to represent the single-point PV grid-connection points, and all distributed PVs are connected to the system with the planned output without controls to explore the impacts on system node voltage and power exchanged by the main distribution network; the simulation results are shown in Figures 5, 6. From Figure 5, it is seen that when the PVs are connected to the planned outputs, the voltages at some nodes during 11–15 h exceed 1.05 p.u., exhibiting voltage overruns.
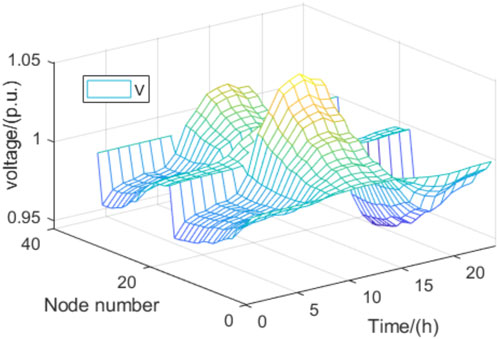
Figure 5. Node voltage diagrams over 24 h for scenario 1.
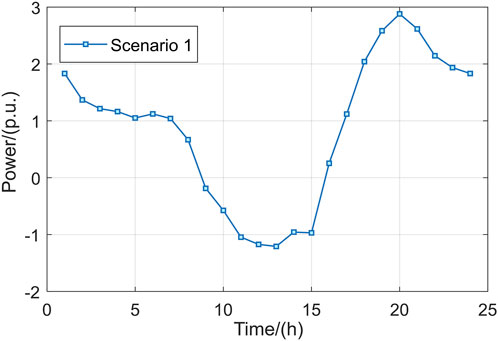
Figure 6. Interaction power at the cutoff point of the main distribution network under scenario 1.
From Figure 6, it is seen that the power delivered from the main grid to the distribution network decreases from 1,122 kW to 668 kW at 6–8 h due to continuous increases in the PV outputs; at 9–15 h, the distribution network is seen to deliver power to the main grid; at 13 h, the distribution network delivers a maximum power of 1,208 kW to the main grid; thus, the maximum power fluctuation at the demarcation point of the main distribution network is 2,330 kW. When the active demand in the distribution network decreases and results in backward power delivery to the main grid, there are decreases in the outputs of the main grid units or even shutdowns. In the time period of 16–20 h, the interaction power at the demarcation point of the main distribution network rises sharply from 254 kW at 16 h to 2,880 kW at 20 h due to continuous reduction of PV output and increase in user load, demonstrating a maximum fluctuation of 2,626 kW; when the active demand of the distribution network continues to increase, it will lead to increases in the outputs of the main network units and perhaps even startup of the standby units.
During actual operation, the main network units cannot be started and stopped frequently; the transmission power change cycle in the main network is longer, so the sharp increase in active power demand from the distribution network cannot be met over a short duration. Thus, there may be an active power shortage between the main and distribution networks, which affects the frequency and voltage stabilities of the distribution network; this serious situation may result in short-term power outages for the user loads, so it is necessary to use the adjustable resources of the distribution network to reduce the power fluctuations between the main and distribution networks.
5.2.2 Analysis of simulation results for scenario 2
Based on scenario 1, given the minimum active fluctuation and maximum PV consumption at the demarcation point of the main distribution network as the main objectives as well as node voltages remaining within the limit as the constraint, the optimization of the interaction power at the demarcation point of the main distribution network is as shown in Figure 7, the active outputs of the ESSs are as shown in Figure 8, and the reactive outputs of the SVCs and CBs are as shown in Figure 9.
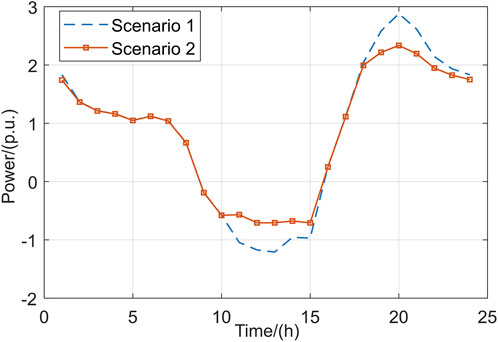
Figure 7. Interaction power at the cutoff point of the main distribution network under scenario 2.

Figure 8. Energy storage charging and discharging powers under scenario 2.
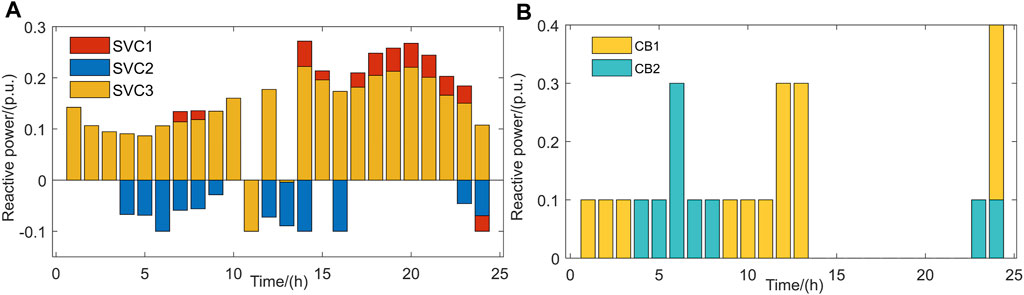
Figure 9. Reactive outputs of the (A) static var compensators (SVCs) and (B) capacitor banks (CBs) under scenario 2.
The distributed PV power in this scenario can still be consumed fully, and the reactive power compensation device appropriately consumes reactive power during 10–15 h to maintain voltage stability when the PV output is maximum, such that the ESS is charged with 1,080 kW of power; the backward transmission of power from the distribution network to the main network decreases by 2,230 kW during 9–15 g, and the stored energy decreases by 1,140 kW over 17–23 h when the load is higher and PV output is zero. This total of 1,140 kW is discharged, and the interactive power of the main distribution network decreases by 1,693 kW, such that the maximum power fluctuation over 16–20 h decreases from 2,626 kW in scenario 1 to 2,084 kW. Hence, the ESSs play positive roles in smoothing the power fluctuations between the main distribution network and reactive power compensation device to achieve maximum dissipation of the PV power and maintain voltage stability. However, the interactive power of the main distribution network still fluctuates greatly and needs to be optimised further.
5.2.3 Analysis of simulation results for scenario 3
In scenario 2, the interactive power fluctuation in the main distribution network is large and the power change amplitude during the adjacent time period is drastic; therefore, the addition of CLs is considered to smooth the power fluctuation in the main distribution network, whose output changes are shown in Figure 10, active outputs of the ESSs are shown in Figure 11, and PV dissipations are shown in Figure 12.
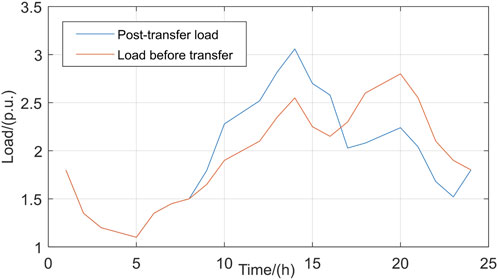
Figure 10. Shifting load power under scenario 3.

Figure 11. Energy storage charging and discharging powers under scenario 3.
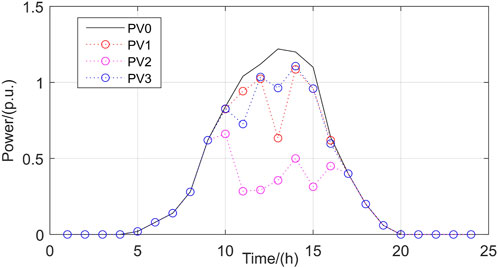
Figure 12. PV output for scenario 3.
To suppress the sharp increase in main grid supply power caused by reduction of the PV outputs, it is necessary to guide the user loads so as to reduce power consumption during the peak period of 17–23 h; at the same time, to achieve maximum consumption of PV power, it is necessary to guide the user loads to increase their power consumption as much as possible during 9–16 h. It is seen from Figure 10 that the user loads lower power consumption by 3,201 kW over 17–23 h and increase power consumption by 3,201 kW during 9–16 h. These kinds of transferable loads in the distribution network are mainly composed of production-type and service-type users who demonstrate great flexibility in electricity consumption, strong peak-shifting ability, and large calling potential to weaken the negative impacts of PV power fluctuations.
Owing to the relatively small capacities of ESSs in the distribution network, the numbers of charging and discharging times of the ESSs in a cycle increase significantly under scenario 3. In practical applications, ESSs generally have one-charging and one-discharging or two-charging and two-discharging strategies in accordance with the dispatch instructions as frequent charging and discharging can exacerbate their lifespans due to wear and tear, thereby reducing the economy of system operation. Therefore, failure to consider the constraints regarding the number of charge/discharge times of the ESSs is an area for improvement in this study.
In contrast to scenarios 1 and 2 where distributed PVs are able to operate at the planned outputs, the actual total PV output in scenario 3 is 20,559 kW, which is a reduction of 6,330 kW. Although the adjustable resources are used maximally, they still inevitably cut a part of the distributed PV output, which is mainly attributable to the limited regulation capacity constraint of the main grid resulting from actual grid operation; the gas units in the main grid can further reduce the output until shutdown to consume the distributed PV outputs in the present distribution network or to deliver a part of this residual energy to another distribution network to achieve the required PV power consumption. Therefore, subsequent studies can examine methods to further reduce the distributed PV outputs in the distribution network through coordination of network clusters.
The simulation of the power change at the cutoff point of the main distribution network is shown in Figure 13. From Figure 13, it is seen that the maximum interaction power of the main distribution network in scenario 3 is 2,000 kW while the minimum is 1,010 kW, for a maximum fluctuation of 990 kW of the main grid supply power. Meanwhile, the power curve is relatively flat, and the maximum power change in the adjacent time period is 100 kW, which are in line with the creep power limitations of the gas-fired units of the main grid during actual operation.
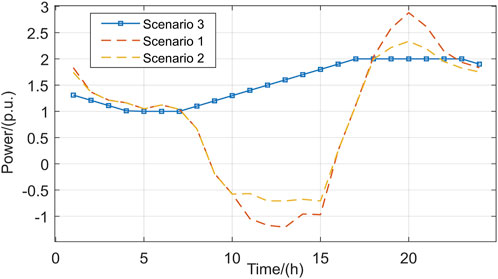
Figure 13. Interaction power at the main distribution cutoff point for scenario 3.
The power statistics at the demarcation point of the main distribution network under the three scenarios are shown in Table 2. As seen from Table 2, the fluctuation range of the interaction power of the main distribution network in scenario 3 is lower by 3,062 kW and 2,051 kW compared to those in scenarios 1 and 2, respectively, and the power fluctuation decreases significantly. At the same time, the maximum power fluctuation in the adjacent time period decreases by 1,123 kW and 857 kW compared to those in scenarios 1 and 2, respectively. The simulation results of scenario 3 reflect the limited regulation capacity of the main network; however, during actual operation, these results meet the requirement that the change in power supplied by the main network to the distribution network cannot be too fast. The simulation results of scenario 3 reflect the effectiveness of the active optimal scheduling method proposed for the distribution network.

Table 2. Comparison of interaction power at the cutoff point of the main distribution network before and after optimization.
6 Conclusion and prospects
At present, most of the studies on optimal dispatch of distribution networks containing high proportions of distributed PVs are based on the optimization of voltage stability and optimal economy as the objectives given a single means of regulation; at the same time, the impact of the limited regulating capacity of the gas units of the main grid on the optimal dispatch of distribution networks is neglected, especially with regard to maximum consumption of PV power. Hence, the following methods are proposed herein to address this issue:
1. We establish a model for maximum consumption of the distributed PV power in the distribution network by taking into account the reactive power compensation equipment, energy storage systems, controllable loads, and other adjustable resources and design an optimal distribution solution for the distribution network; this reduces the number of variables participating in the optimization at each step and accelerates the speed of optimization.
2. The proposed distribution network optimization scheduling method fully takes into account the limited regulation capacity of the main network to ensure that the distribution network purchases the least amount of power from the main network; further, the fluctuation amplitude and creep rate of the interacting power between the main and distribution networks are minimized to meet the actual operation of the gas-fired units of the main network. This helps in the analysis of the impact of the limited regulation capacity of the main network on maximum PV power consumption.
Although more types of regulation are considered in the proposed model, their scheduling costs are not analyzed, especially with regard to the compensation cost of the controllable loads, installation cost, and charge/discharge losses of the energy storage devices. During actual operation, frequent scheduling of user loads lowers user satisfaction and high-frequency redischarging of the energy storage devices reduces their service lives; hence, future studies could focus on balancing the interests of both supply and demand as well as improving the comprehensive economy of distribution network operation.
Given the accelerated pace of construction of new power systems, the connections between the distribution networks are increasingly becoming close. Thus, future research efforts can consider balancing and dispatching the surplus local PV outputs through other distribution networks, thereby reducing the burden of regulation of the main grid; moreover, new types of distribution networks can be constructed to handle higher proportions of distributed PV power.
Data availability statement
The original contributions presented in the study are included in the article/supplementary material, and any further inquiries may be directed to the corresponding author.
Author contributions
CG: conceptualization, resources, supervision, and writing–review and editing. WW: conceptualization, resources, and writing–review and editing. WZ: methodology, validation, and writing–original draft. ND: resources and writing–review and editing. XL: methodology and writing–review and editing. YD: methodology and writing–review and editing. DZ: conceptualization, methodology, resources, supervision, validation, and writing–review and editing.
Funding
The authors declare that no financial support was received for the research, authorship, and/or publication of this article.
Conflict of interest
Authors CG, WW, and ND were employed by State Grid Beijing Electric Power Company.
The remaining authors declare that the research was conducted in the absence of any commercial or financial relationships that could be construed as potential conflicts of interest.
Publisher’s note
All claims expressed in this article are solely those of the authors and do not necessarily represent those of their affiliated organizations or those of the publisher, editors, and reviewers. Any product that may be evaluated in this article or claim that may be made by its manufacturer is not guaranteed or endorsed by the publisher.
References
Cai, Y. X., Zhang, L., Tang, W., Xu, O. Y., Wang, J. L., and Song, Q. P. (2017). A voltage control strategy for LV distribution network with high proportion residential PVs considering reactive power adequacy of PV inverters. Power Syst. Technol. 41 (9), 2799–2808. doi:10.13335/j.1000-3673.pst.2017.0133
Chen, Z. Y., Wang, H., Wang, B. Y., Yang, L., Song, C., Zhang, X., et al. (2024). Scheduling optimization of electric ready mixed concrete vehicles using an improved model-based reinforcement learning. Automation Constr. 160, 105308. doi:10.1016/j.autcon.2024.105308
Deng, X. Y. (2019) Research on optimal dispatching of active distribution network considering “source-load-storage” collaborative interaction. Dissertation/Master’s Thesis. Beijing: North China Electric Power University.
Ding, T., Li, C., Yang, Y. H., Jiang, F. J., Bie, Z. H., and Blaabjerg, F. (2017). A two-stage robust optimization for centralized-optimal dispatch of photovoltaic inverters in active distribution networks. IEEE Trans. Sustain. Energy 8 (2), 744–754. doi:10.1109/TSTE.2016.2605926
Dvorkin, Y., Pandžić, H., Ortega-Vazquez, M. A., and Kirschen, D. S. (2015). A hybrid stochastic/interval approach to transmission-constrained unit commitment. IEEE Trans. Power Syst. 30 (2), 621–631. doi:10.1109/PESGM.2015.7285684
Ge, H. (2023). Impact of high proportion distributed photovoltaic integration into the grid network. Electron. Technol. 52 (3), 290–291.
Hu, Z. D., Liu, Y., and Zhong, L. (2008). Analysis of generator synchronization systematic test and synchronization process. Hunan Electr. Power 28 (6), 13–15.
Huang, Y. F., Liu, S. Y., Pang, S. L., and Gao, C. L. (2020). Calculation of ultimate capacity of network on acceptance of distribution PV system based on adaptive weight PSO algorithm. Guangdong Electr. Power 33 (4), 34–40.
Jiang, T., Fang, B. W., Chen, Y. P., Zhang, Y., Yang, L., Wang, K., et al. (2019). Coordinative optimal operation method of transmission and distribution networks based on multi-parametric programming. South. Power Syst. Technol. 17 (9), 10–19. doi:10.13648/j.cnki.issn1674-0629.2023.09.002
Li, D. X., Wang, J. R., and Zhang, J. J. (2021). Analysis of energy storage output characteristics based on photovoltaic volatility. Power Syst. Clean Energy 37 (2), 99–107.
Li, W. B. (2013) Studies on theory of power flow and optimization in power transmission-distribution grid. Dissertation/Master’s Thesis. Shandong: Shandong University.
Li, Z., Guo, Q., Sun, H., and Wang, J. (2016). Coordinated transmission and distribution AC optimal power flow. IEEE Trans. Smart Grid 9 (2), 1228–1240. doi:10.1109/TSG.2016.2582221
Li, Z. K., Bao, X. Y., Shao, Y. Y., Peng, P., and Wang, W. J. (2018). Studying accommodation ability of distributed photovoltaic considering various voltage regulation measures. Power Syst. Prot. Control 46 (8), 10–16.
Lin, Y. C., Li, J. P., Meng, A. B., Wang, L., and Ding, L. J. (2017). Multi-area dynamic economic dispatching based on improved differential evolution with crisscrossed optimization algorithm. Guangdong Electr. Power 30 (5), 69–76.
Lu, Z. G., Chen, W. K., Zhang, X. H., Zhang, D., and Ma, L. Y. (2015). Global maximum power supply capability analysis of city power grid. Power Syst. Technol. 39 (6), 1623–1630. doi:10.13335/j.1000-3673.pst.2015.06.025
Pan, Q. (2015) Study on units scheduling optimization problem for power system considering energy saving and emission reduction. Dissertation/Master’s Thesis. Shanghai: Shanghai Jiao Tong University.
Pandžić, H., Dvorkin, Y., Wang, Y. S., Qiu, T., and Kirschen, D. S. (2016). Toward cost-efficient and reliable unit commitment under uncertainty. IEEE Trans. Power Syst. 31 (2), 970–982. doi:10.1109/TPWRS.2015.2434848
Ruan, H. B., Gao, H. J., Liu, Y. B., Wang, L. F., and Liu, J. Y. (2020). Distributed voltage control in active distribution network considering renewable energy: a novel network partitioning method. IEEE Trans. Power Syst. 35 (6), 4220–4231. doi:10.1109/TPWRS.2020.3000984
Wang, Y. F., Li, Y. Z., Ye, H. B., Ling, X. B., and Lu, C. (2023). Dynamic voltage control of distribution network considering coordinated optimization of active power. Electr. Power Autom. Equip. 43 (2), 60–66. doi:10.16081/j.epae.202208034
Wu, M., Xu, B., Ji, Y., Song, Z. H., Sun, L. J., Ma, J., et al. (2019). Transmission-distribution-network-coordinated calculation method of maximum integration capacity of distributed generations. Power Syst. Technol. 43 (11), 3883–3890. doi:10.13335/j.1000-3673.pst.2019.1197
Xu, Z. C., Zhao, B., Ding, M., Zhou, J. H., and Wei, L. K. (2016). Photovoltaic hosting capacity evaluation of distribution networks and inverter parameters optimization based on node voltage sensitivity. Proc. CSEE 36 (6), 1578–1587. doi:10.13334/j.0258-8013.pcsee.2016.06.013
Zhang, S. H. (2021) Research on the ability of high permeability photovoltaic grid connection. Dissertation/Master’s Thesis. Beijing: North China Electric Power University.
Zhang, X., and Wang, H. T. (2019). Optimal dispatch method of transmission and distribution coordination for power systems with high proportion of renewable energy. Automation Electr. Power Syst. 43 (3), 67–75. 115.
Keywords: large urban distribution network, active power optimal scheduling, distributed photovoltaic, photovoltaic consumption, main distribution cooperation
Citation: Gong C, Wang W, Zhang W, Dong N, Liu X, Dong Y and Zhang D (2024) Active power optimisation scheduling method for large-scale urban distribution networks with distributed photovoltaics considering the regulating capacity of the main network. Front. Energy Res. 12:1450986. doi: 10.3389/fenrg.2024.1450986
Received: 18 June 2024; Accepted: 05 August 2024;
Published: 29 August 2024.
Edited by:
Chenghong Gu, University of Bath, United KingdomReviewed by:
Zhengyi Chen, Princeton University, United StatesJunjie Zhong, Changsha University of Science and Technology, China
Copyright © 2024 Gong, Wang, Zhang, Dong, Liu, Dong and Zhang. This is an open-access article distributed under the terms of the Creative Commons Attribution License (CC BY). The use, distribution or reproduction in other forums is permitted, provided the original author(s) and the copyright owner(s) are credited and that the original publication in this journal is cited, in accordance with accepted academic practice. No use, distribution or reproduction is permitted which does not comply with these terms.
*Correspondence: Wenhan Zhang, cG93ZXJ6d2hAbmNlcHUuZWR1LmNu