 Hongxia Li
 Haiguo Yu1
- 1Economic and Technological Research Institute of State Grid Qinghai Electric Power Company, Xining, Qinghai, China
- 2China Electric Power Research Institute, Beijing, China
Under the dual-carbon target, hydrogen energy, as a zero-carbon secondary energy source, has great scope for replacing fossil feedstocks in the fields of energy, transportation and industry. However, the current research on the competitiveness of hydrogen energy in various fields is not sufficiently addressed. In this paper, we use the LEAP model to predict the future scale of hydrogen use and the two-factor learning curve to predict the trend of hydrogen price change from 2025 to 2050, using Qinghai Province as the research background. At the same time, considering the carbon emission reduction benefits and raw material costs, the competitiveness of hydrogen energy in energy, transportation, industry and other fields in the future is compared. The results show that: 1) The hydrogen load scale in Qinghai Province will grow fast from 2025 to 2030. From 2030 to 2040, it slows under the steady and basic scenarios but remains high under the accelerated one. By 2040, the consumption scales are 1.057 million, 649,000 and 442,000 tons respectively. 2) The price of hydrogen energy will drop rapidly from the current 28 CNY/kg to about 20 CNY/kg in the next 5 years. By 2040, the price of hydrogen energy will be reduced to about 17 CNY/kg. 3) In terms of hydrogen energy competitiveness, when carbon emissions are not taken into account, hydrogen energy is currently competitive in the transportation field. During 2032–2038, it will be competitive in the field of methanol synthesis. By 2040, hydrogen energy will not be competitive in the fields of ammonia synthesis and power/heating. When considering carbon emissions, the competitiveness of hydrogen energy in the transportation field will become greater. The competitive year in the field of methanol synthesis will be 1–2 years ahead. By 2040, it will not be competitive in the field of synthetic ammonia and power/heating, but the gap will be significantly reduced due to the consideration of carbon emissions.
1 Introduction
Under the background of carbon peak and carbon neutrality, energy, transportation, industry and other fields in China are facing huge pressure of carbon emission reduction (Wang et al., 2023). The use of green hydrogen energy to replace traditional carbon-containing raw materials can significantly reduce carbon emissions in various industries and contribute to the realization of the dual-carbon goal (Elshafei and Mansour, 2023). As a province with more than 90% of the installed capacity of renewable sources, Qinghai Province has superior conditions for green hydrogen production (Peng, 2023). At the same time, the industry in Qinghai Province is dominated by steel and chemical industries, and carbon emissions account for more than 70% of the total emissions in Qinghai Province (Shi et al., 2023). Implementing a hydrogen energy substitution policy in Qinghai Province, focusing on industry with energy and transportation as supplementary areas, has a solid industrial foundation and ample carbon reduction potential. Therefore, it is urgent to calculate the scale of hydrogen load in Qinghai Province and discuss the competitiveness of hydrogen energy in various fields, so as to provide decision support for the development of hydrogen energy in Qinghai Province.
At present, the scale prediction methods for hydrogen energy can be mainly categorized into quantitative modeling, system dynamics analysis and scenario analysis, etc. Among them, the most widely used is the quantitative modeling method. Lane et al. (2021) used the logic function to fit the S-curve of hydrogen energy development and predicted the global demand for hydrogen from 2025 to 2050. Park Changeun et al. (2022) predicted the hydrogen demand for transportation in South Korea using Bass, logistic and Gompertz models as well as analogical methods. Based on the global automobile hydrogen market penetration. Zulfhazli et al. (2024) predicted the hydrogen demand of G20 countries from 2022 to 2050. Huang et al. (2022) analyzed the evolution of China‘s hydrogen demand from three aspects of petroleum refining industry, ammonia industry and automobile market by combining system dynamics theory and scenario analysis method, and predicted China‘s hydrogen demand by 2030 under three different scenarios. On the whole, the current research mainly focus on the overall results of hydrogen energy prediction, or simply split the prediction results into broad sectors such as industry and electricity, lacking a detailed description of the classification of hydrogen energy demand.
Hydrogen energy cost prediction involves many links such as hydrogen production, storage, transportation and application. At present, the research mainly focuses on technical and economic analysis. Medhat et al. (Nemitallah et al., 2024) and Hafiz Muhammad et al. (Ayub et al., 2024) discuss the efficiency and cost of different hydrogen production methods. Simon. Öberg et al. (2022) consider exogenous (industry and transport) and endogenous (time-shifting of electricity generation) hydrogen demands, and construct a techno-economic optimization model to analyze the parameters affecting the cost of hydrogen. (Oliva and Garcia, 2023) discuss the effect of variable energy prices and renewable energy generation on the annualized cost of hydrogen. Although the above research considers the impact of multi-dimensional factors on the cost of hydrogen production, it only discusses the current cost of green hydrogen and does not study the future trend of hydrogen energy cost. Revinova et al. (Revinova et al., 2023) used single factor learning curve to fit the learning rate of electrolytic cell cost and electricity cost, and then obtained the learning rate of hydrogen production cost. D. Franzmann et al. (Franzmann et al., 2023) analyzed the cost potential of hydrogen energy in 28 selected countries around the world up to 2050 based on an optimized energy system with open-air photovoltaics and onshore wind. Gandhi et al. (2023) predicted the price change of hydrogen energy in the United Arab Emirates from 2022 to 2050 by fitting the cost learning rate of electrolyzers. Dumančić et al. (2023) discussed the competitiveness of traditional fossil fuels such as electrolytic hydrogen production and natural gas in gas-fired power plants before 2050. Although the above research considers the impact of future technological changes on the cost and price of hydrogen energy, it ignores the impact of scale effect of hydrogen energy production.
Hydrogen energy production in Qinghai Province is in its infancy, with less historical data and a more prominent role of policy influence, making it difficult to use the modeling method to predict the future scale. In addition, the system dynamic analysis method also requires a large number of parameters and data support (Wang et al., 2024). The LEAP model, on the other hand, is a bottom-up energy-environment accounting tool for energy planning or forecasting, energy balance sheets and environmental pollutant inventories, and greenhouse gas emission reduction analysis. The model is able to analyze hydrogen loads in conjunction with different scenarios and years, thus overcoming the limitations of other methods. In view of this, this paper selects the LEAP model (Long-range Energy Alternatives Planning System) which does not require large amounts of historical data to support based on the scenario analysis method, sets three scenarios of base, steady and acceleration, and predicts the hydrogen consumption scale of the four fields of industry, electricity, transportation and heating in Qinghai Province. Secondly, combined with the prediction results of hydrogen scale, the scale-technology two-factor learning curve is used to analyze the future hydrogen energy cost of Qinghai Province. Finally, the competitiveness of hydrogen energy in replacing conventional materials in various fields is discussed with the cost of raw materials as the key influencing factor, which is able to predict hydrogen prices more comprehensively and accurately provides decision support for China‘s hydrogen energy utilization.
2 Methodology
The research route of this paper includes two parts: hydrogen load scale prediction based on LEAP model and hydrogen load cost prediction based on two-factor learning curve. The overall framework is shown in Figure 1.
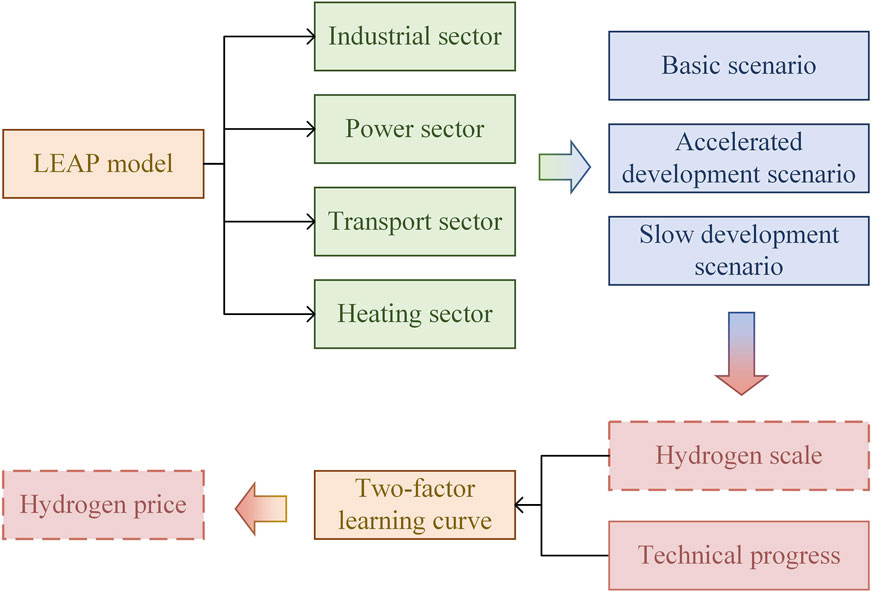
Figure 1. Research framework.
2.1 Prediction of hydrogen load scale based on LEAP model
LEAP model is established by sector activity analysis, which is a bottom-up energy-environment accounting tool based on scenario analysis (Nojedehi et al., 2016). The LEAP model includes energy supply, energy processing conversion, terminal energy demand and other links, which can be mainly applied to energy planning or forecasting, energy balance sheets and environmental pollutant lists, greenhouse gas emission reduction analysis and comprehensive resource utilization planning (Zhang et al., 2022; Qi et al., 2023).
The prediction method of hydrogen load scale proposed in this paper is based on the LEAP model. The terminal hydrogen demand is divided into four departments: industry, electricity, transportation and heating. Through the data input of each dimension, the hydrogen load of different scenarios and years is analyzed.
The total hydrogen load in Qinghai Province contains hydrogen loads in four areas: industry, electricity, transportation and heating. The prediction equation of hydrogen load is as shown in Equation 1:
Where,
2.1.1 Industrial field
The industrial field mainly considers the use of hydrogen in the chemical industry and the iron and steel industry, which are modeled in Equation 2:
Where,
The specific calculation model for its hydrogen load is shown in Equation 3:
Where,
Where in Equation 4,
Where in Equation 5,
2.1.2 Electricity field
In the field of electricity, hydrogen mixed combustion engines and hydrogen fuel cell power generation are mainly considered. The model is as shown in Equation 6:
Where,
Where in Equation 7, aelec is the proportional coefficient, which is different in different scenarios.
2.1.3 Transport field
The field of transportation mainly considers the hydrogen demand for land transportation and water transportation. The model is shown in Equation 8:
Where,
The specific calculation model for its hydrogen load is shown in Equation 9:
Where,
Where in Equation 10,
Where in Equation 11, atrans is the proportional coefficient, which is different in different scenarios.
2.1.4 Heating field
The heating field mainly considers the hydrogen demand for residential district heating and the delivery of the Seninglan pipeline. The model is shown in Equation 12:
Where,
The specific calculation model of hydrogen load is shown in Equation 13:
Where,
Where in Equation 14, aheat is the proportional coefficient, which is different in different scenarios.
2.2 Hydrogen load cost prediction based on two-factor learning curve
2.2.1 Model construction
By predicting the future cost of hydrogen, the competitiveness of hydrogen energy in various fields, such as industry and electricity, can be effectively analyzed to provide reference for the development of hydrogen energy industry. Learning Curve (LC) is an effective model to analyze the general law of dynamic change of technology cost, which has been widely used in various fields (Anzanello and Fogliatto, 2011). The traditional learning curve model is a model that only contains a single explanatory variable (cumulative output), and the reason for the reduction of technical costs is the ' learning by doing ' effect, that is, the increase in cumulative output leads to an increase in production efficiency (Nemet, 2006). Its expression shown in Equations 15, 16:
Where,
However, the single factor model attributes all the reasons for the reduction of technology costs to the " learning by doing " effect, ignoring the impact of technology research and development (R&D) on technology costs, and the estimated value of learning efficiency is often too large. Therefore, this paper adds technological progress factors into the learning curve, and uses the two-factor (scale-technology) learning curve to predict the change of hydrogen load cost (Dai et al., 2024). Its expression is shown in Equations 17, 18:
Where,
Using the LEAP model‘s hydrogen load forecast results as a variable to describe the output, the model expression becomes the following is shown in Equation 19:
2.2.2 Coefficient fitting and evaluation
Since the coefficients
At this point, the optimal valuation of the elasticity coefficients
Where,
3 Data and scenarios setting
3.1 LEAP model
This section describes in detail the application of the LEAP model and its data setup for hydrogen load sizing forecasts in Qinghai Province. Firstly, the geographic location, energy structure and hydrogen energy development potential of Qinghai Province are summarized to provide a practical background for the model. Then, based on the guiding document on hydrogen energy development issued by the Qinghai provincial government, 2025, 2030 and 2035 are set as key time nodes, and detailed data input settings are made around these time nodes. As shown in Figure 2, Qinghai Province is located in the Qinghai-Tibet Plateau in western China, which is rich in hydropower, solar and wind energy resources. By the end of 2023, the installed capacity of clean energy power generation in Qinghai Province was 51.08 million kilowatts, accounting for 93% of the total installed capacity, and it has the industrial base for producing low-cost green hydrogen energy. In addition, Qinghai Province has a variety of hydrogen consumption scenarios, and has a large demand for hydrogen energy in the fields of industry, energy, transportation and so on. Therefore, the case analysis of hydrogen energy scale and price prediction in Qinghai Province is representative and forward-looking, which can provide reference for the development of hydrogen energy in other provinces.
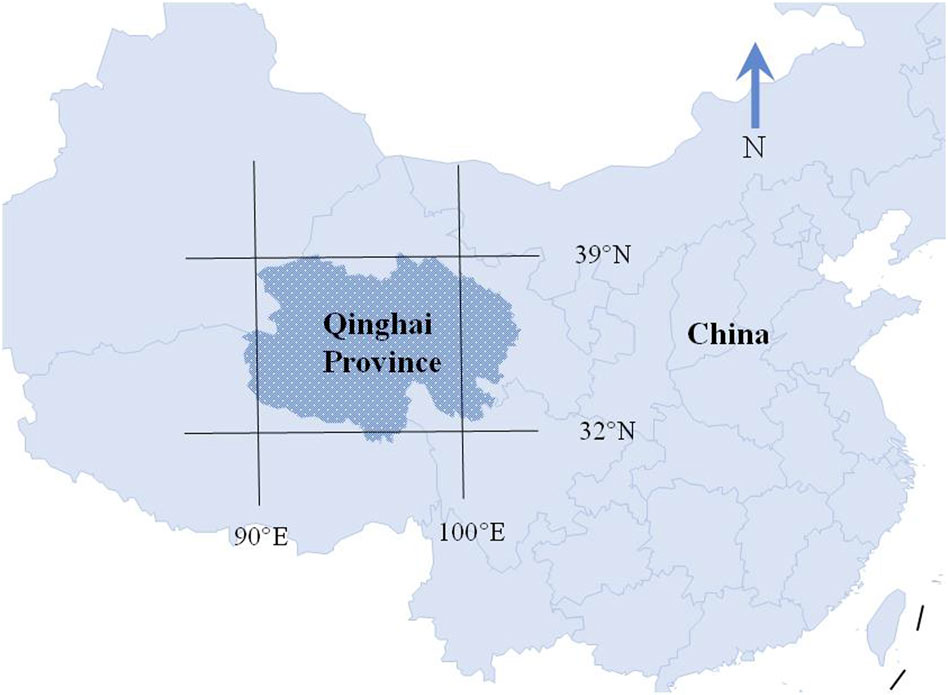
Figure 2. Geographical location of Qinghai Province.
3.1.1 Data setting
Referring to the guidance documents on hydrogen energy development issued by the Qinghai Provincial Government, such as “Medium and Long-term Plan for the Development of Hydrogen Energy Industry in Qinghai Province (2022–2035)”, etc., the detailed input data of the model are set up with 2025, 2030 and 2035 as the time nodes. The specific settings are as follows:
3.1.1.1 Industrial field
By 2025, the production capacity of green hydrogen will reach about 4 × 10⁴ tons, and no less than two green hydrogen chemical demonstration projects will be built. Demonstration application is carried out in the field of green hydrogen chemical coupling salt lake and green hydrogen chemical coupling new energy. Five green hydrogen chemical enterprises were introduced or cultivated, and the output value of the whole industrial chain of green hydrogen chemical industry reached 2×10⁹ CNY.
By 2030, the production capacity of green hydrogen will reach 3 × 10⁵ tons, realizing the large-scale application of green hydrogen in the chemical industry. More than 20 green hydrogen chemical enterprises have been introduced or cultivated, and the output value of the whole industrial chain of green hydrogen chemical industry has reached 15×109 CNY. In the industrial park to achieve the following capacity: annual output of 6 × 10⁵ tons of green methanol, 6 × 10⁵ tons of green ethylene glycol, 6 × 10⁵ tons of green ammonia.
By 2035, the green hydrogen synthesis of green ammonia, methanol, ethylene glycol, dimethyl carbonate (DMC), triene triphenyl and downstream terminal chemical product delivery market will be built.
3.1.1.2 Electricity field
By 2030, the pilot implementation of hydrogen mixed gas turbine power generation project, hydrogen fuel cell power generation peak shaving projects.
By 2035, the large-scale application of hydrogen mixed gas turbine power generation and hydrogen fuel cell power generation peak shaving will be realized.
3.1.1.3 Transport field
By 2025, 100 hydrogen energy tour buses will be put on key tourist routes such as Xining-Qinghai Lake-Ta’er Temple; put 50 hydrogen intercity bus in Xining City; in Haidong zero carbon industrial park and other parks, some mining areas put about 100 heavy trucks; layout of “hydrogen production-hydrogenation-hydrogen energy cruise ship” integration project along the Yellow River Basin.
By 2030, about 1,000 hydrogen fuel vehicles will be put into operation in the fields of urban intercity bus, municipal administration, intercity passenger transport, park logistics, factory and mine transportation, with 10 operating lines.
By 2035, about 3,000 hydrogen fuel vehicles will be deployed in the province, and 50 hydrogen fuel cell intercity bus and commuter routes will be established.
3.1.1.4 Heating field
By 2030, the pilot implementation of natural gas pipeline hydrogen blending project.
By 2035, the natural gas hydrogen blending transportation project will be carried out in the Seninglan pipeline: the natural gas hydrogen blending transportation will be carried out in the Seninglan pipeline according to 10%–20%, and the designed gas transmission capacity will be 3 × 10⁹ m3/year.
3.1.2 Scenarios setting
In the scenario setting, we have chosen an average annual growth rate of 5% based on a comprehensive analysis of historical data and trends specific to Qinghai Province, as well as alignment with numerous studies in the energy sector (Huang et al., 2024; IEA, 2023). The detailed settings for each scenario are as follows:
3.1.2.1 Base scenario
The data setup is based entirely on policies such as “Medium and Long-Term Plan for the Development of Hydrogen Energy Industry in Qinghai Province (2022–2035)” proposed by the Development and Reform Commission of Qinghai Province and the Energy Bureau of Qinghai Province. Since 2035, the average annual growth rate has been 5%.
3.1.2.2 Steady development scenario
Based on the base scenario, when the action is less than the policy expectation, the expected time for the completion of hydrogen project construction in Qinghai Province will be delayed. From 2025 to 2035, some hydrogen construction plans were not successfully implemented. Since 2030, the average annual growth rate is 3%.
3.1.2.3 Accelerated development scenario
Based on the base scenario, the intensity of action is stronger than the policy expectation. Qinghai will complete the policy requirements of 2035 ahead of schedule, and the growth rate of hydrogen load is higher than the policy scenario. From 2025 to 2035, hydrogen projects outside the policy plan will be approved and successfully constructed. Since 2030, the average annual growth rate is 7%.
3.2 Two-factor learning curve model data setting
As shown in the methodology in section 2, the cost factor data in the model is characterized by the hydrogen load prediction results of the LEAP model, and the technological progress factor data is characterized by the cumulative R&D investment. Among them, there is no official statistical data on cumulative R&D investment. Therefore, the well-known enterprises in the “hydrogen energy” concept section of China‘s stock market are selected, and the R&D expenses (considering the time value) in their semi-annual/annual financial statements are used to approximately represent, as shown in Table 1:
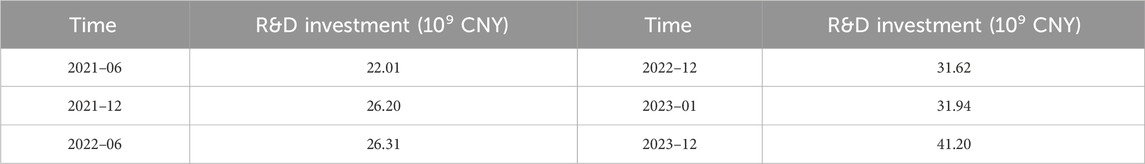
Table 1. Cumulative R&D investment of hydrogen energy from 2021 to 2023.
The historical hydrogen price data refer to the Hydrogen Price Index of China Hydrogen Energy Alliance Research Institute (China Hydrogen Energy Alliance, 2024) and are adjusted according to the market reality, as shown in Figure 3:
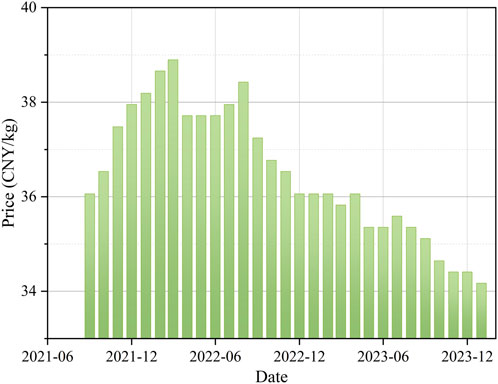
Figure 3. Prices of hydrogen energy in 2021–2023.
4 Results and discussion
4.1 Prediction results of hydrogen load scale
According to the relevant policy plan of hydrogen energy development in Qinghai Province, this paper sets 2024 as the base period and 2025–2040 as the forecast period. After inputting relevant parameters according to Section 3.1, the prediction results of future hydrogen load scale in Qinghai Province are shown in Figure 4.
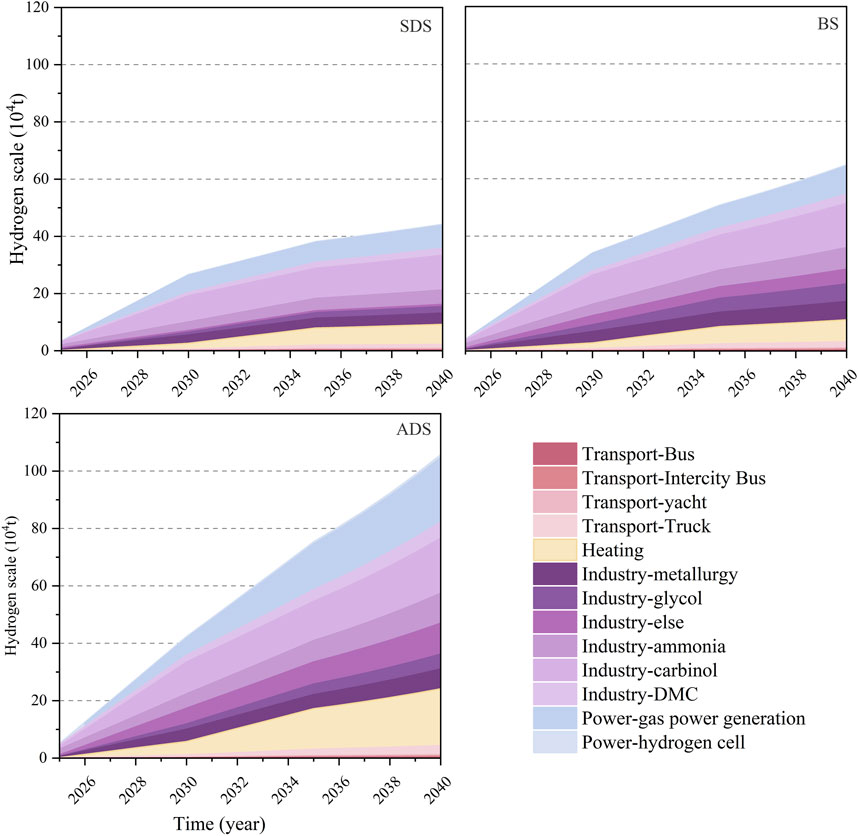
Figure 4. Scale of hydrogen load in Qinghai Province under different scenarios.
It can be seen from Figure 4 that no matter which scenario, the hydrogen load will usher in rapid growth from 2025 to 2030. Under the steady development scenario and the base scenario, the growth of hydrogen load scale will slow down between 2030 and 2040; however, under the accelerated development scenario, the scale of hydrogen load will still maintain a high growth rate between 2030 and 2040. From the horizontal comparison, in 2025, the scale of hydrogen used in the accelerated development scenario is 51,000 tons, which is 24.4% higher than the base scenario. By 2040, the scale of hydrogen used in the accelerated development scenario will reach 105.7 tons, which is 62.9% higher than the base scenario, and the gap will be further widened. For the steady development scenario, its scale in 2025 is 17.1% lower than the base scenario; by 2040, the steady development scenario will use 44.2 tons of hydrogen, which is 31.9% lower than the base scenario.
In Figure 5, the inner, middle, and outer circles represent the hydrogen energy share of different scenarios under 2025, 2030, and 2035, respectively. Because in the LEAP model, the increase in the scale of hydrogen energy in 2035–2040 is calculated in the form of a fixed growth rate, the proportion of hydrogen energy in various fields in 2035–2040 does not change, and the proportion of 2040 is omitted in Figure 5.
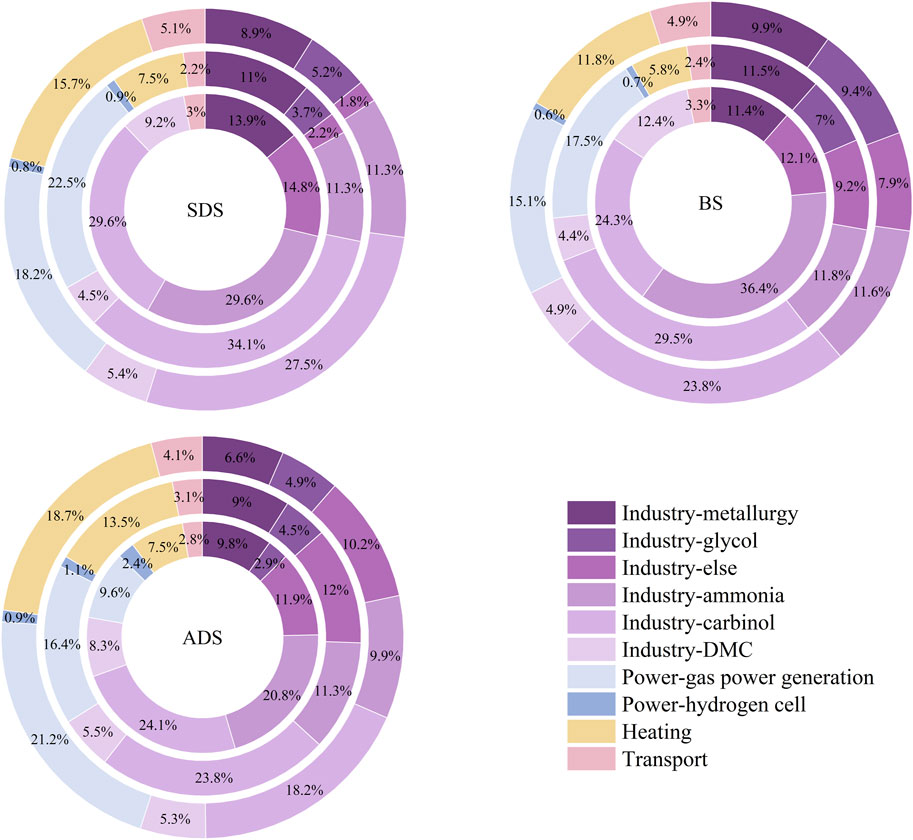
Figure 5. Percentage of hydrogen load by category under different scenarios.
In terms of classification, hydrogen accounts for the largest proportion in the industrial field, followed by electricity, heating and transportation. Under the base scenario, industrial hydrogen will account for 96.7% of total hydrogen consumption in 2025; with the increase of hydrogen load in other fields, the proportion of industrial hydrogen load gradually decreases. By 2040, the proportion is reduced to 67.6%, but it is still the first type of hydrogen load. Compared with the base scenario, the proportion of hydrogen used in the industrial sector in the steady development scenario and the accelerated development scenario has decreased, but the reasons for the decline are different: in the steady development scenario, the reduction of industrial hydrogen consumption has led to a decrease in its proportion. For example, in 2040, the industrial hydrogen consumption in the steady development scenario is 172,000 tons less than that in the base scenario, accounting for 83.1% of the total difference in hydrogen energy scale between the two scenarios. In the accelerated development scenario, the large increase in hydrogen consumption in other areas (especially in the power sector) has led to a decrease in the proportion of hydrogen used in the industrial sector. In 2040, the proportion of growth in the three areas will be 35.0%, 32.4% and 29.7% respectively.
As shown in Figure 6, large-scale use of hydrogen energy in different fields has brought significant carbon emission reduction effects. By 2040, the carbon emission reductions under the three scenarios of steady, basic and accelerated are 3.487, 4,586 and 8.608 million tons, respectively. It is worth noting that due to the large amount of carbon emissions generated by coal-fired electricity, carbon emission reductions in the electricity sector are only slightly lower than those in the industrial sector, even if the scale of hydrogen energy in the electricity sector is far less than that in the industrial sector. For example, in 2040 of ADS, the proportion of hydrogen energy in the power sector was 22.1%, which was 32.8% smaller than that in the industrial sector. However, in terms of carbon emission reduction, the proportion of carbon emission reduction in the power sector is 39.0%, which is only 2% smaller than that in the industrial sector.
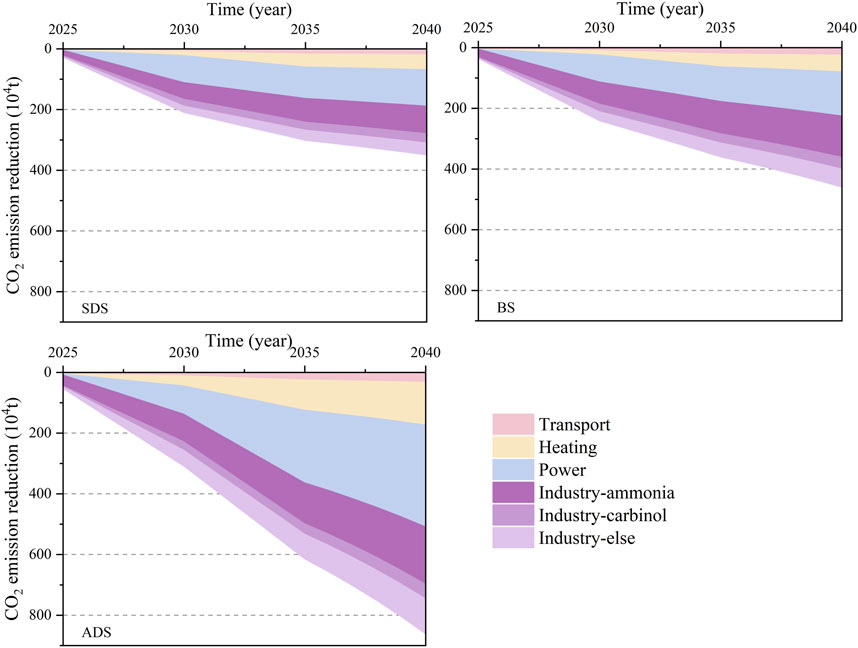
Figure 6. Carbon reduction effects of different scenarios.
4.2 Results of hydrogen cost prediction
Based on the historical hydrogen scale data and the historical R&D cost data in Table 1, the parameters of the two-factor learning curve are fitted. Bring the data into Equation 20, and use the least squares method to obtain the value of the parameter. The fitting results are shown in Equation 22:
According to Equations 16, 18, the learning rate of scale factors in the two-factor learning curve is 5.78%, and the learning rate of technical factors is 5.56%. It can be seen that the scale factor plays a more important role in reducing the cost of hydrogen energy. The goodness of fit of the model is 0.9269, so it can be considered that the fitting effect is good.
Equation (26) is used to predict the cost of hydrogen energy from 2025 to 2040. The results of the hydrogen load forecast in Section 4.1 were used as the scale parameter of the two-factor learning curve; based on the historical R&D costs in Section 3.2, the regression model is used to predict the R&D costs from 2025 to 2040, and the predicted results are used as the technical parameters of the two-factor learning curve. In addition, considering that the prediction results of hydrogen load scale are divided into three scenarios, the R&D cost is also set in different scenarios. Since existing studies have shown that a fluctuation range of 15%–20% can ensure that the forecast results are neither too conservative nor too aggressive (Armstrong, 2001), 0.2 is selected as the R and D cost reduction/increase coefficient. The direct forecast results y(t) are used for the base scenario, y(t)·(1–0.2) for the steady development scenario, and y(t)·(1 + 0.2) for the accelerated development scenario. The prediction results of hydrogen energy price are shown in Figure 7:
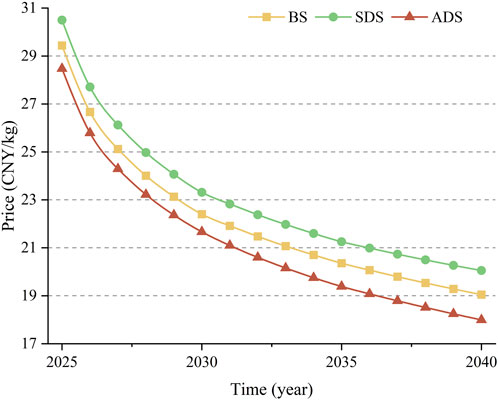
Figure 7. Hydrogen energy price forecast results.
As can be seen in Figure 7, the price of hydrogen energy will drop rapidly from the current 28 CNY/kg to about 20 CNY/kg in the next 5 years. By 2040, the price of hydrogen energy will be reduced to about 17 CNY/kg. Comparing the three scenarios, compared with the base scenario, the price drop is larger in the accelerated development scenario. By 2040, the price of hydrogen energy in the accelerated development scenario is 15.3 CNY/kg, which is 6.5% lower than that in the base scenario. Compared with the base scenario, the steady development of hydrogen energy prices fell less. By 2040, the price of hydrogen energy in the steady development scenario is 17.4 CNY/kg, which is 6.1% higher than that in the base scenario.
Compared with other research results (Table 2), it can be seen that the forecast of future hydrogen energy prices in this paper is slightly pessimistic. This is mainly due to the fact that ref1-3 uses the USD as the unit of forecast results, whereas this paper uses the CNY. Considering the fluctuation of the exchange rate between USD and CNY and the different progress of hydrogen energy development among countries, the forecast results of this paper can be used as a reference for the price of hydrogen energy in China.
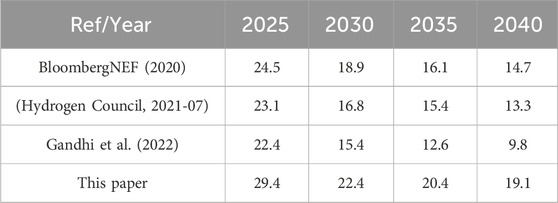
Table 2. Comparison of predicted results with published studies (CNY/kg).
Figure 8 shows the cost of producing one kWh of energy from the combustion of fuels such as hydrogen, natural gas, coal and diesel. In China, diesel is mostly used in transportation, and coal and natural gas are mostly used in power and heat generation, and after years of development, the unit energy prices of diesel, natural gas and coal have leveled off. It can be seen that hydrogen energy has a significant advantage compared with diesel, so it is easier to promote hydrogen energy products in the transportation field. However, although the unit calorific value of hydrogen is very high, the cost of generating unit energy is still higher than that of natural gas and coal due to its high unit price. In addition, China’s power and heat generation systems based on natural gas and coal are already relatively complete and technologically mature, with lower unit costs compared to emerging hydrogen systems. Therefore, the competitiveness of hydrogen in the field of power generation and heating is not strong, and the government needs to subsidize it in the early stage. In addition, in 2036, the unit capacity cost of hydrogen energy will reach the level of high-priced natural gas. Considering the emission reduction benefits of hydrogen, hydrogen energy basically has the ability to compete with natural gas in 2036.
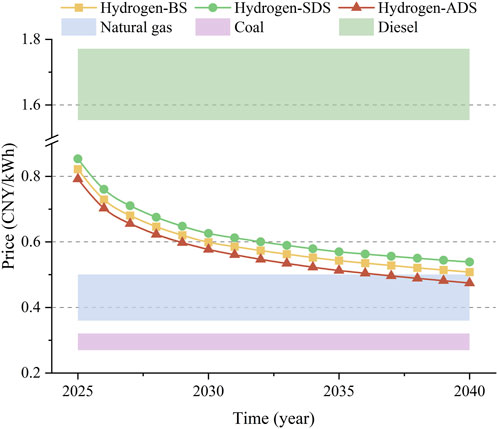
Figure 8. Price comparison of unit energy generated by different fuels.
The development of China’s hydrogen energy industry is relatively late, and the early development of hydrogen energy industry relies on coal resources, green hydrogen-related infrastructure and technology development is insufficient; hydrogen storage, transmission and use of hydrogen links are all kinds of problems to be solved; the development of the industrial chain is not perfect. As a result, hydrogen energy is not competitive compared to coal. In fact, the economics in this paper do not take into account the overall economic improvement brought about by the incorporation of hydrogen into different systems, and the versatility, cleanliness, and high efficiency of hydrogen can enhance its competitiveness in other ways in the subsequent development of hydrogen energy compared to other fuels. As a fuel that can be obtained in large quantities without relying on fossil fuels and can be transported over long distances and stored for long periods of time, hydrogen can be expanded to more industrial fields and more energy production and consumption segments and play a positive role as a substitute for many chemical raw materials; as a clean energy with high energy density, hydrogen can be utilized on the production side of the energy system by utilizing electrolytic water to produce hydrogen technology, and by storing hydrogen to achieve electricity storage and improve the flexibility of the power system, thus promoting the development and use of renewable energy on a larger scale, and thus enhancing its competitiveness in other ways. As a highly energy-dense clean energy, hydrogen can be used in the energy production end by electrolysis hydrogen production technology, to achieve electric energy storage through hydrogen storage, to improve the flexibility of the power system, to promote the development and utilization of renewable energy on a larger scale, and to reduce the cost of power supply of the overall power generation system; as a flexible and efficient secondary energy source, hydrogen can be used on the energy consumption end by using fuel cell technology to realize the complementary and synergistic optimization of the interconnection of multiple energy networks, such as electric power, gas, heat, and so on, to enhance the efficiency of the end-use of energy, to push forward the transformation of the energy structure, and to achieve the value of the electricity security.
5 Conclusion
In this paper, the LEAP model is used to predict the future development scale of hydrogen load in Qinghai Province, and the two-factor learning curve is used to predict the future hydrogen price. Finally, taking the cost of raw materials as the key influencing factor, the competitiveness of hydrogen energy in replacing conventional materials in various fields is analyzed. The research results are helpful for the government and enterprises to formulate long-term hydrogen energy development strategies, improve the market competitiveness of hydrogen energy, and promote the sustainable development of hydrogen energy. The main conclusions of this study are summarized as follows:
(1) In the prediction of the scale of hydrogen load in Qinghai Province, the hydrogen load will grow rapidly between 2025 and 2030; under the steady development scenario and the base scenario, the growth of hydrogen load scale will slow down between 2030 and 2040; however, under the accelerated development scenario, the scale of hydrogen load will still maintain a high growth rate between 2030 and 2040. By 2040, the scale of hydrogen consumption in Qinghai Province under the three scenarios of acceleration, foundation and stability will be 1.057 million tons, 649,000 tons and 442,000 tons, respectively.
(2) In terms of hydrogen energy price forecast, the price of hydrogen energy will drop rapidly from the current 28 CNY/kg to about 20 CNY/kg in the next 5 years; by 2040, the price of hydrogen energy will be reduced to about 17 CNY/kg. From the perspective of unit capacity cost, hydrogen energy has a competitive price advantage with diesel; by 2036, hydrogen could compete with natural gas. Before 2040, hydrogen energy does not have the ability to compete with coal for the time being.
(3) In future research, the application of hydrogen energy in more fields will be considered, and the benefits of carbon emission reduction will be quantified into the cost of hydrogen energy, and the specific contribution of technological research and development to the reduction of the cost of hydrogen energy will be further refined, including the selection and optimization of different technological routes. In addition, the competitiveness of hydrogen energy in this paper is compared under the price of hydrogen energy as a product. In the future, the price of hydrogen energy under the scenario of abandoning wind and light to produce hydrogen in Qinghai will be considered.
Data availability statement
The original contributions presented in the study are included in the article/supplementary material, further inquiries can be directed to the corresponding author.
Author contributions
HL: Conceptualization, Methodology, Validation, Writing–review and editing. HY: Conceptualization, Methodology, Validation, Writing–review and editing. HW: Conceptualization, Methodology, Validation, Writing–review and editing. XG: Visualization, Writing–original draft. FL: Visualization, Writing–original draft. LL: Visualization, Writing–original draft. QW: Visualization, Writing–original draft. XZ: Investigation, Writing–original draft. YL: Investigation, Writing–original draft.
Funding
The author(s) declare that financial support was received for the research, authorship, and/or publication of this article. This work was supported by the State Grid Qinghai Electric Power Company, the Science & Technology project (522830230009). The funder was not involved in the study design, collection, analysis, interpretation of data, the writing of this article, or the decision to submit it for publication.
Conflict of interest
Authors HL, HY, HW, XG, and FL were employed by Economic and Technological Research Institute of State Grid Qinghai Electric Power Company.
The remaining authors declare that the research was conducted in the absence of any commercial or financial relationships that could be construed as a potential conflict of interest.
Publisher’s note
All claims expressed in this article are solely those of the authors and do not necessarily represent those of their affiliated organizations, or those of the publisher, the editors and the reviewers. Any product that may be evaluated in this article, or claim that may be made by its manufacturer, is not guaranteed or endorsed by the publisher.
References
Anzanello, M. J., and Fogliatto, F. S. (2011). Learning curve models and applications: literature review and research directions. Int. J. Ind. Ergon. 41, 573–583. doi:10.1016/j.ergon.2011.05.001
Armstrong, J. S. (2001). Principles of forecasting: a handbook for researchers and practitioners (Boston, MA: Springer US).
Ayub, H. M. U., Alnouri, S. Y., Stijepovic, M., Stijepovic, V., and Hussein, I. A. (2024). A cost comparison study for hydrogen production between conventional and renewable methods. Process Saf. Environ. Prot. 186, 921–932. doi:10.1016/j.psep.2024.04.080
BloombergNEF (2020). Hydrogen economy outlook. Bloom. Com. Available at: https://data.bloomberglp.com/professional/sites/24/BNEF-Hydrogen-Economy-Outlook-Key-Messages-30-Mar-2020.pdf (Accessed July 11, 2024).
Changeun, P., Sesil, L., Jungwoo, S., and Chul-Yong, L. (2022) How much hydrogen should be supplied in the transportation market? Focusing on hydrogen fuel cell vehicle demand in South Korea: hydrogen demand and fuel cell vehicles in South Korea. Technol. Forecast. and Soc. Change,2022,181. doi:10.1016/J.TECHFORE.2022.121750
China Hydrogen Energy Alliance (2024). Hydrogen industry observation. Chinah2data.com. Available at: https://www.chinah2data.com/file/bigdata-docs/f3b025e955cbb25c66c6d5b881a8ea65.pdf (Accessed May 9, 2024).
Dai, Y., Shu, Y., and Zeng, Y. (2024). Use of learning curve to explore the competition between renewables and conventional fossil fuel power technologies in China. Energy Strat. Rev. 52, 101352. doi:10.1016/j.esr.2024.101352
Dumančić, A., Vlahinić Lenz, N., and Majstrović, G. (2023). Can hydrogen production be economically viable on the existing gas-fired power plant location? New empirical evidence. Energies 16, 3737. doi:10.3390/en16093737
Elshafei, M. A., and Mansour, R. (2023). Green hydrogen as a potential solution for reducing carbon emissions: a review. J. Energy Res. Rev. 13 (2), 1–10. doi:10.9734/jenrr/2023/v13i2257
Franzmann, D., Heinrichs, H., Lippkau, F., Addanki, T., Winkler, C., Buchenberg, P., et al. (2023). Green hydrogen cost-potentials for global trade. arXiv [econ.GN] 48, 33062–33076. doi:10.1016/j.ijhydene.2023.05.012
Gandhi, K., Apostoleris, H., and Sgouridis, S. (2022). Catching the hydrogen train: economics-driven green hydrogen adoption potential in the United Arab Emirates. Int. J. Hydrogen Energy 47, 22285–22301. doi:10.1016/j.ijhydene.2022.05.055
Gandhi, K., Apostoleris, H., and Sgouridis, S. (2023). Catching the hydrogen train: economics-driven green hydrogen adoption potential in the United Arab Emirates. Int. J. Hydrogen Energy 47, 22285–22301. doi:10.1016/j.ijhydene.2022.05.055
Huang, J., Li, W., and Wu, X. (2022). Forecasting the hydrogen demand in China: a system dynamics approach. Mathematics 10, 205. doi:10.3390/math10020205
Huang, Y., Zhou, Y., Zhong, R., Wei, C., and Zhu, B. (2024). Hydrogen energy development in China: potential assessment and policy implications. Int. J. Hydrogen Energy 49, 659–669. doi:10.1016/j.ijhydene.2023.10.176
Hydrogen Council (2021). Hydrogen insights 2021[R/OL]. Available at: https://hydrogencouncil.com/en/hydrogen-insights-2021/.
IEA (2023). Energy technology perspectives 2023. IEA. Available at: https://www.iea.org/reports/energy-technology-perspectives-2023 (Accessed July 22, 2024).
Lane, B., Reed, J., Shaffer, B., and Samuelsen, S. (2021). Forecasting renewable hydrogen production technology shares under cost uncertainty. Int. J. Hydrogen Energy 46, 27293–27306. doi:10.1016/j.ijhydene.2021.06.012
Nemet, G. F. (2006). Beyond the learning curve: factors influencing cost reductions in photovoltaics. Energy Policy 34, 3218–3232. doi:10.1016/j.enpol.2005.06.020
Nemitallah, M. A., Alnazha, A. A., Ahmed, U., El-Adawy, M., and Habib, M. A. (2024). Review on techno-economics of hydrogen production using current and emerging processes: status and perspectives. Results Eng. 21, 101890. doi:10.1016/j.rineng.2024.101890
Nojedehi, P., Heidari, M., Ataei, A., Nedaei, M., and Kurdestani, E. (2016). Environmental assessment of energy production from landfill gas plants by using Long-range Energy Alternative Planning (LEAP) and IPCC methane estimation methods: a case study of Tehran. Sustain Energy Technol. Assessments 16, 33–42. doi:10.1016/j.seta.2016.04.001
Öberg, S., Odenberger, M., and Johnsson, F. (2022). The cost dynamics of hydrogen supply in future energy systems – a techno-economic study. Appl. Energy 328, 120233. doi:10.1016/j.apenergy.2022.120233
Oliva, H. S., and Garcia, G. M. (2023). Investigating the impact of variable energy prices and renewable generation on the annualized cost of hydrogen. Int. J. Hydrogen Energy. 48, 13756–13766. doi:10.1016/j.ijhydene.2022.12.304
Peng, Na (2023). Qinghai clean energy development report 2022. Released. Qinghai Provincial People's Government. Available at: http://www.qinghai.gov.cn/zwgk/system/2023/08/22/030023742.shtml (Accessed May 8, 2024).
Qi, C., Meng, J., Che, B., Kang, J., Zhao, Y., and Hua, Z. (2023). Transition to a zero-carbon energy system in the Ningxia area: integrated CO2 reduction measures from the multi-level perspective. Front. Energy Res. 11. doi:10.3389/fenrg.2023.1305885
Revinova, S., Lazanyuk, I., Ratner, S., and Gomonov, K. (2023). Forecasting development of green hydrogen production technologies using component-based learning curves. Energies 16, 4338. doi:10.3390/en16114338
Shi, J., Tang, H., Zhou, Q., Han, L., and Hao, R. (2023). High frequency measurement of carbon emissions based on power big data: a case study of Chinese Qinghai province. Sci. Total Environ. 902, 166075. doi:10.1016/j.scitotenv.2023.166075
Wang, L., Li, Z., Xu, Z., Yue, X., Yang, L., Wang, R., et al. (2024). Carbon emission scenario simulation and policy regulation in resource-based provinces based on system dynamics modeling. J. Clean. Prod. 460, 142619. doi:10.1016/j.jclepro.2024.142619
Wang, X., Tang, R., Meng, M., and Su, T. (2023). Research on CCUS business model and policy incentives for coal-fired power plants in China. Int. J. Greenh. Gas. Control 125, 103871. doi:10.1016/j.ijggc.2023.103871
Yao, Y., Xu, J.-H., and Sun, D.-Q. (2021). Untangling global levelised cost of electricity based on multi-factor learning curve for renewable energy: wind, solar, geothermal, hydropower and bioenergy. J. Clean. Prod. 285, 124827. doi:10.1016/j.jclepro.2020.124827
Zhang, Z., Jia, J., Guo, Y., Wu, B., and Chen, C. (2022). Scenario of carbon dioxide (CO2) emission peaking and reduction path implication in five northwestern provinces of China by the low emissions analysis platform (LEAP) model. Front. Energy Res. 10. doi:10.3389/fenrg.2022.983751
Keywords: hydrogen energy, LEAP model, cost prediction, learning curve, carbon emission reduction
Citation: Li H, Yu H, Wang H, Gou X, Liu F, Li L, Wang Q, Zhang X and Li Y (2024) Prediction of hydrogen consumption scale and hydrogen price based on LEAP model and two-factor learning curve. Front. Energy Res. 12:1450966. doi: 10.3389/fenrg.2024.1450966
Received: 18 June 2024; Accepted: 12 August 2024;
Published: 28 August 2024.
Edited by:
Shiyu Yang, Oregon Institute of Technology, United StatesReviewed by:
Xiaobao Yu, Shanghai University of Electric Power, ChinaWei Fan, Beihang University, China
Nie Yan, Lanzhou University, China
Xiaolong Yang, Northeast Electric Power University, China
Copyright © 2024 Li, Yu, Wang, Gou, Liu, Li, Wang, Zhang and Li. This is an open-access article distributed under the terms of the Creative Commons Attribution License (CC BY). The use, distribution or reproduction in other forums is permitted, provided the original author(s) and the copyright owner(s) are credited and that the original publication in this journal is cited, in accordance with accepted academic practice. No use, distribution or reproduction is permitted which does not comply with these terms.
*Correspondence: Lixin Li, bGlsaXhpbkBlcHJpLnNnY2MuY29tLmNu