 Jincan Zeng1
 Lang Tang
 Nan Shang
 Peng Wang
- 1Energy Development Research Institute, China Southern Power Grid, Guangzhou, China
- 2Guangzhou Institute of Energy Conversion, Chinese Academy of Sciences, Guangzhou, China
- 3Planning & Research Center for Power Grid, Yunnan Power Grid Corp, Kunming, China
To investigate the supply-demand balance of regional power systems under extreme scenarios, this study employs the high-resolution power optimization model SWITCH-China to simulate the regional heterogeneity and randomness of extreme weather events in detail. Focusing on the five southern provinces, this study explores various impacts on the power generation side and the grid side under scenarios of reduced wind and solar power output, transmission line failures, and combined scenarios, proposing strategies for constructing a new power system. The main conclusions are: the reduction in wind and solar power output significantly affects provinces with a high proportion of these installations, like Guizhou, necessitating other stable power generation forms to compensate. Transmission line failures notably impact provinces like Guangdong, which rely heavily on imported electricity, requiring increased investment in new wind and solar installations and more self-generated power to offset the reduction in imported electricity. The combination of these factors amplifies their individual impacts, leading to the highest carbon reduction and electricity costs. The simulation results of this study are valuable for China’s five southern provinces in coping with extreme scenarios. As these provinces work on building a new power system and gradually retire fossil fuel units, they should expand the number and capacity of inter-provincial high-voltage transmission lines while considering system economics. Additionally, accelerating the deployment of energy storage is crucial for maintaining power system stability.
1 Introduction
In October 2021, the State Council issued the “Action Plan for Carbon Peaking Before 2030,” which proposed “building a new power system with an increasing proportion of renewable energy and promoting the large-scale optimization of clean power resources.” To achieve the goals of carbon peaking and carbon neutrality, the power system must transition from a reliance on fossil fuel power generation to one primarily based on clean energy sources (Luderer et al., 2019). On 9 October 2023, China Southern Power Grid Corporation released the “Southern Power Grid New Power System Development Report” (the “Report”). The Report indicates that the clean power supply framework in Guangdong, Guangxi, Yunnan, Guizhou, and Hainan provinces is largely established, with a new power system featuring an increasing proportion of new energy under construction. Currently, these five southern provinces have a larger share of electricity demand and new energy generation compared to other regions in the country. To address the energy security issues arising from the energy transition, such as source, network, load, and storage in the regional power system, it is essential to study the impact of wind and photovoltaic power output fluctuations, which are significantly influenced by meteorological factors (Peng et al., 2024), as well as the impact of transmission and distribution line faults on the medium- and long-term stability of the power system (Daisy et al., 2023). This study aims to propose effective countermeasures for these challenges.
The imbalance between supply and demand affects all aspects of the power system, including source, network, storage, and load. Current research mainly focuses on the following areas:
From the power supply side, Compared to traditional fossil fuels, the economic viability of non-fossil energy sources like wind and solar is continuously improving (Sun et al., 2021). However, the impact on the safety of the power system varies with different types of new energy and their different penetration rates (Wang et al., 2024; Mahmood et al., 2024). Systems with wind and solar power generation need to prioritize capacity optimization (Zhao et al., 2024) and avoid wind and photovoltaic (PV) power curtailment (Chen et al., 2022), as the output uncertainty of wind and PV power is more significant than other types of power generation. Existing solutions primarily involve the integration of wind, solar, and storage, which can effectively mitigate the impact of load fluctuations on the stable operation of the power grid (Emrani and Berrada, 2024). The above supply-side research mainly focuses on the short-term fluctuations of solar resources, with less analysis of how these fluctuations affect the long-term transformation of the power system.
From the grid side, regional or inter-provincial transmission can enhance mutual aid capacity (Yang et al., 2022), but high-voltage transmission lines between provinces face capacity limitations and transmission losses. Additionally, meteorological factors affect line impedance and fault outages (Li et al., 2023; Yang et al., 2022), and rebuilding regional transmission lines in extreme scenarios requires considerable time and investment. Therefore, it is essential to comprehensively consider the cost-effectiveness of self-generation, high-voltage transmission, and energy storage in the load area.
From the energy storage perspective, pumped hydro storage has a significant economic advantage in enhancing the system's supply security (Maio et al., 2024). However, chemical energy storage responds more quickly to short-term load fluctuations (Lee et al., 2024). Therefore, electrochemical energy storage is a better option for addressing short-term load balancing and extreme scenarios (Deguenon et al., 2023) Given the high cost and limited lifespan of energy storage stations, it is essential to include storage costs alongside various generation and transmission costs in the overall optimization of the power system's operation to achieve the dual objectives of operational safety and cost minimization.
Extreme weather events (such as significant fluctuations in wind and solar output) and transmission line failures significantly impact the power supply and demand balance in each province (Huang et al., 2024). However, detailed simulation studies of the Chinese power system in existing literature rarely involve these two scenarios. Most existing studies mainly focus on the impact of regional differences on China’s power system (Huang et al., 2017; Li et al., 2022; Li et al., 2023), seldom emphasizing the interactions between provinces within a single region and how load areas achieve supply-demand balance. Addressing these gaps, this study aims to minimize costs using the high-resolution power optimization model SWITCH-China. It simulates the regional heterogeneity and randomness of wind and solar power output reductions under the context of carbon peaking and carbon neutrality in the national power sector. This study examines changes in power supply and grid sides in the five southern provinces under scenarios of reduced wind and solar power output and transmission line failures, as well as the impact of these changes on carbon reduction costs and per-unit electricity costs in the national power sector. Based on the scenario analysis results for the five southern provinces, measures are proposed to ensure the balance of energy supply and demand in response to reduced wind and solar output.
2 Model methodology and data sources
2.1 SWITCH-China
SWITCH is a loose acronym for Solar, Wind, Hydro, and Investment in Conventional Technology. SWITCH-China is a power optimization model (He et al., 2016) that can simulate the cost-minimized configuration of wind, solar, hydro, and conventional technology generation and transmission in China’s power sector. It is mainly used to analyze the economic and technological impacts under medium- and long-term decarbonization scenarios in the power sector (He et al., 2020). The model has finer granularity in time and space scales compared to general power optimization models, with hourly precision in time and provincial precision in space. To reduce model solving time, typical years and typical days are set to represent continuous 5-year and 1-month periods, respectively. For example, this study selects the typical investment years of 2023, 2028, 2033, 2038, 2043, 2048, 2053, and 2058, corresponding to investment periods of 2023–2027, 2028-2032, 2033-2037, etc. Typical days are selected based on actual loads, with each typical day consisting of six time points corresponding to 0:00, 4:00, 8:00, 12:00, 16:00, and 20:00.
2.1.1 Model mechanism
The SWITCH-China model aims to minimize costs of generation, transmission, and distribution. As shown in Figure 1, it constrains the power supply side through carbon limits, load demand, unit operations, and technological developments. Additionally, the grid and storage sides are constrained by transmission line selection and scheduling, respectively. The optimization results in different power generation combinations, capacity configurations, carbon reduction costs, and other components of the power system.

Figure 1. Model operation mechanism.
2.1.2 Power system simulation
From the power supply side, the generation technologies include six main categories: coal, gas, wind, solar, hydro, and nuclear. The model comprehensively considers the fuel costs of fossil fuel power generation and the price curve fluctuations of wind and solar power. Under cost minimization and carbon constraints, existing units will be retired according to preset retirement times, and new units of various types will be continuously built to meet power demand under cost constraints.
From the grid side, each province’s geographical area is treated as an independent load area, forming a network that conducts local transmission and distribution within each region and long-distance high-voltage transmission between regions. The length of transmission lines between regions is based on the distances between provincial capitals, with transmission directions being unidirectional from one load area to another, all under cost constraints.
From the storage side, the model differentiates between pumped storage and electrochemical storage. The construction of storage power stations is adjusted based on electricity load demand and cost constraints, similar to new power generation units.
From the load side, the SWITCH-China model pre-sets the predicted power demand of each province according to investment periods as input data and sets a 15% capacity reserve margin to meet various overload scenarios in the power system.
2.2 Data sources
This study builds upon the latest version of SWITCH-China, with data adjustments and expansions based on existing research or provincial energy development plans. The following settings apply to wind and solar power output and transmission line simulations.
2.2.1 Unit capacity factors
Wind and solar resources exhibit regionality and spatial differences, and their output characteristics are unstable and uncertain over time (Sun et al., 2024). Thus, depicting scenarios of reduced wind and solar power output, such as “no wind” and “no light,” requires precision in both time and space scales. According to studies on the power and characteristics of Chinese wind and photovoltaic units (Liu et al., 2020), a “no wind” event can be defined when the wind speed is less than or equal to 3 m/s during wind power generation. A “no light” event can be defined when the horizontal radiation intensity for daytime power generation of photovoltaic units is less than or equal to 30W/m2.
As shown in Table 1, the main data comes from the literature (Liu et al., 2020), which statistically analyzes the occurrence frequency of sustained 4-h “no wind” and daytime 4-h “no light” events in each season of the year in southern regions. “No wind” events occur similarly across the four seasons in the south, with an average of 33 times per quarter and 11 times per month for sustained 4-h “no wind” events. “No light” events mainly occur in the spring, autumn, and winter seasons in the southern region, with an average of once per month.
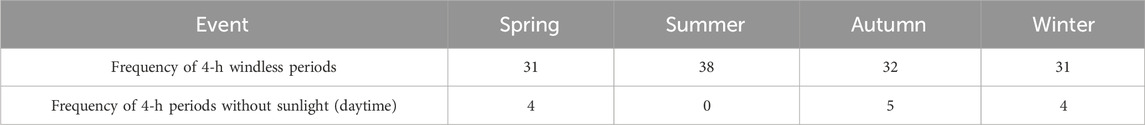
Table 1. Frequency of “windless” and “sunlight-absent” events in the south region.
In the SWITCH-China model, the impact of weatherIn October 2021, the State Council issued the “Action Plan for Carbon Peaking Before 2030,” which proposed “building a new power system with an increasing proportion of renewable energy and promoting the large-scale optimization of clean power resources."
Based on Table 1, the probabilities of extreme weather events were calculated for typical days to derive the expected occurrences of such events. On average, “no wind” events occur approximately 2.2 times across six time nodes in a typical day. These events typically occur at times of stable environmental temperatures, such as noon or early morning, when air convection is weak or nonexistent. Consequently, the SWITCH-China model sets two of the three time nodes (0:00, 4:00, 12:00) with zero wind capacity factors to represent “no wind” occurrences. Similarly, photovoltaic output mainly occurs during the daytime, with “no light” events primarily modeled at 8:00 and 16:00, choosing one of these time points as the “no light” event in a typical day.
2.2.2 Regional transmission line failures
In the SWITCH-China model, grid transmission lines are unidirectional. To simulate the scenario where the southern five provinces face high-voltage transmission line failures, power transmission into these provinces and between them is disrupted. However, transmission from these provinces to other regions remains normal to avoid affecting the power balance in other load areas. When local power generation cannot meet demand due to transmission line failures, new transmission lines may be constructed, albeit at higher costs and potentially limited capacities. The model optimizes cost by balancing the construction of new generation units or transmission lines to meet the demand.
2.2.3 Electricity demand of the five southern provinces
Power demand is an exogenous parameter in the SWITCH model and needs to be predetermined. For comparability, power demand in different scenarios remains constant across provinces. The demand growth rates for the five southern provinces are based on related research and forecasts (Jin et al., 2024). The load curves for the typical years and days are also defined. For instance, Figure 2 shows the load curve for the five southern provinces in 2030, indicating significant fluctuations in Guangdong, with increased demand during July to September. Similar patterns are observed in other provinces during the summer.
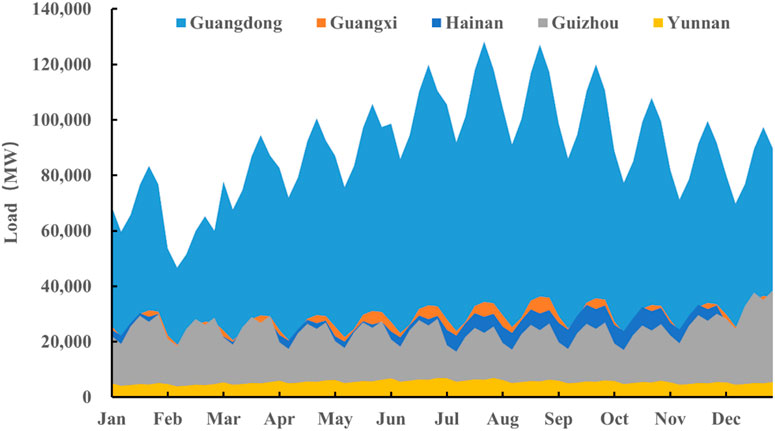
Figure 2. Load curve of the five southern provinces in 2030.
3 Scenario setup
To explore the impact of reduced wind and photovoltaic power output or existing transmission line failures on the power balance in the five southern provinces, the study sets the baseline and three extreme scenarios as shown in Table 2. The power demand for each province remains unchanged across scenarios, determined by actual load requirements. In the baseline scenario, data for the five southern provinces are sourced from statistical yearbooks or power company records. The three extreme scenarios involve adjustments to factors related to solar and wind power output or transmission line conditions beyond the baseline scenario, as simulated based on Sections 2.2.1 and 2.2.2 of this paper.
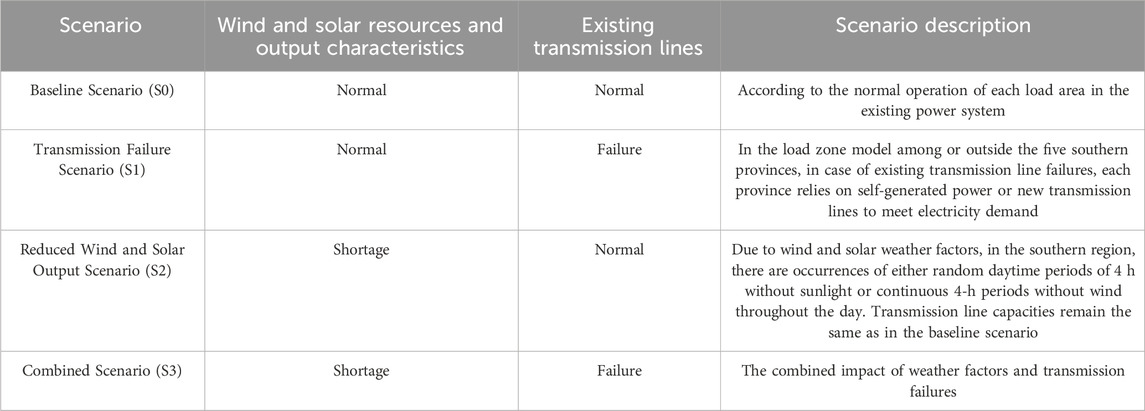
Table 2. Scenario setting.
Baseline Scenario (S0): Wind and photovoltaic units operate normally, and power is transmitted through existing high-voltage lines, achieving a supply-demand balance under current constraints and technological goals.
Transmission Failure Scenario (S1): Wind and solar output remain normal, but existing high-voltage input lines to the five southern provinces fail (output lines remain functional). New transmission lines are required to balance the load.
Reduced Wind and Solar Output Scenario (S2): Due to weather, wind and solar output decrease. Increased local generation and external power imports are needed to meet the demand.
Combined Scenario (S3): Both reduced wind and solar output and transmission line failures occur, necessitating greater investment in local generation.
4 Results analysis
4.1 Carbon emissions in the power sector
Carbon emissions, constrained as a key objective, primarily arise from fossil fuel units like coal and gas, significantly impacted by the “30-60″goals. Figure 3 shows the carbon emissions trajectory for China’s power sector, peaking around 2027-2029 and achieving zero emissions by 2060 (Wang et al., 2024). The SWITCH model sets a typical year to represent 5 years, so it requires peaking before the existing peak time for better simulation. The peak is set for 2023-2025 in this study, with emissions at 4.134 billion tons, declining to net zero by around 2060.
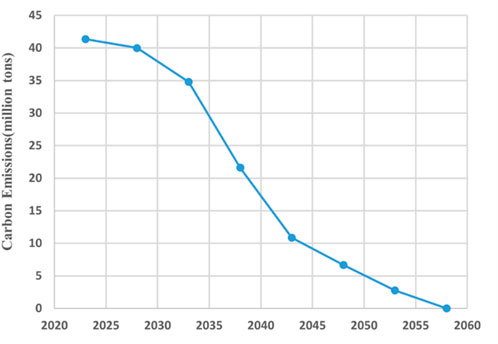
Figure 3. Carbon emissions from China’s power sector from 2025 to 2060.
4.2 Power self-sufficiency rate of the five southern provinces
The self-sufficiency rates of the five southern provinces are influenced by their installed capacities and power generation. Provinces with varying wind and solar installations have different degrees of reliance on self-generated power when facing climatic impacts. Additionally, part of the electricity demand in each province is met through power imports from other load areas.
Figure 4 illustrates the primary sources of electricity (self-generated or imported) for the five southern provinces in 2030 and 2060 under the baseline scenario. The horizontal axis represents the power demand of each province, while the vertical axis represents the self-generated power. The ratio of self-generated power to demand indicates the self-sufficiency rate, reflecting the balance between supply and demand. Larger bubbles represent lower self-sufficiency rates, indicating a greater need for external power imports to maintain balance.
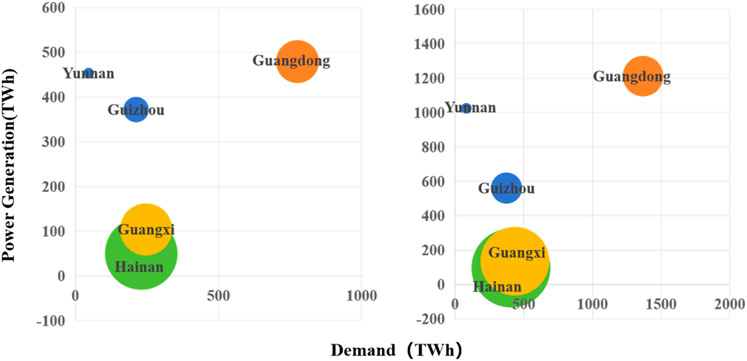
Figure 4. Baseline scenario of electricity demand and self-generated electricity in five southern provinces in 2030 and 2060.
Based on whether the self-sufficiency rate is greater than 1 (self-generation exceeds demand) or less than 1 (self-generation falls short of demand), the five southern provinces can be categorized as follows:
Self-Sufficient Provinces: Yunnan and Guizhou.
Non-Self-Sufficient Provinces: Guangdong, Guangxi, and Hainan.
For detailed analysis, selected provinces from each category will be further examined.
4.3 Installed capacity and generation mix
The scenarios and model calculations reveal the installed capacity and generation mix for the five southern provinces in 2030 (see Figure 5). Weather impacts significantly affect wind and solar output, necessitating increased investments in these resources to compensate for reduced output and manage load fluctuations. Consequently, more wind and solar units are built, and coal-fired units are utilized for peak shaving, leading to reduced wind and solar installations and increased coal-fired generation under cost optimization.
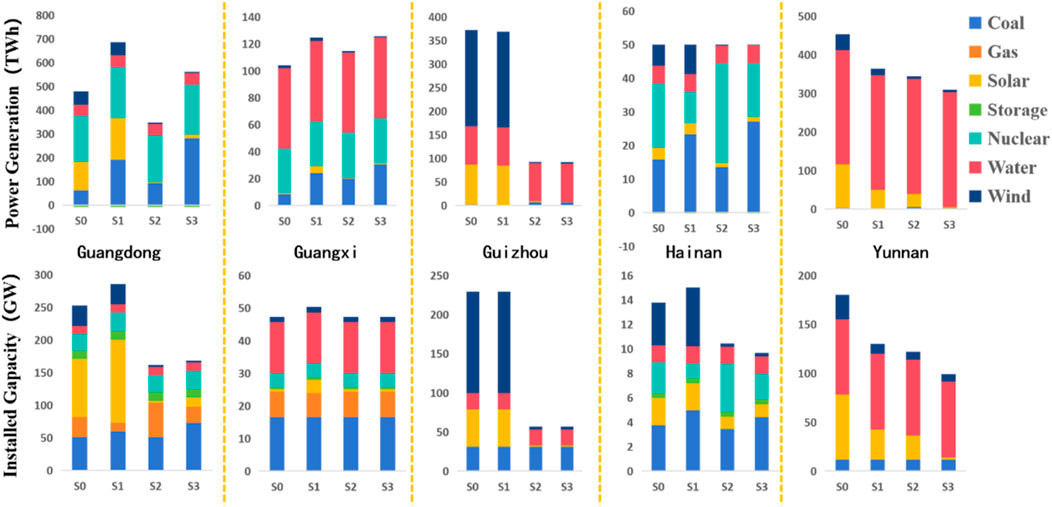
Figure 5. Installed capacity and power generation in various scenarios in five southern provinces in 2030.
In Guizhou, where the self-sufficiency rate is greater than 1, surplus self-generated power is exported. The province has a significant proportion of wind and solar installations, making it highly sensitive to reductions in these resources. In 2030, under Scenario S2 compared to S0, power generation and installed capacity decreased by 278.94 GWh and 172.16 GW, respectively.
When comparing Scenario S0 (normal conditions) and S1 (transmission line failures), provinces like Guangdong, with self-sufficiency rates less than 1, need to generate more self-generated power to meet demand. In 2030, Guangdong’s power generation and installed capacity increased by 207.34 TWh and 33.45 GW, respectively.
Scenario S3 vs S2 demonstrates that further self-generation is required when wind and solar output is reduced, and transmission lines fail. Provinces with higher coal-fired capacity, such as Guangdong, increase coal-fired generation under Scenario S3 by 91.77 TWh and 189.56 TWh compared to S1 and S2, respectively. Coal-fired units play a crucial role in maintaining supply-demand balance when transmission is insufficient, or wind and solar output is low. For provinces with self-sufficiency rates greater than 1, like Yunnan, local demand is low, and external transmission gradually decreases despite unaffected internal supply.
As electricity demand grows, external power purchases become challenging to meet, constrained by local generation types and carbon reduction targets. As shown in Figure 6, by 2060, the power generation mix will primarily consist of nuclear, wind, solar, and hydropower, with a small amount of coal or gas for peak shaving. In non-self-sufficient provinces like Guangdong, Guangxi, and Hainan, the share of nuclear power increases significantly in the absence of alternative generation types. In the baseline scenario, nuclear power generation in Guangdong and Hainan increases from 10.06% to 28.36% and from 18.30% to 31.86% from 2030 to 2060, respectively. Provinces with larger self-sufficiency rates and fewer hydropower and nuclear installations, such as Yunnan, will compensate for reduced wind and solar output by increasing installations to maintain supply-demand balance.
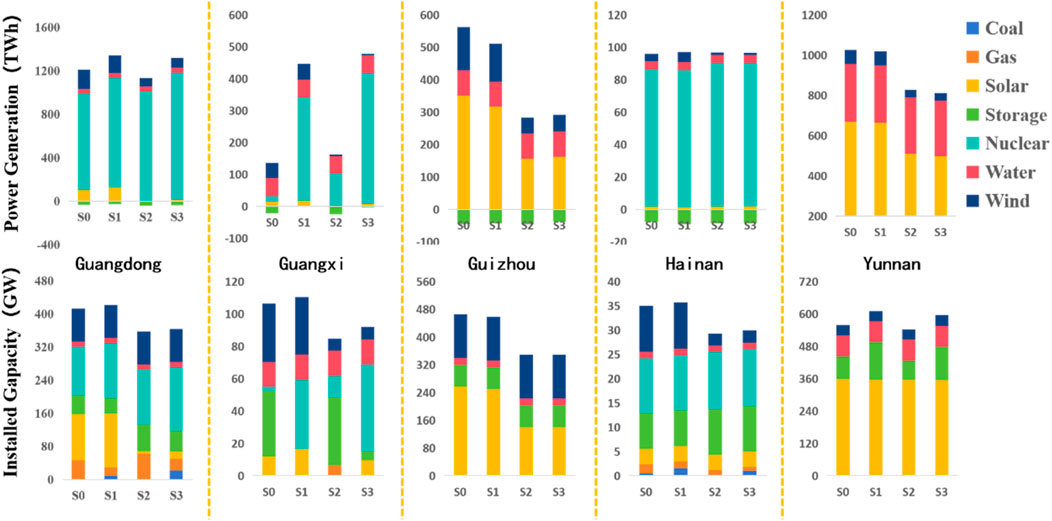
Figure 6. Installed capacity and electricity generation in various scenarios in the five southern provinces in 2060.
4.4 Power consumption in the load area
Yunnan Province has the highest self-sufficiency rate, with electricity generation capacity from its units far exceeding demand. Therefore, during the investment period, Yunnan mainly exports electricity to meet the electricity demand of other load areas. In contrast, the other three provinces, represented by Guangdong, have a self-sufficiency rate of less than 1. Apart from self-generated electricity, they also require a large amount of purchased electricity to meet their demands.
Figure 7 illustrates Guangdong’s power transmission and distribution for 2030 and 2060. “XTPowerNet” represents the transmission power from other load areas to this load area, “ZoneTotalCentralDispatch” represents the total dispatch power in this region, “StorageNetCharge” represents the energy storage charging power. In 2030, under the baseline scenario, both self-generated and imported electricity contribute significantly. Under Scenario S1 (transmission line failure), Guangdong compensates by increasing self-generated power. Under Scenario S2 (reduced wind and solar output), Guangdong relies heavily on imported electricity to balance supply and demand. In Scenario S3 (both reduced self-generation and transmission failure), Guangdong invests in new transmission lines and generating units to address insufficient output and reduced imports. By 2060, under prolonged reduced wind and solar output and increasing demand, the cost-optimal solution is to investing in additional generating projects, with transmission primarily used for peak shaving in summer.
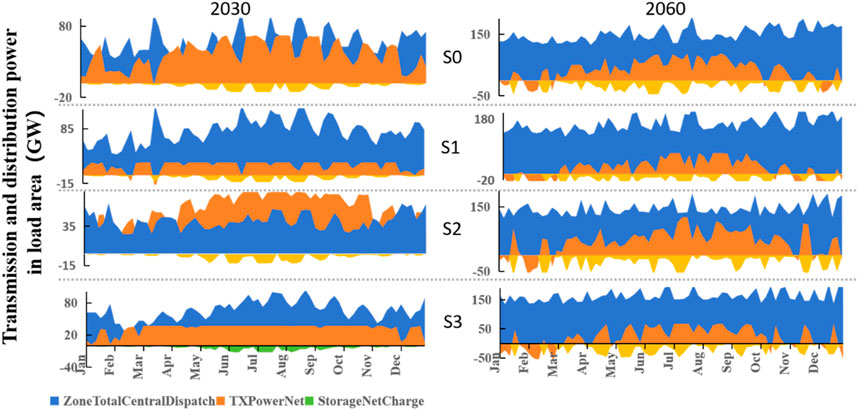
Figure 7. Transmission and distribution power in Guangdong in 2030 and 2060.
Yunnan’s power transmission and distribution for 2030 and 2060 are depicted in Figure 8. Yunnan consistently exports large amounts of electricity across all scenarios. In 2030, exports peak from June to September due to high load demands across southern China and the nation. By 2060, Yunnan maintains high levels of power export throughout the year, with midday marking the peak for both generation and transmission. Part of this power is directed to other load areas via high-voltage transmission lines, and another part is stored through energy storage systems.
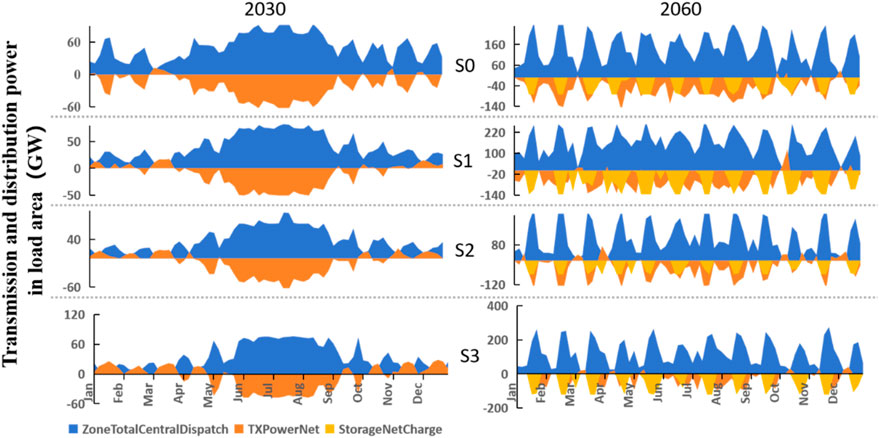
Figure 8. Transmission and distribution power of Yunnan in 2030 and 2060.
4.5 Energy storage charging and discharging
Guangdong, with its large and fluctuating power demand, relies significantly on both self-generated and imported electricity, necessitating substantial energy storage to stabilize the grid and promote renewable energy integration. The SWITCH-China model includes two primary forms of energy storage: pumped hydro storage and electrochemical storage.
Figure 9 shows the power of different forms of energy storage in Guangdong under the 2030 baseline scenario. In optimization aimed at minimizing costs, pumped hydro storage is chosen as the primary form of energy storage, particularly during periods of low peak shaving and renewable energy integration demand. During months with lower electricity load demands in Guangdong, such as January to April and October to December, the overall charge and discharge power are low. Energy storage is thus used less frequently during these times, with discharge power being low and steady. During months with higher electricity load demands, the charging power is high, resulting in significant discharge from pumped hydro storage, which is sustained over time.
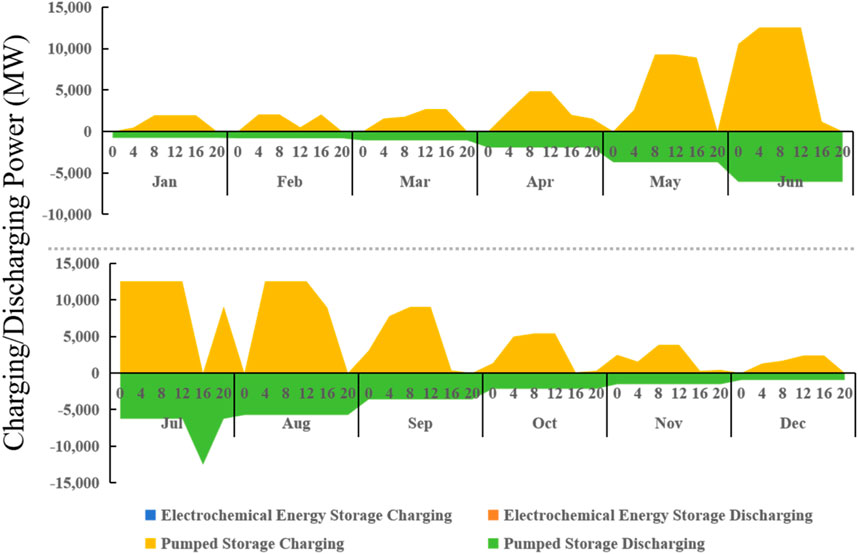
Figure 9. Baseline scenario of Guangdong’s energy storage charging and discharging power in 2030.
As shown in Figure 10, when renewable energy penetration increases and pumped hydro storage reaches its capacity limits, electrochemical storage becomes the primary form. On a typical day, electrochemical storage discharges after 16:00, while it primarily charges during other times.
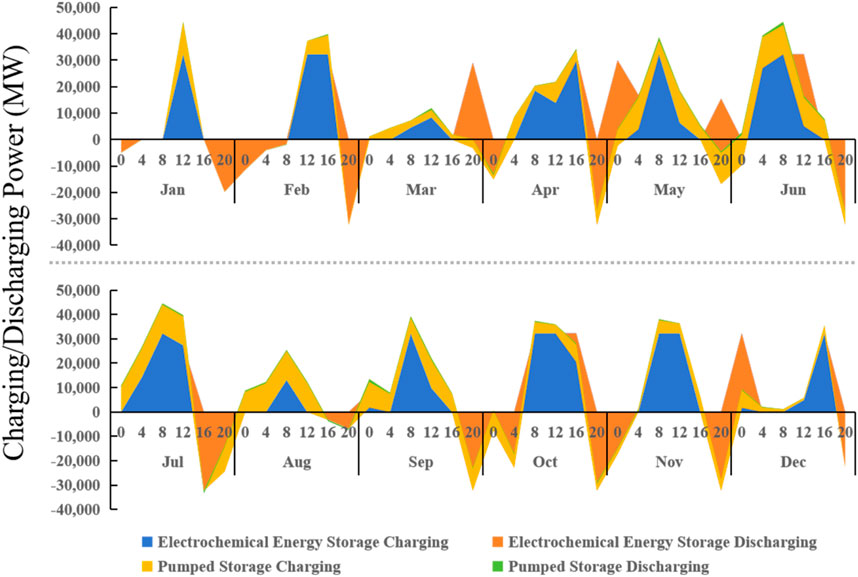
Figure 10. Baseline scenario of Guangdong energy storage charging and discharging power in 2060.
4.6 Carbon reduction costs and power sector costs
In the SWITCH-China model, carbon reduction costs reflect the additional expenses needed to meet the predetermined carbon emission trajectory, indicating the difficulty of achieving carbon peak and neutrality targets in the power sector.
Figure 11 illustrates the variation of carbon reduction costs relative to the baseline scenario in different scenarios. The fluctuation of wind and solar resources has a minimal impact on the fossil fuel capacity in the five southern provinces. The additional non-fossil units do not emit emissions, thus the overall carbon emissions change slightly and the reduction costs do not significantly differ from the baseline scenario. However, in the scenario of transmission line faults, there will be an increase in the construction and output of fossil fuel units in the five southern provinces, resulting in more carbon emissions and higher carbon reduction costs. Over time, as the capabilities of supply-side and grid-side in the five southern provinces improve, the carbon reduction costs will decrease.
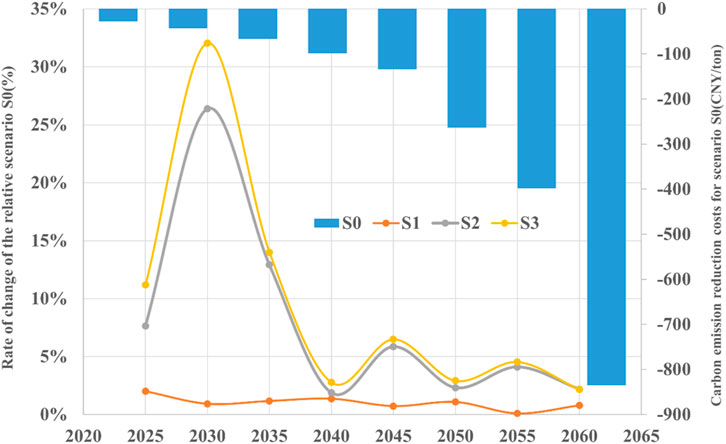
Figure 11. Changes in carbon emission reduction costs of various scenarios relative to the baseline scenario.
In this paper, under the normal operation of the national power system, the power reduction of wind and solar resources and transmission line failures in the southern region are studied, and the cost analysis mainly reflects the impact of regional changes on the country. Table 3 illustrates the total cost of the power sector. In scenario S2, where wind and solar power output decreases, an additional 0.7 trillion yuan is required for plant construction compared to the baseline scenario, and 0.4 trillion yuan more compared to the transmission failure scenario S1. In scenarios S2 and S3, coal power in the installation structure initially increases and then decreases, causing early-stage costs to rise and then fall as shown in the cost curves.
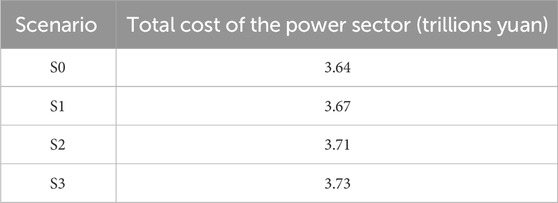
Table 3. Costs of power sector.
The cost per kilowatt-hour (kWh) reflects the power sector’s investment in producing electricity over a given period. Figure 12 shows the changes in the cost per kWh relative to the baseline scenario. In scenarios S2 and S3, the cost per kWh curves are opposite to the carbon reduction cost curves. This is mainly because, under reduced wind and solar power output, fewer wind and solar installations are built initially, leading to a reliance on coal power to meet demand. Coal power entails higher carbon reduction costs, but its generation cost is lower than other renewable sources, so the cost per kWh does not change significantly from the baseline. As coal power retires and renewable installations dominate, carbon reduction costs become similar to the baseline, but the higher number of renewable installations increases the cost per kWh.
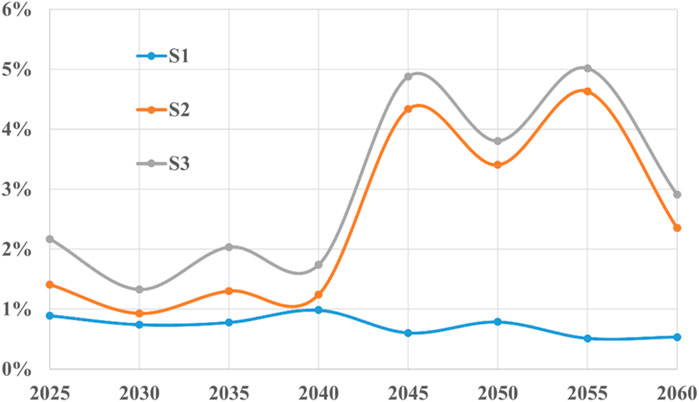
Figure 12. Changes in the cost per kWh of various scenarios relative to the baseline scenario.
5 Conclusion and policy recommendations
5.1 Conclusion
This study, within the context of China’s carbon peak and carbon neutrality goals, utilizes a high temporal and spatial resolution power optimization model to examine the effects of reduced wind and solar power output and transmission line failures on the southern five provinces. The primary conclusions are as follows.
5.1.1 Impact of reduced wind and solar power output
Provinces with a high proportion of wind and solar power in their energy mix, such as Guizhou, are significantly affected by extreme weather conditions that reduce wind and solar power generation. Before reaching the carbon peak, coal power will compensate for the reduced output. Afterward, nuclear and hydro power will dominate, with energy storage playing a crucial role in peak shaving and renewable energy integration.
5.1.2 Impact of transmission line failures
Transmission line failures primarily impact provinces that rely on imported electricity. For example, Guangdong will need to invest in more generating units when imported electricity decreases, leading to increased carbon reduction and electricity costs. Conversely, provinces like Yunnan, which export significant amounts of electricity, will see reduced self-generation when exports decrease.
5.1.3 Combined scenario impact
The combined scenario, composed of fluctuations in solar and wind output and transmission line failures, has a greater impact on provinces compared to individual factors alone. This impact is especially pronounced in provinces with larger installed capacities of solar and wind power and higher levels of imported electricity. In these provinces, nuclear power generation in the power mix increases, and there is also greater demand for energy storage and regulation.
5.2 Policy recommendations
For Provinces with High Wind and Solar Power Installation (Guangdong, Guizhou, and Yunnan):Gradually phase out and retain some coal and gas power plants to cope with extreme weather conditions. It is also necessary to choose generating units with more stable output that can operate under low wind speeds and low irradiation levels.
For Provinces with High Imported Electricity (Guangdong and Guangxi):In addition to fully utilizing self-generated power, plan and construct more and larger capacity transmission lines. Develop and implement main grid structures and grid investment optimization strategies suitable for the development of the power system (Chen et al., 2023).
Accelerating Energy Storage Deployment. All southern provinces should accelerate the deployment of energy storage systems, especially Guangdong, Guangxi, and Hainan, which primarily rely on nuclear and hydro power by carbon neutrality. Pumped hydro storage and electrochemical storage should be considered to meet user-side demand fluctuations, promptly integrate renewable energy, and improve the safety and stability of the power system.
Data availability statement
The raw data supporting the conclusions of this article will be made available by the authors, without undue reservation.
Author contributions
JZ: Data curation, Methodology, Software, Writing–original draft. LT: Conceptualization, Methodology, Software, Writing–original draft. ML: Software, Writing–review and editing. GH: Resources, Writing–review and editing. NS: Formal Analysis, Writing–review and editing. XL: Data curation, Writing–review and editing. SR: Formal Analysis, Resources, Writing–review and editing. PW: Conceptualization, Funding acquisition, Writing–review and editing.
Funding
The author(s) declare that financial support was received for the research, authorship, and/or publication of this article. The authors gratefully acknowledge the financial support from the Scientific and Technological Project of Yunnan Power Grid Corporation (YNKJXM20230013).
Conflict of interest
Authors JZ, GH, NS, and XL employed by the Energy Development Research Institute, China Southern Power Grid. Author ML was employed by Yunnan Power Grid Corp.
The remaining authors declare that the research was conducted in the absence of any commercial or financial relationships that could be construed as a potential conflict of interest.
The authors declare that this study was funded by the Scientific and Technological Project of Yunnan Power Grid Corporation. The funder had the following involvement in the study: providing model data, participating in writing, reviewing, and revising the article, etc.
Publisher’s note
All claims expressed in this article are solely those of the authors and do not necessarily represent those of their affiliated organizations, or those of the publisher, the editors and the reviewers. Any product that may be evaluated in this article, or claim that may be made by its manufacturer, is not guaranteed or endorsed by the publisher.
References
Chen, H., Chen, J., Han, G., and Cui, Q. (2022). Winding down the wind power curtailment in China: what made the difference? Renew. Sustain. Energy Rev. 167, 112725. doi:10.1016/j.rser.2022.112725
Chen, R., Xu, P., and Yao, H. (2023). Decarbonization of China’s regional power grid by 2050 in the government development planning scenario. Environ. Impact Assess. Rev. 101, 107129. doi:10.1016/j.eiar.2023.107129
Daisy, M., Dashti, R., Shaker, H. R., Javadi, S., and Hosseini Aliabadi, M. (2023). Fault location in power grids using substation voltage magnitude differences: a comprehensive technique for transmission lines, distribution networks, and AC/DC microgrids. Measurement 220, 113403. doi:10.1016/j.measurement.2023.113403
Deguenon, L., Yamegueu, D., Moussa kadri, S., and Gomna, A. (2023). Overcoming the challenges of integrating variable renewable energy to the grid: a comprehensive review of electrochemical battery storage systems. J. Power Sources 580, 233343. doi:10.1016/j.jpowsour.2023.233343
Emrani, A., and Berrada, A. (2024). A comprehensive review on techno-economic assessment of hybrid energy storage systems integrated with renewable energy. J. Energy Storage 84, 111010. doi:10.1016/j.est.2024.111010
He, G., Avrin, A.-P., Nelson, J. H., Johnston, J., Mileva, A., Tian, J., et al. (2016). SWITCH-China: a systems approach to decarbonizing China’s power system. Environ. Sci. Technol. 50, 5467–5473. doi:10.1021/acs.est.6b01345
He, G., Lin, J., Sifuentes, F., Liu, X., Abhyankar, N., and Phadke, A. (2020). Rapid cost decrease of renewables and storage accelerates the decarbonization of China’s power system. Nat. Commun. 11, 2486. doi:10.1038/s41467-020-16184-x
Huang, R., Huang, G., Cheng, G., and Dong, C. (2017). Regional heuristic interval recourse power system analysis for electricity and environmental systems planning in Eastern China. Resour. Conservation Recycl. 122, 185–201. doi:10.1016/j.resconrec.2017.01.009
Huang, Z., Sun, N., Shao, H., and Li, Y. (2024). Ultra-short-term prediction of microgrid source load power considering weather characteristics and multivariate correlation. Front. Energy Res. 12, 1409957. doi:10.3389/fenrg.2024.1409957
Jin, H., Guo, J., Tang, L., and Du, P. (2024). Long-term electricity demand forecasting under low-carbon energy transition: based on the bidirectional feedback between power demand and generation mix. Energy 286, 129435. doi:10.1016/j.energy.2023.129435
Lee, D., Chiang, Y., Chen, Y.-T., and Tsai, H.-H. (2024). Impacts of battery energy storage system on power grid smartness: case study of Taiwan Power Company. J. Energy Storage 86, 111188. doi:10.1016/j.est.2024.111188
Li, B., Mo, Y., Gao, F., and Bai, X. (2023). Short-term probabilistic load forecasting method based on uncertainty estimation and deep learning model considering meteorological factors. Electr. Power Syst. Res. 225, 109804. doi:10.1016/j.epsr.2023.109804
Li, R., Tang, B.-J., Yu, B., Liao, H., Zhang, C., and Wei, Y.-M. (2022). Cost-optimal operation strategy for integrating large scale of renewable energy in China’s power system: from a multi-regional perspective. Appl. Energy 325, 119780. doi:10.1016/j.apenergy.2022.119780
Li, X., Pan, L., and Zhang, J. (2023). Development status evaluation and path analysis of regional clean energy power generation in China. Energy Strategy Rev. 49, 101139. doi:10.1016/j.esr.2023.101139
Liu, L., Wang, Z., Wang, Y., Wang, J., Chang, R., He, G., et al. (2020). Optimizing wind/solar combinations at finer scales to mitigate renewable energy variability in China. Renew. Sustain. Energy Rev. 132, 110151. doi:10.1016/j.rser.2020.110151
Luderer, G., Pehl, M., Arvesen, A., Gibon, T., Bodirsky, B. L., de Boer, H. S., et al. (2019). Environmental co-benefits and adverse side-effects of alternative power sector decarbonization strategies. Nat. Commun. 10, 5229. doi:10.1038/s41467-019-13067-8
Mahmood, S., Misra, P., Sun, H., Luqman, A., and Papa, A. (2024). Sustainable infrastructure, energy projects, and economic growth: mediating role of sustainable supply chain management. Ann. Operations Res. doi:10.1007/s10479-023-05777-6
Maio, M., Marrasso, E., Roselli, C., Sasso, M., Fontana, N., and Marini, G. (2024). An innovative approach for optimal selection of pumped hydro energy storage systems to foster sustainable energy integration. Renew. Energy 227, 120533. doi:10.1016/j.renene.2024.120533
Peng, S., Zhu, J., Wu, T., Yuan, C., Cang, J., Zhang, K., et al. (2024). Prediction of wind and PV power by fusing the multi-stage feature extraction and a PSO-BiLSTM model. Energy 298, 131345. doi:10.1016/j.energy.2024.131345
Sun, H., Awan, R. U., Nawaz, M. A., Mohsin, M., Rasheed, A. K., and Iqbal, N. (2021). Assessing the socio-economic viability of solar commercialization and electrification in south Asian countries. Environ. Dev. Sustain. 23, 9875–9897. doi:10.1007/s10668-020-01038-9
Sun, J., Wang, Y., He, Y., Cui, W., Chao, Q., Shan, B., et al. (2024). The energy security risk assessment of inefficient wind and solar resources under carbon neutrality in China. Appl. Energy 360, 122889. doi:10.1016/j.apenergy.2024.122889
Wang, H., Zhang, X., Sun, Y., and Li, Q. (2024). Frequency constrained energy storage system allocation in power system with high renewable penetration. J. Energy Storage 90, 111769. doi:10.1016/j.est.2024.111769
Wang, S., Wu, J., Xiang, M., Wang, S., Xie, X., Lv, L., et al. (2024). Multi-objective optimisation model of a low-cost path to peaking carbon dioxide emissions and carbon neutrality in China. Sci. Total Environ. 912, 169386. doi:10.1016/j.scitotenv.2023.169386
Yang, M., Shi, X., Zhou, Y., Xiang, J., and Zhang, R. (2022). Deepening regional power connectivity: beyond the industry-centric perspective. Energy Res. and Soc. Sci. 90, 102614. doi:10.1016/j.erss.2022.102614
Keywords: wind and solar power output, transmission failures, source-grid-storage-load, SWITCH-China, carbon constraints, renewable energy
Citation: Zeng J, Tang L, Liu M, Huang G, Shang N, Liu X, Ren S and Wang P (2024) Research on supply-demand balance in China’s five southern provinces amidst fluctuations in regional wind and solar power generation and transmission faults. Front. Energy Res. 12:1450765. doi: 10.3389/fenrg.2024.1450765
Received: 18 June 2024; Accepted: 14 August 2024;
Published: 26 August 2024.
Edited by:
Yirui Wang, Ningbo University, ChinaCopyright © 2024 Zeng, Tang, Liu, Huang, Shang, Liu, Ren and Wang. This is an open-access article distributed under the terms of the Creative Commons Attribution License (CC BY). The use, distribution or reproduction in other forums is permitted, provided the original author(s) and the copyright owner(s) are credited and that the original publication in this journal is cited, in accordance with accepted academic practice. No use, distribution or reproduction is permitted which does not comply with these terms.
*Correspondence: Lang Tang, dGFuZ2xhbmdAbWFpbC51c3RjLmVkdS5jbg==; Peng Wang, d2FuZ3BlbmdAbXMuZ2llYy5hYy5jbg==