- 1CNOOC Energy Development Co., Ltd., Clean Energy Branch, Tianjin, China
- 2School of New Energy, North China Electric Power University, Beijing, China
This paper investigates the relationship between unsteady flow and radiated noise in the near wake of a wind turbine tower due to the blade tower interaction (BTI) in Wind tunnel experiments. The two-dimensional hot-wire probe is used to collect the instantaneous velocity field in the BTI region, and the microphone sensor is used to collect sound field information. The effects of Reynolds stress and turbulent kinetic energy on BTI noise are further analyzed based on the instantaneous velocity field. The results show that the blade’s passing effect causes irregular velocity distribution and vortex migration and mixing in the near wake of the tower, resulting in the most significant difference in Reynolds shear stress at the 0.71R position of the blade during the blade’s transition from an azimuthal angle of 180°–210°(upward). Furthermore, a strong correlation is identified between the peak turbulent kinetic energy and the peak acoustic pressure value measured during the rotational cycle when the blade ran up to 210° azimuth angle. It is deduced that the aerodynamic noise at the rear of the tower is attributed to the increase in momentum exchange caused by fluid doping and bursting, which are driven by Reynolds shear stress. Momentum exchange induces an increase in turbulent kinetic energy, which results in fluid velocity pulsations, pressure pulsations, and, thus, noise. The reduction in fluid mixing and the reduction in pressure pulsation subsequently lead to a reduction in the noise generated by the tower. Therefore, a viable approach to reducing BTI noise involves minimizing momentum exchange.
1 Introduction
With the increasing installation of wind turbines, the problem of noise pollution caused by wind turbines has also become more serious (Michaud et al., 2016). Shepherd et al. (2011) studied the health-related quality of life (HRQOL) of individuals living near wind farms in the form of a questionnaire. They have indicated that the acoustic properties of wind turbine noise tend to disrupt the sleep of people exposed to the noise. The characteristics of wind turbine noise were defined by periodicity, amplitude modulation, and high low-frequency energy, which contributed to its status as a particularly bothersome auditory phenomenon (Lee et al., 2011). By employing road traffic noise as a reference point, Fredianelli et al. (2019) established a dose-response relationship for disparate sound sources at an equivalent level of annoyance. The WTN (Wind Turbine Noise) caused a higher level of annoyance than the traffic noise for the same level of noise. In addition to the problem of noise pollution from onshore wind turbines, offshore wind turbines disturb the underwater acoustic environment, particularly by creating low-frequency noise (Zhou and Guo, 2023) that can harm sound-sensitive marine organisms (Huang, 2022). The generation of low-frequency noise is attributed to the BTI(blade-tower interaction) (Yang et al., 2018). Wang et al. (2022) showed a strong correlation (0.95) between the underwater noise from offshore wind turbines and the vibration signals of the tower. To minimize the impact of wind turbine noise emissions on people living near wind farms and on marine life, noise abatement measures must be developed to reduce the level of wind turbine noise pollution. A prerequisite for the development of noise mitigation measures was the testing and analysis of wind turbine sound and flow field data (Paterson et al., 1975). Single-microphone measurements and acoustic array measurements are the two most common methods for testing wind turbine sound fields (Hansen et al., 2017). The former was typically used to determine if noise exceeds specified levels, while the latter could locate significant noise sources. However, acoustic array measurements usually require the cooperation of detection algorithms, so single-microphone measurements remain the industry standard (Raman et al., 2016). It is challenging to separate ambient noise from WTN in wind farm noise assessments, and wind turbine model noise measurements are often made in wind tunnels for better observation and understanding (Gallo et al., 2016). This is because wind tunnel testing can eliminate certain complications associated with atmospheric conditions, thereby improving the signal-to-noise ratio. The principal methodologies employed for the assessment of fluid flow are the hot-wire anemometer technique (Bruun and H, 1996) and the particle image velocity (PIV) technique (Raffel et al., 2018). To illustrate, Koca et al. (2018) employed a hot-wire anemometer to ascertain data regarding vortex shedding resulting from laminar flow separation bubbles (LSBs) on the surface of an airfoil and from flow separation at the trailing edge. Their findings revealed that a reduction in vortex shedding frequency and increased vortexes around a wind turbine blade were associated with elevated vibration and noise levels on wind turbine blades. Ya (2009) employed the PIV technique to ascertain information regarding the flow field within the axial fan and the air guide and demonstrated that the aerodynamic noise of the low-speed isentropic flow is predominantly attributable to the stretching and rupture of the vortex system within the flow field. Although both techniques, hot-wire anemometry and PIV, are capable of obtaining velocity field information, the hot-wire anemometer is more suitable for studying the flow details in turbulent motion, which is more helpful for exploring the causes of BTI noise due to its advantages of small size, high resolution, and the fact that it does not require laser equipment.
Earlier research has shown that the BTI is the main cause of low-frequency noise (Timmerman, 2013). In addition to generating noise, BTI can adversely affect the operational performance and safety of wind turbines (Leishman and Bi, 1989) and the structural integrity of the tower (Pedersen et al., 2012). BTI noise is generated by transient changes in surface pressure acting on the blades and towers. The generation of sound pressure is related to the rate of change in surface pressure (Zhao et al., 2019). Further studies have shown that tower shadow (Abraham et al., 2019) and blade passing effects (Lorber and Egolf, 1990) cause BTI noise. The shadow effect of the tower reduces the average wind speed in front of the tower compared to the incoming wind speed. As the blade passes through the tower, the blade’s angle of attack changes unsteadily. This unsteady change affects the axial induction factor, reducing the thrust of the blade and creating the stress reversal phenomenon (Thoft-Christensen et al., 2009; Munduate et al., 2004). Zhang et al. (2022) studied the shadow effect of the tower blade and divided the interaction area between the blade and the tower into significantly disturbed and undisturbed areas. Lei found that the initial position of the blade was vertically upward. The azimuthal region of the rotation of the wind turbine is between 144° and 216°, which was the influence interval of the shadow effect of the tower (Leishman, 2010). In studying the blade passage effect, Leishman and Bi (1989) found that the blade passage effect leads to large pressure fluctuations on the obstacle, so the blade passage effect leads to pressure fluctuations on the tower surface and generates BTI noise. Zajamšek et al. (2019) then confirmed this hypothesis using a numerical simulation, which showed that the wind turbine tower was the main source of sound in BTI noise, with the sound pressure level emitted by the tower being approximately twice as high as that of the blades in the BTI noise. This also indicates that the pressure pulsation on the tower surface caused by blade-tower interference will become an important source of low-frequency underwater noise. Therefore, to reduce the underwater noise emitted by the tower, it is essential to study the sound generation mechanism of the BTI noise.
In the analytical study of the blade-tower interaction and the sound generation mechanism, Con estimated the time scale of the blade-tower interaction using the potential flow theory (Doolan, 2011) and the Curle theory (Curle, 1955) and found that the strength of the blade-tower noise source can be calculated by the time derivative of the blade lift force, and obtained a first-order dimensionless quantization model to estimate the strength of the blade-tower noise source. Yauwenas et al. (2017) observed that as the blade gets closer to the tower, the air in front of the blade spreads outward in a radial pattern. The tower blocks Some of the air, causing the pressure on the front side of the tower to increase. At the same time, some of the air around the blade is forced to speed up as the blade moves towards the area directly beneath the tower, leading to a decrease in pressure on the windward side. Li et al. (2020) researched blades’ aerodynamic and aeroelastic properties in the context of the BTI effect. The study revealed that the angle of attack decreases significantly as the blades move directly under the tower. Zajamšek et al. (2019) identified the tower’s contribution as the primary source of BTI noise. As a result, Shkara et al. (2018) utilized numerical simulations to analyze the velocity and vortex fields near the tower. In the region impacted by the blades, the frequency of vortex shedding behind the tower varies. The separation points on each side of the tower are shifted, and the airflow acceleration is different. The stationing point is closer to the side with the highest acceleration. By analyzing the correlation between pressure fluctuations and acoustic pressure fluctuations, Oguma et al. (2013) discovered that the sides and rear of the tower had the highest correlation coefficients. This was because the recirculation vortex near the tail stream hit the rear wall of the tower, creating a distinct and thicker region of the dipole source.
The study above primarily concentrates on the dynamic response of the blade portion of the blade-tower interaction noise and the mechanism of sound generation. In contrast, the study of the tower portion solely concerns itself with the flow field in front of the tower and the aerodynamic loads. The noise produced by the tower is related to the noise from the circular cylinder. However, the tower’s shadow effect and the impact of the blades passing through make the airflow around the wind turbine and the near-wake trajectory near the tower more complex. The flow characteristics are more complicated, necessitating a hot wire anemometer to capture the instantaneous flow field in the near-wall region of the tower leeward within the range of the tower shadow effect. The flow characteristics help to identify the leading cause of the pressure pulsations on the leeward side of the tower due to the BTI effect. In this study, the first rule of variation of the velocity field behind the tower is analyzed with the operation of the wind turbine blades at different azimuthal angles. Secondly, the Reynolds stress and turbulent kinetic energy on the tower surface are calculated when the wind turbine rotates at different azimuthal angles under rated operating conditions. Finally, a theoretical and experimental analysis was conducted to reveal the mechanism of sound generation for tower leeward near-wall noise. A practical method to reduce tower noise was also proposed.
2 Experimental equipment and methods
2.1 Experimental equipment
The experiments took place in the B1/K2 wind tunnel. We used an S-wing fixed pitch 3-bladed horizontal axis wind turbine with the following specifications: Wind turbine half warp R is 0.7 m, Generator rated poweris is 450 W, Rated wind speed is 10 m/s, Rated tip speed ratio
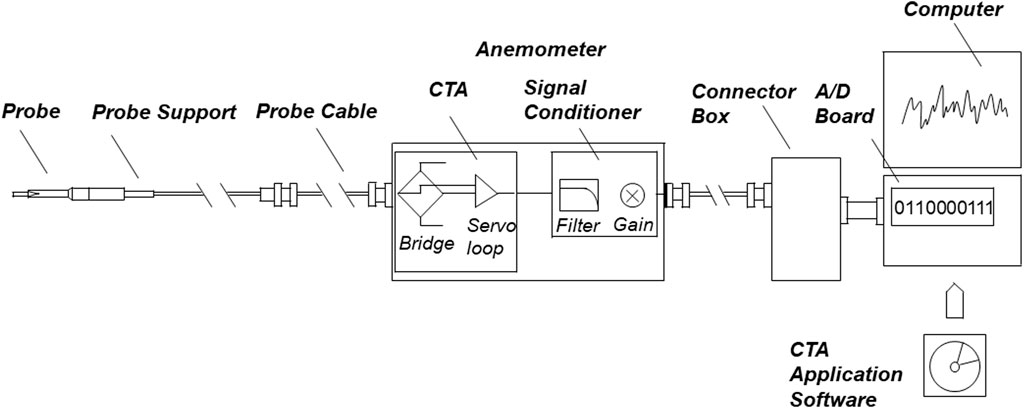
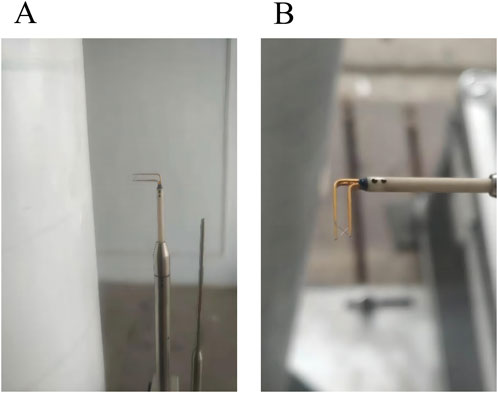
The dynamic parameters in the flow field are recorded using a thermostatic hot-wire anemometer with a maximum sampling frequency of 250 kHz. Its working principle is shown in Figure 1, which generally consists of a probe, a probe support frame, a connecting cable line, a chassis, and an A/D converter device and a computer. In the measurement process, the probe is placed in the area of the flow field to be measured, and the output voltage of the bridge circuit and operational amplifier is utilized to represent the flow velocity of the fluid, and the output voltage is input to the control computer through A/D conversion, and the output voltage is converted to the actual velocity of the fluid according to the relationship between the voltage-velocity calibrated by the probe.The hot wire probe is a type 55R63 2D X fiber sensor probe (Figure 2A). It is made of quartz, covering its surface with a nickel film layer. The diameter of the hot wire is 4.2
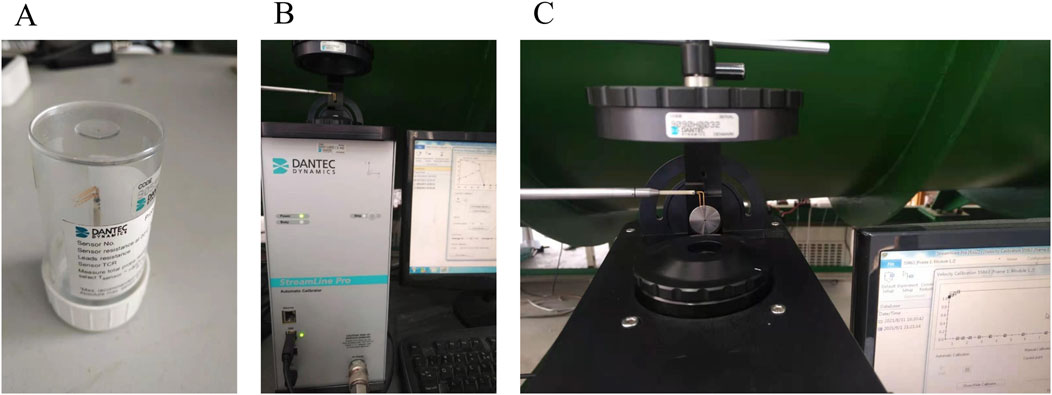
Figure 2. Hot wire calibration system: (A) 2D hot wire probe, (B) calibrator and (C) calibrator holder.
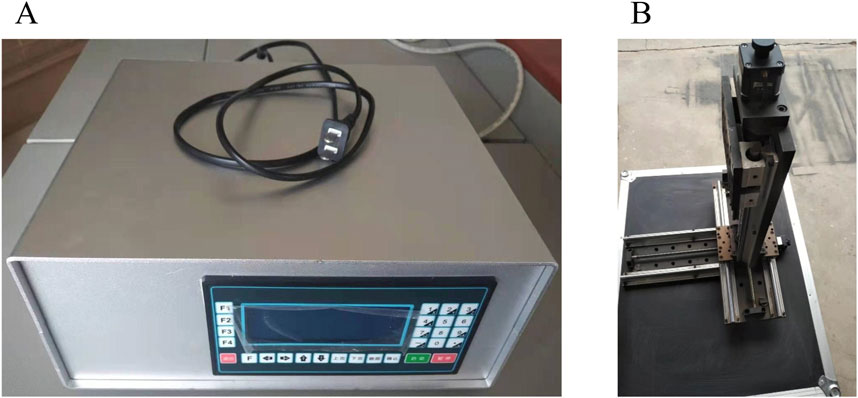
The three-dimensional coordinate frame (Figure 3A)allows for three-dimensional translation along the X, Y, and Z-axes. This is achieved through a ball screw drive, precision linear slide guide, and stepping motor drive. The travel of all axes is 410 mm, with a resolution of 0.001 mm. The hot-wire probes are fixed in a three-dimensional coordinate frame when experimenting. The controller of the coordinate frame (Figure 3B) can quickly position the probe spatially. Acquiring sound pressure signals involves using a 1/4 inch 4,958 microphone with a sensitivity of 12.5 mV/pa. It has a dynamic response range of 28–140 dB, measurable frequency range of 10–20 kHz, and can operate within the temperature range of -10°C–55°C, meeting the required performance for the experiment.
2.2 Experimental methods
2.2.1 Hot wire calibration
Calibration of a hot-wire probe involves determining the relationship between air velocity and the output voltage (E) of a hot-wire anemometer in a specific environment. The particular method is as follows: Set a known airflow velocity
where
The 2D X-probe is calibrated not only for velocity but also for orientation. By combining the calibrated velocities
Then the velocity U (Equation 9) and V (Equation 10) are calculated in the XY coordinate system:
Orientation calibration requires the probe to be able to rotate in the X plan (Figure 5A), and the probe is fixed on the rotating bracket; the specific installation is shown in Figure 5B. In the direction calibration of −40°-40°, 9 points are selected for direction calibration, and the direction calibration curve is shown in Figure 4B.
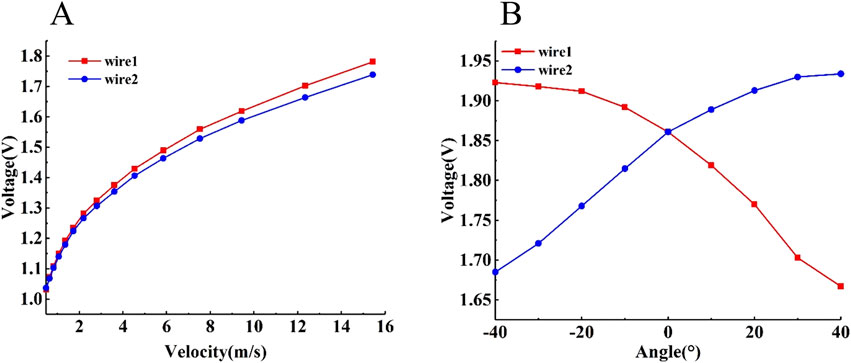
Figure 4. 55R63 hot wire probe calibration curve: (A) Speed calibration and (B) Direction calibration.

Figure 5. X-probe orientation calibration method: (A) X-probe co-ordinate system and (B) 2D probe installation method.
2.2.2 Measurement point design
The wind turbine’s rotating plane is positioned at 0.5D (where D is the diameter of the turbine) downstream of the open-jet tunnel. The rotating wind turbine’s center aligns with the wind tunnel’s center. Define the center of the rotation plane of the wind turbine as the origin O, as shown in Figure 6A. The acoustic test arrangement is shown in Figure 6B. The flow field region for this experiment is determined to be a plane parallel to the rotating surface of the wind turbine at a distance of 20 mm (x/2d = 0.75) (Yang et al., 2019) from the rear of the tower to ensure the safety of the experiment (Figure 7A). The test area is a 300 mm

Figure 6. Schematic diagram of wind tunnel test: (A) Flow field signal acquisition, (B) Acoustic pressure signal acquisition and (C) Trigger and RPM Measurement.
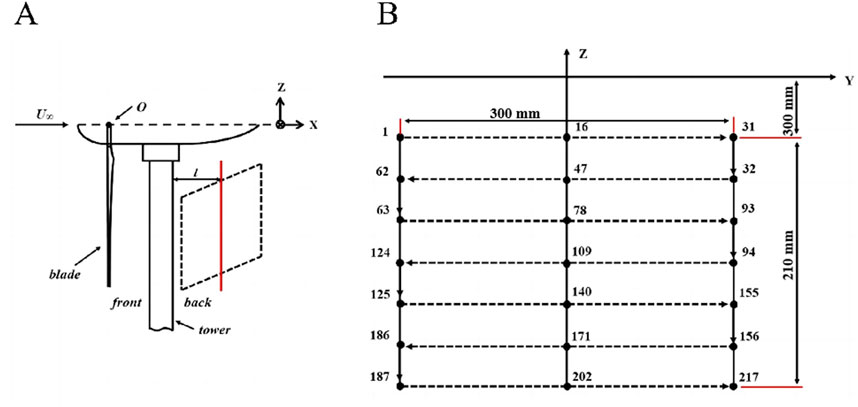
Figure 7. Schematic diagram of measurement point arrangement: (A) Schematic of the test plan and (B) Scheme for the placement of measurement points.
2.2.3 Analysis of experimental errors
The experiment’s error is the flow field test error, which encompasses wind tunnel calibration errors, hot wire velocity calibration curve fitting errors, hot wire direction calibration errors, and temperature deviation correction errors. The velocity calibration curve fitting error, using a fourth-order polynomial, is very small and almost negligible. Due to the calibration error of the hot wire and the temperature deviation, the system error is about 1
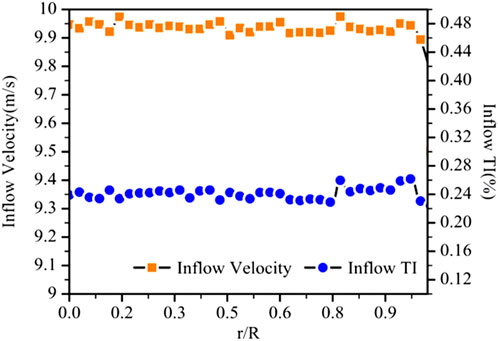
Figure 9. Distribution of mean wind speed and turbulence along the horizontal radius at the exit of the wind tunnel.
3 Results and analyses
3.1 Velocity field analysis
Based on the velocity distribution shown in Figure 10, it is clear that there is a velocity band structure with opposing directions in the flow field behind the tower. This structure represents a two-dimensional profile of the three-dimensional flow in the disturbed region around the tower. Noticeably, the velocity field in the area behind the tower is not evenly distributed on both sides of Y/d = 0. Still, instead, it moves in a negative direction towards Y. This phenomenon is likely associated with the blade-passing effect. The blade-passing effect impacts the direction of the inflow velocity to the tower. In wind turbine research, the direction of the induced velocity in the turbine wake is opposite to the direction of rotation of the blades. This is because Newton’s third law describes the relationship between forces and reaction forces (Fischer et al., 2017). The induced effect influences the direction of migration of the wake vortex, with the migration speed being positively correlated to the rotational speed of the wind turbine (Danmei and Jingqun, 2018). The velocity band on the left side of the tower moves towards Z+, while the velocity band on the right side moves towards Z-. The induced effect alters the direction of the velocity wake development behind the tower. This wake is an area of relatively low velocity in the flow direction. The lobe-tower interference effect causes this low-velocity zone to deflect in the Y-direction, resulting in the relatively high-velocity zone on the Y+ side of the tower’s wake moving towards the center of the tower. This aligns with the findings of the study (Regodeseves and Morros, 2021). The area between the high- and low-velocity bands experiences momentum exchange as a result of the difference in momentum. This causes a shift of the pressure pulsation area towards the Y+ direction. The change in the location of the pressure pulsation also indicates a change in the location and directivity of the aerodynamic sound source on the surface of the tower.
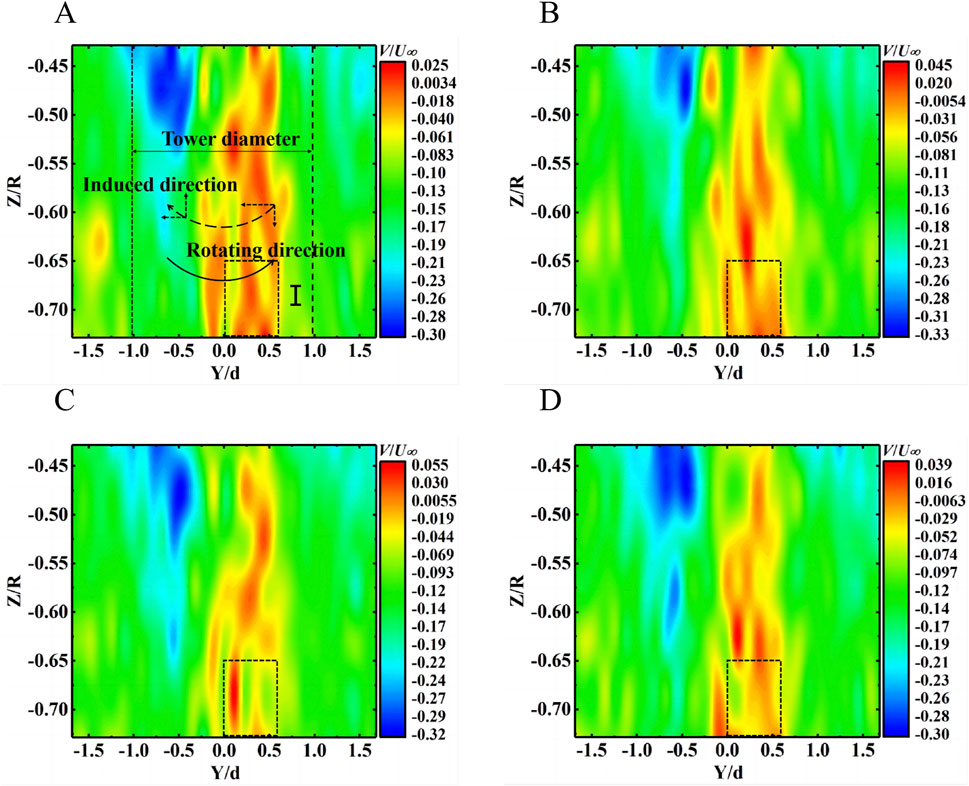
Figure 10. Instantaneous velocity field in the Y-direction of the test plane: (A)
3.2 Reynolds stress analysis
The interaction between the blade and the tower causes periodic disturbances in the fluid, accelerating the incoming velocity on both sides of the tower. This generates a fluid vortex near the tower, injecting energy periodically and maintaining the vortex system, allowing it to generate, migrate, develop, and mix (Fischer et al., 2017). Reynolds stress
For the flow field in the YZ plane near the wall behind the tower, the Reynolds stresses, since only the
Where
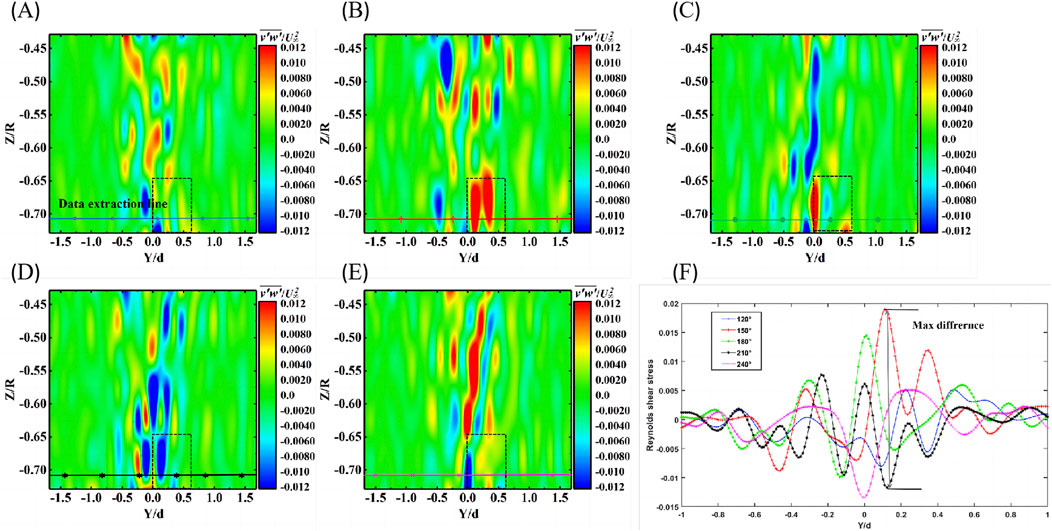
Figure 11. The contour of Reynolds stress variation with azimuth angle: (A)
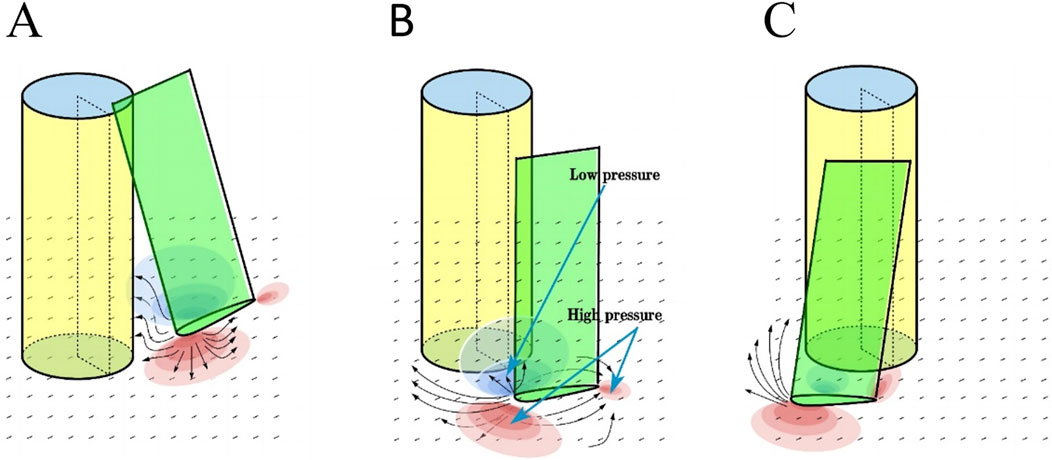
Figure 12. Velocity induction of leaf-tower interaction process and pressure zone variation schematic (Yauwenas et al., 2017; Zajamšek et al., 2019): (A) blade downward, (B) blade is directly underneath and (C) blade upward.
3.3 Turbulent energy analysis
The root mean square of fluid velocity pulsation can be used to describe the statistical characteristics of fluid velocity over time (Zhang et al., 2021). Its value indicates the strength of turbulence, which is an important parameter for assessing flow stability. It also depicts the level of energy exchange between vortex systems, as expressed in Equation 13.
In the above equation, n is the number of instantaneous velocities;
Where, TKE is the turbulent kinetic energy;
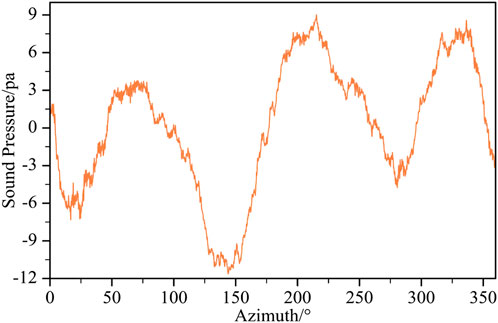
Zhang et al. (2021) and Adrian (2007) stated that the turbulent burst phenomenon is a significant source of turbulent energy generation. Figure 13A–E is the contour of turbulent kinetic energy variation with azimuthal angle. The turbulent kinetic energy at the near-wall surface of the rear of the tower goes through a dynamic process of increasing, decreasing, and then increasing again, as shown in Figure 13F. At the moment when the blade is directly below the tower, the average turbulent kinetic energy is the lowest. This is because the fluid discharged from the leading edge of the blade is blocked by the tower (Figure 12B), reducing the incoming energy from the tower near the wall surface due to the Reynolds. The reduced shear stress leads to insufficient driving force for momentum exchange between the fluids, resulting in lower turbulent kinetic energy. Figure 13F, it is observed that the turbulent kinetic energy reaches its maximum value as the blade runs from 180° to 210° azimuthal angle. This suggests that there is a higher likelihood of turbulent bursts occurring during the blade’s upward motion. Furthermore, the sound pressure, measured with the phase angle behind the tower (Figure 14), peaks near the phase angle of 210°, indicating that the blade has a significant impact on the flow field pulsation behind the tower during the upward motion.
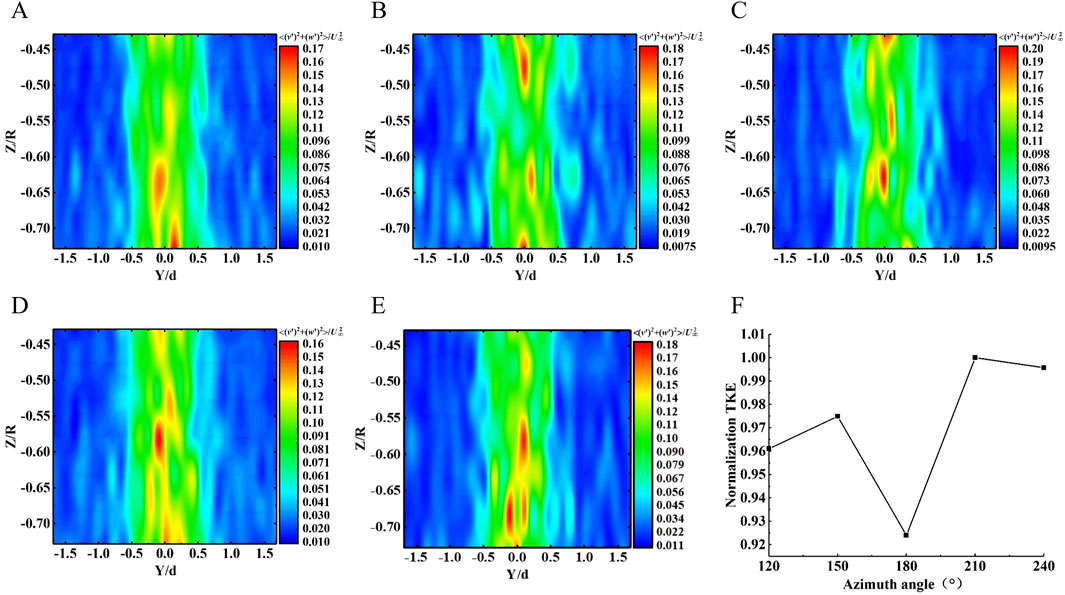
Figure 13. The contour of turbulent kinetic energy variation with azimuthal angle: (A)
4 Conclusion
This paper investigates the causes of aerodynamic noise generation behind the tower during leaf-tower interaction, employing hot-wire anemometer velocimetry. The following conclusions are drawn from the findings.
1. The trailing velocity field at the cross-section near the wall of the tower under the effect of blade-tower interaction shows a non-uniform velocity strip structure. Due to the induced effect of the blade wake, the tower experiences a wake in the Y-direction. Near the downward side of the blade, the velocity is higher and moves toward Z+, while on the upward side of the blade, the velocity is lower and moves towards Z-. The blade’s cross-sectional velocity field experiences an increasing deflection In the region of significant influence of the BTI. Gleichzeitig, the wake deflection causes the high-speed area, previously located on the outside of the tower, to shift towards the center of the tower. This affects the location and directivity of the noise generated by pressure fluctuation on the tower’s surface.
2. The mean turbulent kinetic energy of the blade, as it continues upward past the tower, is correlated with the radiated sound pressure in the interval of the significant influence of the BTI effect. As a result, it has been determined that the production of aerodynamic noise behind the tower is caused by the interfluid mixing and bursting driven by Reynolds shear stress. This leads to increased momentum exchange, which in turn increases the turbulence energy and fluid velocity pulsation, and ultimately produces acoustic waves through pressure pulsation.
3. To reduce noise generated by fluid momentum exchange, spoiler bars can be arranged on one side of the tower at the tower (d). This arrangement helps to advance flow separation, increasing the distance of the separation vortex from the back of the tower and reducing the contact area between shedding vortices. By decreasing the probability of kinetic energy exchange, noise can be reduced. Additionally, advancing the separation point allows the flow to move away from the tower wall, creating a smoother and less turbulent flow. Another method to reduce momentum difference within the wake is to increase the roughness of the tower surface near the blade’s upward side, which enhances flow resistance and weakens the incoming velocity of the high-speed zone.
Data availability statement
The original contributions presented in the study are included in the article/supplementary material, further inquiries can be directed to the corresponding author.
Author contributions
HY: Conceptualization, Data curation, Formal Analysis, Funding acquisition, Investigation, Methodology, Project administration, Resources, Software, Supervision, Validation, Visualization, Writing–review and editing. ZL: Writing–review and editing, Methodology, Writing–original draft. QG: Methodology, Writing–review and editing, Supervision, Validation. LQ: Methodology, Supervision, Validation, Writing–review and editing, Formal Analysis. NL: Writing–review and editing, Investigation. KZ: Resources, Writing–original draft. PW: Writing–original draft, Data curation. KS: Writing–original draft.
Funding
The author(s) declare that financial support was received for the research, authorship, and/or publication of this article. This research was supported by the China Offshore Oil Group Co., Ltd.’ 14th Five-Year’ major scientific and technological projects’ new energy development and CCUS key technology research (grant number: KJZX-2022-12-XNY-0402, ZX2022ZCJNF8360).
Conflict of interest
Authors HY, ZL, QG, LQ, NL, and KZ were employed by CNOOC Energy Development Co., Ltd.
The remaining authors declare that the research was conducted in the absence of any commercial or financial relationships that could be construed as a potential conflict of interest.
The authors declare that this study received funding from China Offshore Oil Group Co., Ltd. The funder had the following involvement in the study: study design and the decision to submit it for publication.
Publisher’s note
All claims expressed in this article are solely those of the authors and do not necessarily represent those of their affiliated organizations, or those of the publisher, the editors and the reviewers. Any product that may be evaluated in this article, or claim that may be made by its manufacturer, is not guaranteed or endorsed by the publisher.
References
Abraham, A., Dasari, T., and Hong, J. (2019). Effect of turbine nacelle and tower on the near wake of a utility-scale wind turbine. J. Wind Eng. Industrial Aerodynamics 193, 103981. doi:10.1016/j.jweia.2019.103981
Adrian, R. J. (2007). Hairpin vortex organization in wall turbulence. Phys. Fluids 19, 041301. doi:10.1063/1.2717527
Bruun, H. H. (1996). Hot-wire anemometry: principles and signal analysis. Meas. Sci. Technol. 7. doi:10.1088/0957-0233/7/10/024
Curle, N. (1955). The influence of solid boundaries upon aerodynamic sound. Proc. R. Soc. Lond. Ser. A. Math. Phys. Sci. 231, 505–514. doi:10.1098/rspa.1955.0191
Danmei, H., and Jingqun, Q. (2018). Piv experimental study on the near wake flow of horizontal-axis wind turbine tower. Renew. Energy Resour. doi:10.13941/j.cnki.21-1469/tk.2018.07.020
De Mitri, A. G., de, L., Amaral, R., de Moura, H. L., Ayala, J. S., Nunhez, J. R., et al. (2023). Tilted piv: a novel approach for estimating the turbulent kinetic energy in stirred tanks. Measurement 217, 113112. doi:10.1016/j.measurement.2023.113112
Doolan, C. (2011) “Wind turbine noise mechanisms and some concepts for its control,” in Australian acoustical SocietyConference 2011, acoustics 2011: breaking new ground, 494–500.
Effendy, M., Yao, Y., Yao, J., and Marchant, D. (2019). Detached eddy simulation of blade trailing-edge cutback cooling performance at various ejection slot angles. Int. J. Heat Fluid Flow 80, 108487. doi:10.1016/j.ijheatfluidflow.2019.108487
Fischer, J. R., Yauwenas, Y., Doolan, C. J., Timchenko, V., and Reizes, J. (2017). Unsteady flow physics of the blade-tower interaction of a pylon-mounted fan
Fredianelli, L., Carpita, S., and Licitra, G. (2019). A procedure for deriving wind turbine noise limits by taking into account annoyance. Sci. total Environ. 648, 728–736. doi:10.1016/j.scitotenv.2018.08.107
Gallo, P., Fredianelli, L., Palazzuoli, D., Licitra, G., and Fidecaro, F. (2016). A procedure for the assessment of wind turbine noise. Appl. Acoust. 114, 213–217. doi:10.1016/j.apacoust.2016.07.025
Hansen, C. H., Doolan, C. J., and Hansen, K. L. (2017). Wind farm noise: measurement, assessment. John Wiley and Sons, Ltd.
Huang, S. (2022). Unstated impacts of the green energy industry on the habitat of a coastal delphinid: turbid-turbulent wakes induced by offshore wind turbine foundations. Aquatic Conservation Mar. Freshw. Ecosyst. 32, 1787–1796. doi:10.1002/aqc.3888
Hutchins, N., Nickels, T. B., Marusic, I., and Chong, M. S. (2009). Hot-wire spatial resolution issues in wall-bounded turbulence. J. Fluid Mech. 635, 103–136. doi:10.1017/s0022112009007721
Koca, K., Genç, M. S., Açıkel, H. H., Çağdaş, M., and Bodur, T. M. (2018). Identification of flow phenomena over naca 4412 wind turbine airfoil at low Reynolds numbers and role of laminar separation bubble on flow evolution. Energy 144, 750–764. doi:10.1016/j.energy.2017.12.045
Lee, S., Kim, K., and Choi, W. (2011). Annoyance caused by amplitude modulation of wind turbine noise. Noise Control Eng. J. 59, 38–46. doi:10.3397/1.3531797
Leishman, J. G. (2010). Challenges in modelling the unsteady aerodynamics of wind turbines. Wind Energy 5, 85–132. doi:10.1002/we.62
Leishman, J. G., and Bi, N. P. (1989). Aerodynamic interactions between a rotor and a fuselage in forward flight. J. Am. Helicopter Soc. 35, 22–31. doi:10.4050/jahs.35.22
Li, Z. W., Wen, B., Dong, X. J., ke Peng, Z., Qu, Y. G., and Zhang, W. M. (2020). Aerodynamic and aeroelastic characteristics of flexible wind turbine blades under periodic unsteady inflows. J. Wind Eng. Industrial Aerodynamics 197, 104057. doi:10.1016/j.jweia.2019.104057
Lorber, P. F., and Egolf, T. A. (1990). An unsteady helicopter rotor-fuselage aerodynamic interaction analysis. J. Am. Helicopter Soc. 35, 32–42. doi:10.4050/jahs.35.32
Michaud, D. S., Feder, K., Keith, S. E., Voicescu, S. A., Marro, L., Than, J., et al. (2016). Exposure to wind turbine noise: perceptual responses and reported health effects. J. Acoust. Soc. Am. 139, 1443–1454. doi:10.1121/1.4942391
Munduate, X., Coton, F. N., and Galbraith, R. A. M. (2004). An investigation of the aerodynamic response of a wind turbine blade to tower shadow. J. Sol. Energy Engineering-transactions Asme 126, 1034–1040. doi:10.1115/1.1765683
Oguma, Y., Yamagata, T., and Fujisawa, N. (2013). Measurement of sound source distribution around a circular cylinder in a uniform flow by combined particle image velocimetry and microphone technique. J. Wind Eng. Industrial Aerodynamics 118, 1–11. doi:10.1016/j.jweia.2013.04.003
Paterson, R. W., Amiet, R. K., and Munch, C. L. (1975). Isolated airfoil-tip vortex interaction noise. J. Aircr. 12, 34–40. doi:10.2514/3.59798
Pedersen, R. R., Nielsen, S. R. K., and Thoft-Christensen, P. (2012). Stochastic analysis of the influence of tower shadow on fatigue life of wind turbine blade. Struct. Saf. 35, 63–71. doi:10.1016/j.strusafe.2011.12.005
Raffel, M., Willert, C., Scarano, F., Khler, C. J., and Kompenhans, J. (2018). Particle image velocimetry A practical guide (particle image velocimetry A practical guide)
Raman, G., Ramachandran, R. C., and Aldeman, M. R. (2016). A review of wind turbine noise measurements and regulations. Wind Eng. 40, 319–342. doi:10.1177/0309524x16649080
Regodeseves, P. G., and Morros, C. S. (2021). Numerical study on the aerodynamics of an experimental wind turbine: influence of nacelle and tower on the blades and near-wake. Energy Convers. Manag. 237, 114110. doi:10.1016/j.enconman.2021.114110
Shepherd, D., Mcbride, D., Welch, D., Dirks, K. N., and Hill, E. M. (2011). Evaluating the impact of wind turbine noise on health-related quality of life. Noise Health 13 (54), 333. doi:10.4103/1463-1741.85502
Shkara, Y., Schelenz, R., and Jacobs, G. (2018). The effect of blade-tower interaction on the structure loading of multi megawatt horizontal axis wind turbine. J. Phys. Conf. Ser. 1037, 072033. doi:10.1088/1742-6596/1037/7/072033
Simoni, D., Ubaldi, M., and Zunino, P. (2012). Loss production mechanisms in a laminar separation bubble. Flow, Turbul. Combust. 89, 547–562. doi:10.1007/s10494-012-9407-y
Thoft-Christensen, P., Pedersen, R., and Nielsen, S. (2009). Numerical estimation of fatigue life of wind turbines due to shadow effect. Osaka, Japan: CRC Press, 71.
Wang, R. X., Xu, X. M., Zou, Z. G., Huang, L. F., and Tao, Y. (2022). Dominant frequency extraction for operational underwater sound of offshore wind turbines using adaptive stochastic resonance. J. Mar. Sci. Eng. 10, 1517. doi:10.3390/jmse10101517
Ya, W. (2009). Research of aerodynamic noise source of low speed axial fans based on vortex-sound theory. J. Eng. Thermophys.
Yang, C. M., Liu, Z., Lü, L., Yang, G., Huang, L., and Jiang, Y. (2018). Measurement and characterization of underwater noise from operational offshore wind turbines in shanghai donghai bridge. 2018 OCEANS - MTS/IEEE Kobe Techno-Oceans (OTO), 1–5. doi:10.1109/OCEANSKOBE.2018.8559449
Yang, Z. G., Liu, Y., and Wang, Y. G. (2019). Study of aeroacoustic noise source induced by a cylindrical flow of finite length. Technical Acoustics
Yauwenas, Y., Zajamšek, B., Reizes, J. A., Timchenko, V., and Doolan, C. J. (2017). Numerical simulation of blade-passage noise. J. Acoust. Soc. Am. 142 (3), 1575–1586. doi:10.1121/1.5003651
Yauwenas, Y., Zajamšek, B., Reizes, J. A., Timchenko, V., and Doolan, C. J. (2021). Directivity of blade-tower interaction noise. JASA express Lett. 1 (6), 063601. doi:10.1121/10.0005267
Zajamšek, B., Yauwenas, Y., Doolan, C. J., Hansen, K. L., Timchenko, V., Reizes, J. A., et al. (2019). Experimental and numerical investigation of blade–tower interaction noise. J. Sound Vib. 443, 362–375. doi:10.1016/j.jsv.2018.11.048
Zhang, C. Q., Gao, Z. Y., Chen, Y. Y., Dai, Y. J., Wang, J. W., and Zhang, P. (2021). Experimental determination of the dominant noise mechanism of rotating rotors using hot-wire anemometer. Appl. Acoust. 173, 107703. doi:10.1016/j.apacoust.2020.107703
Zhang, X. X., Gao, Z. Y., Su, R. N., Zhang, C. Q., and Wang, J. W. (2022). Research on optimization of wind turbine noise reduction performance based on winding helical wires to tower. Acta Energiae Solaris Sin. 43 (8). doi:10.19912/j.0254-0096.tynxb.2021-1449
Zhao, D., Han, N., Goh, E., Cater, J. E., and Reinecke, A. (2019). “Aeroacoustics of wind turbines,” in Wind turbines and aerodynamics energy harvesters.
Zhao, Z. H., Jia, Y. Y., Liu, Q. K., Lyu, M. H., and Liu, N. (2023). Experimental study on aerodynamic performance of airfoil under comprehensive influence of Reynolds number and turbulence degree. Beijing, China: Gongcheng Lixue/Engineering Mechanics 40, 313–318.
Keywords: wind turbine, hot-wire anemometry, blade-tower interaction noise, reynolds stresses, turbulent kinetic energy
Citation: Yu H, Li Z, Guo Q, Qi L, Li N, Zhu K, Wang P and Sun K (2024) Experimental study of tower noise on the basis of blade-tower interaction. Front. Energy Res. 12:1449817. doi: 10.3389/fenrg.2024.1449817
Received: 16 June 2024; Accepted: 02 September 2024;
Published: 20 September 2024.
Edited by:
Yuquan Zhang, Hohai University, ChinaReviewed by:
Yang Yang, Ningbo University, ChinaZhi Ying Gao, Inner Mongolia University of Technology, China
Luca Fredianelli, Pisa Research Area, National Research Council (CNR), Italy
Copyright © 2024 Yu, Li, Guo, Qi, Li, Zhu, Wang and Sun. This is an open-access article distributed under the terms of the Creative Commons Attribution License (CC BY). The use, distribution or reproduction in other forums is permitted, provided the original author(s) and the copyright owner(s) are credited and that the original publication in this journal is cited, in accordance with accepted academic practice. No use, distribution or reproduction is permitted which does not comply with these terms.
*Correspondence: Ke Sun, aGJkbHN1bmtlQDE2My5jb20=
 Hailong Yu1
 Ke Sun