 Renwei Ji1,2
 Ming Kong1
 Ke Sun3*
 Jianhua Zhang4*Renqing Zhu1Minwei Yin1
 Yuquan Zhang2E. Fernandez-Rodriguez5
- 1School of Naval Architecture and Ocean Engineering, Jiangsu University of Science and Technology, Zhenjiang, China
- 2College of Harbor, Coastal and Offshore Engineering, Hohai University, Nanjing, China
- 3College of Shipbuilding Engineering, Harbin Engineering University, Harbin, China
- 4College of Aerospace and Civil Engineering, Harbin Engineering University, Harbin, China
- 5Technological Institute of Merida, Technological Avenue, Merida, Mexico
This paper establishes a high-fidelity and efficient Computational Fluid Dynamics (CFD) numerical method (AL-LDS-Ωnew) for wind turbine wake by combining the actuator line (AL), the localized dynamic Smagorinsky (LDS) sub-grid scale (SGS), and the new generation Ωnew vortex identification method under the framework of large eddy simulation. The model advantages are encouraging: 1) In terms of turbine modeling, the AL model is adopted to replace the traditional three-dimensional solid model, which avoids solving the boundary layer on the blade surface and improves computational efficiency; 2) In terms of wake simulation, the LDS SGS model is used to model turbulence, reducing vortex dissipation and further improving the refinement of turbine wake; 3) In terms of vortex identification, the new generation Ωnew vortex identification method avoids the difficult threshold selection in previous vortex identification and captures more refined vortex structures. The accuracy of the model is validated against published data of a NREL 5 MW wind turbine, and then extended to simulate the wake interference of tandem twin-rotor turbines by changing the pitch angle of the upstream wind turbine (WT1). The influence mechanisms between array wake interference and energy conversion efficiency under the pitch strategy are explored, demonstrating the AL-LDS-Ωnew coupling method is computationally accurate and efficient for simulating the complex wake interference. From analyses, the pitch strategy can effectively suppress the wake effect of the upstream turbine (WT1) and increase the power output of the downstream turbine (WT2), thus improving the overall output power of the array farm. Compared with the non-pitch condition (0 pitch angle), a pitch angle of (2°) maximizes the global energy conversion efficiency of the twin-rotor array: power augmentation by 0.29%, and thrust reduction by 5%. This optimal state reduces the fatigue load of the turbine and is more conducive to long-term operation. The findings, whilst preliminary, encourage the use of turbine pitch strategies in the wind farm planning and operation.
1 Introduction
Wind energy occupies an important proportion in developing renewable energy sector (Li et al., 2023; Boadu and Otoo, 2024; Zeng et al., 2024) owing to experience, economic efficiency, and eco-friendly impact. With the rapid growth of the wind power industry, the wind farm design is gradually evolving towards array and clustering (Yuan et al., 2017; Sun et al., 2021). In the array optimization layout, reducing rotor spacing can increase the power density per unit area of the wind farm (Ji et al., 2018; Yuan et al., 2021) and as well the commercial efficiency. However, the velocity deficit and high turbulence intensity in the wake of the front turbine WT1, changes the inflow conditions of the posterior turbine (WT2) thus decreasing its output power and augmenting the experienced fatigue loads (Zeng et al., 2023; Liu et al., 2024). This not only reduces the utilization rate of wind energy, but also wastes land resources. Therefore, exploring the turbine wake flow mechanism, especially applying an effective wake control strategy to the upstream turbine in the wind farm, will be of great significance for optimizing the layout of the wind farm and improving the overall power output of the wind farm (Mühle et al., 2024).
In terms of the single-rotor turbine, some scholars (Zhang, 2014; Hu et al., 2016; Zeng et al., 2021a; Zeng et al., 2021b) have studied the wake characteristics of the wind turbine under different inflow conditions by using the combination of the body-fitted mesh and RANS model. The body-fitted mesh method consumes multiple computational resources, so the results only account for the velocity deficit of the wake and not for the vortex visualization. In order to improve the wake refinement, other scholars (Shen et al., 2015; Qian et al., 2018) have explored the effect of yaw angle on the wake characteristics of the wind turbine based on DES or LES methods. The discussion on vortex visualization has been added to the results using the first-generation Vorticity vortex identification method. Consequently, it may identify the rough vortex surface shape but not the complete blade vortex system (tip vortex and root vortex). In order to improve computational efficiency and vortex capture accuracy, some scholars (Gao et al., 2021; Ji et al., 2022) have conducted numerical studies on the wind turbine based on the AL-LES coupling method. In the results, the second-generation Q vortex identification method has been used, clearly identifying the blade vortex system; the only major disadvantage is the uncertainty of the threshold selection. With the development of vortex identification methods, Huang et al. (2021) studied the wake characteristics of the floating wind turbine based on the AL-RANS coupling method. The latest third-generation Ωnew vortex identification method was introduced in the results, and a fixed threshold was used to clearly capture the development and fragmentation of the blade vortex system.
In terms of the multi-rotor turbines, Zhang (Zhang, 2018) explored the wake interference of tandem multi-rotor turbines based on the combination of the body-fitted mesh and DES model. The results only analyzed the wake velocity deficit, lacking discussion on the velocity contour and vortex structure. Meanwhile, it was also pointed out that the body-fitted mesh method is unsuitable for the numerical simulation of the large-scale wind farm. To increase computational efficiency, Hornung et al. (2015) conducted research on tandem multi-rotor turbines based on the coupling method of actuator disk (AD) and RANS. However, the AD model could not consider the rotor rotation effect, and thus, the blade vortex system. In other words, the relationship between wake vortex interference and wind farm output power was not analyzed from the mechanistic perspective. Considering that the AL method can balance computational accuracy and efficiency, some scholars (Fleming et al., 2015; Wang et al., 2019; Zhang et al., 2022) have studied the wake interference of tandem twin-rotor turbines based on the AL-LES coupling method, adopting the standard Smagorinsky sub-grid scale model (turbulence treatment). In these studies, different control strategies [yaw (Fleming et al., 2015), precone (Zhang et al., 2022), tilt (Wang et al., 2019), etc.] were applied to the WT1 in an attempt to reduce the WT1 wake effect, so as to improve the overall power output of the wind farm. The results indicated that (different) control strategies modify the wind farm output power to a certain extent. However, the analysis of the results mainly focused on wake velocity deficit, lacking an explanation of the influence mechanism between wake interference and energy conversion efficiency.
In summary, the shortcomings can be divided into three topics:
(1) Research methods: (a) Some scholars (Zhang, 2014; Hu et al., 2016; Qian et al., 2018; Zhang, 2018; Zeng et al., 2021a; Zeng et al., 2021b) have used the body-fitted mesh method to model the wind turbine, requiring substantial computational resources to solve the blade boundary layer. At present, this method is not suitable for the refined numerical simulation of the large-scale wind farm. From another perspective, (b) other scholars (Fleming et al., 2015; Wang et al., 2019; Gao et al., 2021; Huang et al., 2021; Ji et al., 2022; Zhang et al., 2022) have adopted the actuator models (AD or AL) to improve the computational efficiency, but the turbulence modeling was mainly based on RANS, DES and LES (standard Smagorinsky SGS model) methods, all of which had the problem of insufficient precision of wake simulation.
(2) Results discussion: The current research has mainly focused on the wake velocity distribution. The insufficient precision of wake simulation and the influence of grid viscosity that the turbine wake vortex dissipates rapidly when it propagates downstream, leads to a lack of analysis of vortex visualization, wake interference, and flow mechanism.
(3) Wake vortex identification: Many studies have mainly adopted the previous vortex identification methods (1st generation Vorticity, 2nd generation Q), both of which have limitations: (a) The first-generation Vorticity method can only identify the rough vortex surface shape and cannot capture the blade vortex system, resulting in inaccurate display (Ren et al., 2020); (b) The threshold selection of the second-generation Q method is difficult, and different cases or even different moments of the same case require human experience to adjust the threshold repeatedly. Furthermore, it cannot display strong and weak vortexes simultaneously (Zhao and Wan, 2021); (c) The third-generation Ωnew method has been applied to a small number of fields in ocean engineering (Zhao et al., 2020), but this method is still in the exploratory stage and has not yet been validated for its universality in all flow problems.
The present study aims to apply a certain control strategy to the front turbines to augment the overall power output due to its relevance in large-scale wind farm deployment (Liu, 2023). Firstly, this paper combines the AL model with the LES method. In order to further improve the precision of wake simulation, a localized dynamic Smagorinsky (LDS) sub-grid scale (SGS) model is used for turbulence modeling (Piomelli and Liu, 1995; Wang and Bergstrom, 2005), and the new generation Ωnew vortex identification method is coupled to establish a set of high-fidelity numerical simulation method (AL-LDS-Ωnew) for the wind turbine wake. Secondly, tandem twin-rotor turbines are selected as the research objects, and the pitch strategy is introduced for the WT1 to explore the wake interference and overall power output characteristics of the twin-rotor array under different pitch angles. In addition, the latest third-generation Ωnew vortex identification method is successfully applied to the wake vortex visualization of the twin-rotor array under pitch strategy. The applicability and advantages of the third-generation Ωnew vortex identification method are validated against other vortex identification methods (1st generation Vorticity, 2nd generation Q). The influence mechanism of the WT1 wake vortex structure on the WT2 is further revealed, providing a reference for improving the overall output power of the wind farm.
2 Mathematical model
2.1 Governing equations
The grid-filtered Navier-Stokes (N-S) equations for the incompressible LES are as follows:
where ui represents the velocity vector component in the i-direction, and the overbar indicates grid-scale filtered variables. The fε represents the body force source term applied by the wind turbine to the flow field, whereas the τij is the sub-grid stress term defined by the tensor, a variable that needs to be closed by modeling as:
The construction of sub-grid scale (SGS) models has always been a key issue in the LES research. The function of SGS models is to close the sub-grid stress tensor τij in Equation 3. There are differences in the accuracy of different SGS models and their applicability to different physical problems. Currently, several classic SGS models can be roughly divided into: standard Smagorinsky (SS) SGS, average dynamic Smagorinsky (ADS) SGS, and localized dynamic Smagorinsky (LDS) SGS model. The coefficients in the SS SGS model are constant and remain unchanged throughout the numerical simulation process. This model cannot capture the temporal and local effects of the flow field. Although the coefficients in the ADS SGS model vary dynamically, they can only take the same value at each time step; namely, the average value of the entire flow field, which can only reflect the time effect of the flow field. In comparison, the LDS SGS model can dynamically adjust the values of coefficients in the entire flow field based on changes in the turbulent structure of the flow field. They can capture the instantaneous fluctuation characteristics of the high-fidelity flow field.
In the framework of large eddy simulation, this paper ultimately implants a localized dynamic Smagorinsky (LDS) sub-grid scale (SGS) model, further improving the refinement of wind turbine wake simulation from the perspective of turbulence simulation. The discretization of the governing equations (Equations 1, 2) in the paper adopts the collocated finite volume method (CFVM), and the momentum equation is solved using the transient PISO algorithm (Issa, 1986). In terms of time progression, the second-order bounded semi-implicit Crank-Nicholson (CN 1.0) scheme is used. The second-order QUICK scheme is used for the convection term, and the second-order unbounded Gaussian linear scheme of the central difference method is used for the other terms. The linear equation system for pressure p is calculated using the PCG (Preconditioned Conjugate Gradient) solver based on the GAME (Geometric-Algebraic Multi-Grid) method, while the linear equation system for velocity u is calculated using the PBiCG (Preconditioned Bi-Conjugate Gradient) solver.
2.2 Actuator line model
The actuator line (AL) model is a fully three-dimensional (3D) transient aerodynamic model for the horizontal-axis wind turbine, first proposed by Sørensen and Shen (Sorensen and Shen, 2002). The core idea of the AL model is to simplify the wind turbine blades into virtual lines distributed along the radial direction in the flow field. Each actuator element on the AL is defined as the actuator point, as shown in Figure 1. A body (load) force at the actuator point simulates the obstruction effect of the wind turbine on the flow field, whereas the aerodynamic characteristics of the turbine wake are obtained by solving the N-S equation. Therefore, the 3D solid blades are unnecessary to avoid solving the boundary layer on the blade surface. Moreover, there is no need to use the grid rotation strategy (moving-grid, sliding-grid or overset-grid) to realize wind turbine rotation, which will significantly reduce the time of each time step cycle iteration in the simulation process (Ji et al., 2019; Yu et al., 2020).
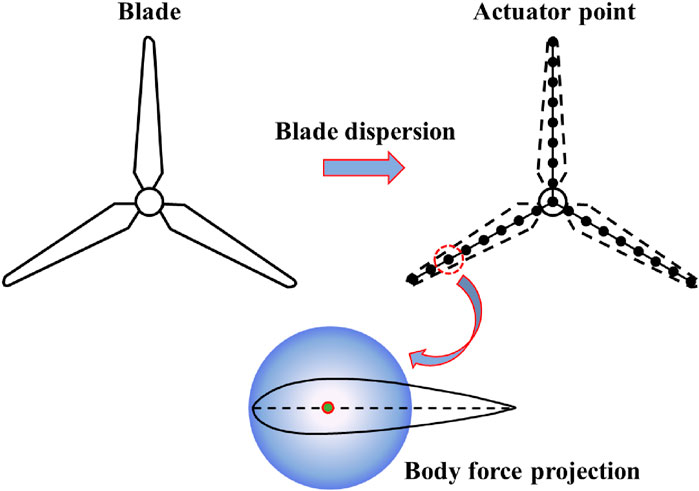
Figure 1. The schematic diagram of the AL model.
Based on the rotational angular velocity ω of the wind turbine, all actuator points update their positions at the end of each time step. Figure 2 shows the velocity triangle of the airfoil section at the radial position of the blade. According to the velocity on the grid element near the actuator point, the local axial velocity Ux and tangential velocity Ur at the actuator point can be obtained through linear interpolation. According to the vector relationship in the velocity triangle, the relative inflow velocity Urel at the actuator point can be calculated using Equation 4.

Figure 2. The velocity triangle of the airfoil section at the actuator point.
The local angle of attack α is defined as the angle between the airfoil chord at the actuator point and the relative inflow velocity Urel, which can be calculated using Equation 5.
where γ and φ represent the pitch and inflow angle of the airfoil section at the actuator point, which can be determined by the included angle between the rotation plane of the wind turbine and the relative inflow velocity Urel. The inflow angle is defined as Equation 6: They are expressed as Equations 7, 8:
The lift L and drag D of the wind turbine at each actuator point are determined by the relative inflow velocity Urel and local angle of attack α.They are expressed as:
where w and c are respectively the blade element thickness and local chord length at the actuator point. The CL and CD denote the lift and drag coefficients respectively, which are only related to the local angle of attack α and the local chord length Reynolds number Rec. The lift and drag coefficients can be obtained by experiments, CFD simulations, table look-up, XFOIL software, etc. (Ji et al., 2022).
In general, the blade tip loss correction Ftip needs to be considered in the lift-drag calculation, which can be calculated by Equations 9, 10.
where
In addition, in order to prevent numerical oscillation (Sorensen and Shen, 2002), the body force source term representing the wind turbine usually needs to be smoothed by introducing a kernel function before solving the flow field. This paper selects the Gaussian kernel function
where the Gaussian projection width ε is a parameter that adjusts the intensity of the body force projection. The d represents the distance from the center of the actuator point to the center of the grid element applied by the body force.
In summary, the key to using the AL model is to smoothly load the body force onto the grid elements near the wind turbine to characterize the turbine’s effect on the flow field. The solving procedure for the AL model can be summarized with the following steps:
(1) According to the current time step, locate all actuator points in each partition of the flow field.
(2) According to Equation 4, calculate the local relative inflow velocity Urel at the location of each actuator point.
(3) According to Equations 9, 10, calculate the body force at all actuator points.
(4) According to Equations 11, 12, the body force is smoothly distributed by the Gaussian projection.
(5) According to Equations 1, 2, solve the flow field.
(6) Rotate the blades.
(7) Execute the next time step.
2.3 Vortex identification method
There are a large number of vortex structures with different intensities and scales in the wind turbine wake, and the vortex plays a crucial role in the generation and maintenance of turbulence. By clearly capturing the vortex structure, the wake flow mechanism can be deeply analyzed, which is significant for studying turbulence problems. However, no unified conclusion exists on the wake vortex’s identification and definition. The vortex identification methods have been developed for three generations, mainly including: 1) the first (Vorticity, etc.); 2) the second (Q, λ2, λci, Δ, etc.); 3) and third-generation (Ωnew, etc.).
The first-generation vortex identification method is based on the Vorticity, which is calculated using Equation 13, where the Vorticity is defined as the curl of the velocity vector.
Although the mathematical definition of the Vorticity is clear, its physical meaning is somewhat unclear (Wang et al., 2020). Many researchers (Shen et al., 2015; Qian et al., 2018; Ren et al., 2020) have found that using the first-generation Vorticity vortex identification method cannot accurately characterize the vortex structure of the flow field. It can only identify a rough vortex surface profile but fails to capture strong and weak vortexes, vortex shedding, and overall vortex development process.
Because the results of the first-generation vortex identification method (Vorticity) are not satisfactory, researchers have proposed the second-generation vortex identification methods (Q, λ2, λci, Δ, etc.). Although their theoretical foundations vary, the Q and λ2 methods can be understood as a correction to the first-generation method. The λci and Δ methods are derived from the influence of velocity gradient tensor
In the subsequent post-processing of this paper, the Q-criterion, which is the most commonly used in the second-generation vortex identification methods, is selected to visualize the wake vortex structure of the wind turbine. The Q-criterion method was proposed by Hunt (Hunt et al., 1988), and the specific calculation formula is shown in Equation 14.
where A and B represent the symmetric and antisymmetric parts of the velocity gradient tensor, respectively.
The second Galilean invariant Q > 0 of the velocity gradient tensor
Based on the above issues, Liu (Liu et al., 2016) conducted original works on the vortex identification methods and proposed a new generation (third-generation) vortex identification method (Ωnew). Its calculation formula is shown in Equation 15, where ε is a small positive number that prevents division by zero.
Obviously, the value of Ωnew ranges from 0 to 1, which can be understood as the concentration of vorticity. The Ωnew represents the rigidity of fluid motion. When Ωnew = 1, the fluid rotates rigidly, whereas if Ωnew > 0.5, the antisymmetric tensor B is dominant over the symmetric tensor A. In practical applications, a Ωnew = 0.52 is usually recommended as a fixed threshold to identify vortex structures (Liu et al., 2016; Ren et al., 2020; Zhao et al., 2020).
Compared with the second-generation vortex identification methods, the Ωnew method has the following advantages: (a) Clear physical meaning; (b) Easiness to implement in programs; (c) simultaneous visualization of strong vortex and weak vortexes, especially more broken weak vortex can be captured (Wang et al., 2020; Zhao et al., 2020); (d) Normalization (the value ranges from 0 to 1), without significantly adjusting the threshold.
In the subsequent analysis of the wind turbine wake vortex in this paper, three different vortex identification methods (1st generation Vorticity, 2nd generation Q, 3rd generation Ωnew) are used to visualize the wake vortex structure of tandem wind turbines, in order to explore the applicability of the latest 3rd generation vortex identification method under pitch strategy of the upstream turbine. This will help further understand the complex wake vortex mechanism of wind turbines.
3 Validation
To validate the calculation accuracy of the (AL-LDS-Ωnew) model, a NREL 5 MW wind turbine model is selected as the research object, with main parameters shown in Table 1. The aerodynamic loads (thrust and power) under different wind speeds are calculated, and the specific case settings are summarized in Tables 2, 3 summarizes the basic numerical methods adopted by this paper and other similar studies.
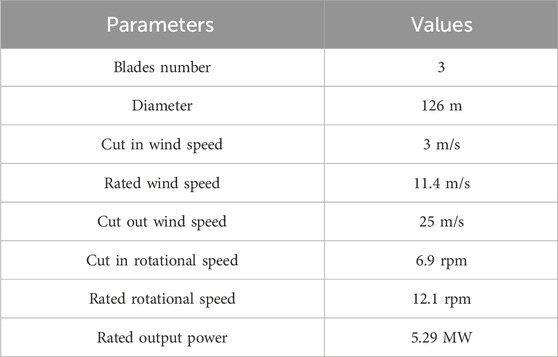
Table 1. The NREL 5 MW wind turbine model parameters.
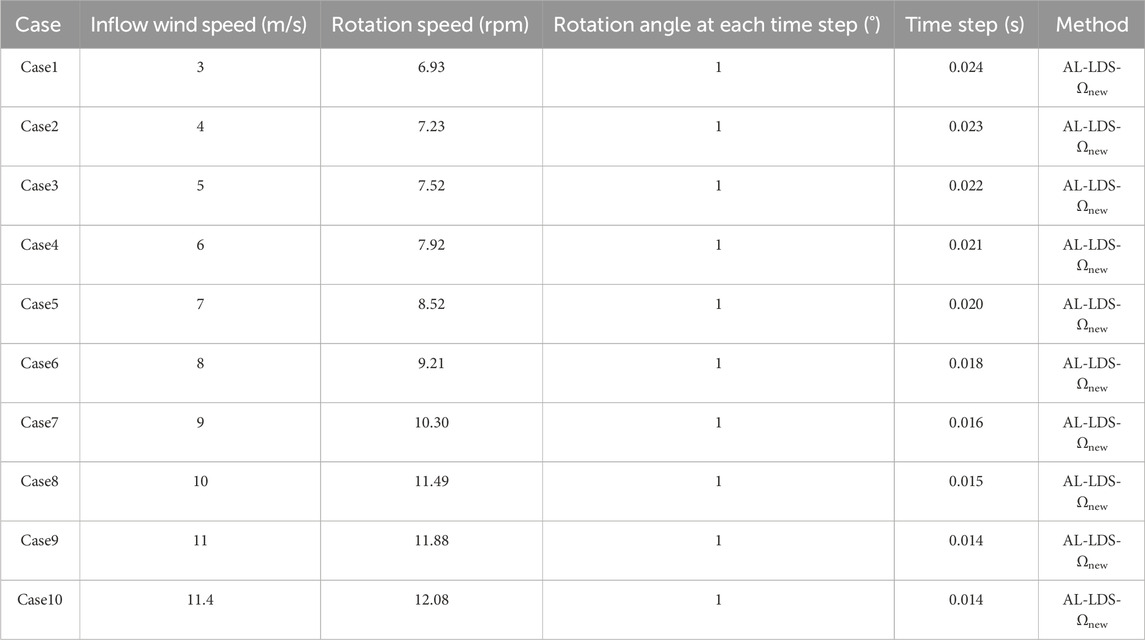
Table 2. Case settings of the wind turbine based on the AL-LDS-Ωnew coupling method.
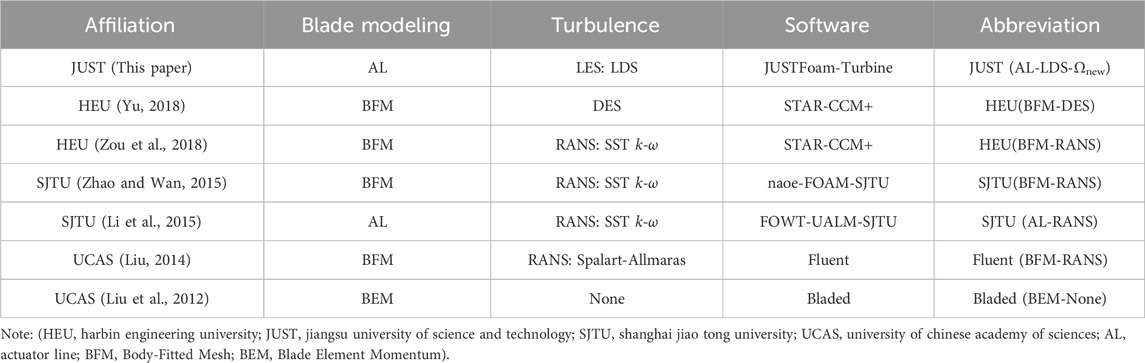
Table 3. Comparison of the basic numerical methods in this paper and other scholars.
Figure 3 compares the calculation results of the newly established AL-LDS-Ωnew coupling method, against the published by the NREL and other scholars. Regarding power, the results of the AL-LDS-Ωnew coupling method and most scholars agree with the NREL benchmark value, however, some scholars’ results have a certain deviation near the rated wind speed. Regarding thrust, the AL-LDS-Ωnew coupling method has a consistent trend with the scholars’ results but is smaller than the NREL benchmark value. The possible reason is that the NREL benchmark value is calculated by the FAST software based on the blade element momentum (BEM) theory, which cannot consider the viscous effect of the fluid and must employ empirical correction models (three-dimensional effect, dynamic stall, rotation effect, blade tip loss, etc.). In comparison, this paper and most scholars use the viscous CFD method. In summary, the calculation accuracy of the newly established AL-LDS-Ωnew coupling method is validated by selecting the NREL 5 MW wind turbine benchmark value and other scholars’ research results, which lays the foundation for the following study on wake effects of multi-rotor wind turbines under the pitch strategy.
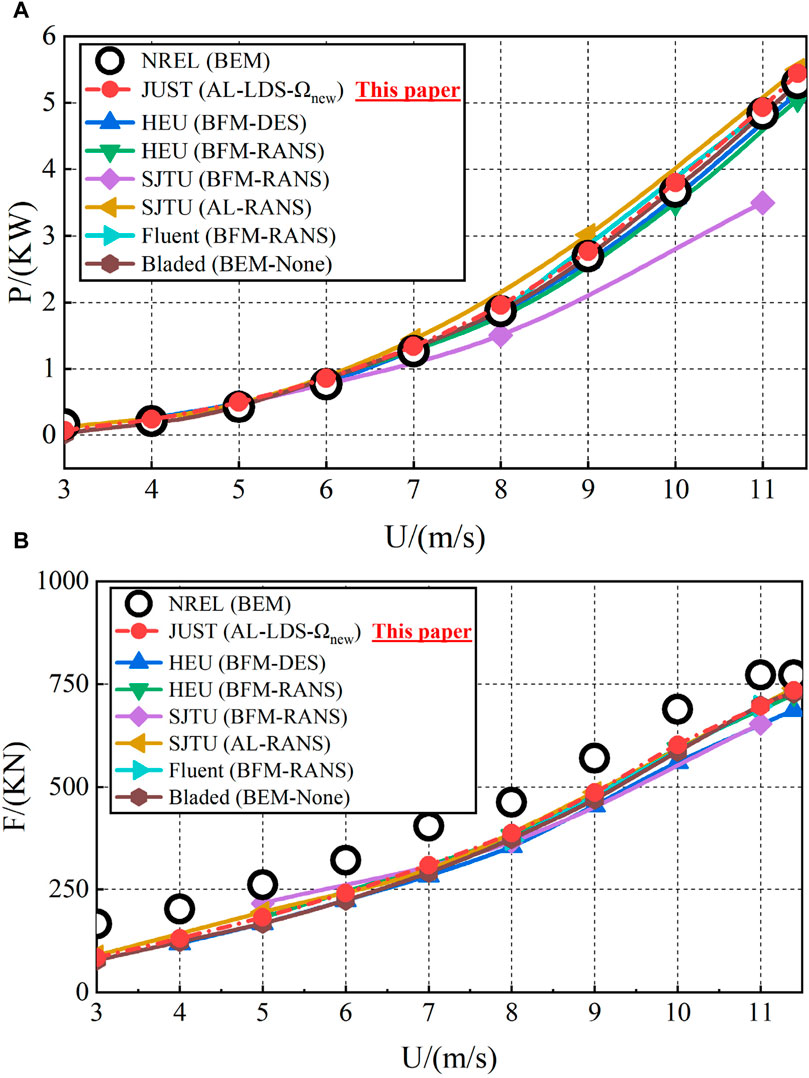
Figure 3. Performance comparison between calculation results of different scholars under different wind speeds and NREL benchmark values. (A) Power (B) Thrust.
4 Case configuration
The NREL 5 MW wind turbine model is still used in the numerical simulation of the wind farm. Figure 4 is the schematic diagram of the calculation domain, where D represents the wind turbine diameter. The x direction of the computational domain is the direction of air flow, with a total length of 18D. The lateral (y) and vertical (z) directions (same as gravity) both measure 6D. Two wind turbines (WT1 and WT2) are arranged in series, with WT1 being 3D away from the inlet and 6D away from WT2.
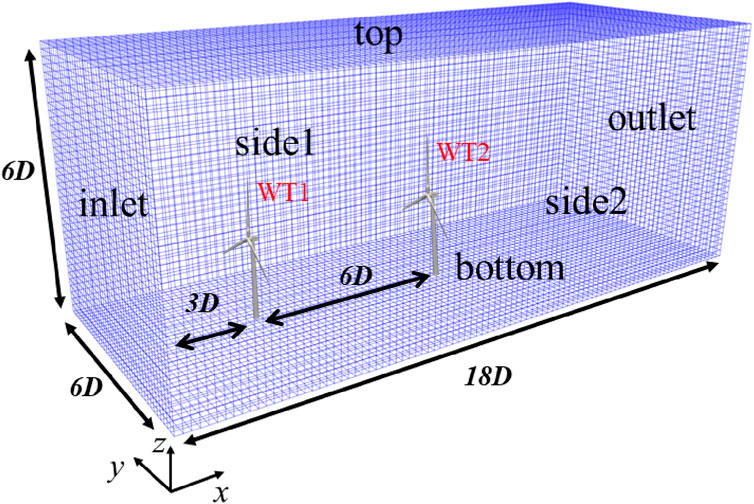
Figure 4. Wind farm calculation domain.
The advantage of the actuator line model is that the Cartesian grid is used to discretize the whole computational domain. There is no need to carry out three-dimensional solid modeling for the wind turbine, which significantly improves computing efficiency. As shown in Figure 5, the mesh adopts a three-layer step-by-step refinement scheme. The minimum grid requirement applies to ensure that the number of grids in the blade diameter direction is 60–80 (Yu et al., 2020; Ji et al., 2022), where the total number of grids is approximately 11 million. The recommended time step selection ensures that the courant number (CFL condition) is less than 0.5. The total calculation time is recommended to circulate the flow field 3–4 times, and the wind speed from the inlet to the outlet is counted as one time. This configuration scheme can clearly capture the blade vortex system (tip and root vortexes) (Sorensen and Shen, 2002).
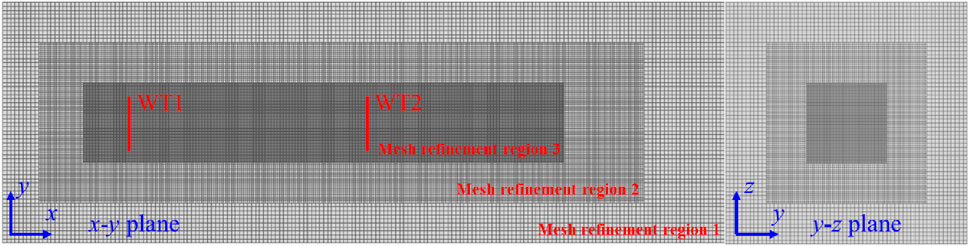
Figure 5. Step-by-step mesh refinement.
In the simulations, the upstream wind turbine (WT1) is equipped with 11 different pitch angles, ranging from −10 to 10, using an interval of 2. However, the pitch angle of the downstream wind turbine (WT2) remains at 0. The case settings are summarized in Table 4. The two wind turbines (WT1 and WT2) in the series are facing the direction of the incoming flow, with the inlet set at the rated wind speed of 11.4 m/s. The outlet and top are pressure outlet boundaries, whereas the bottom is a slip boundary, and the left and right are symmetrical boundaries.
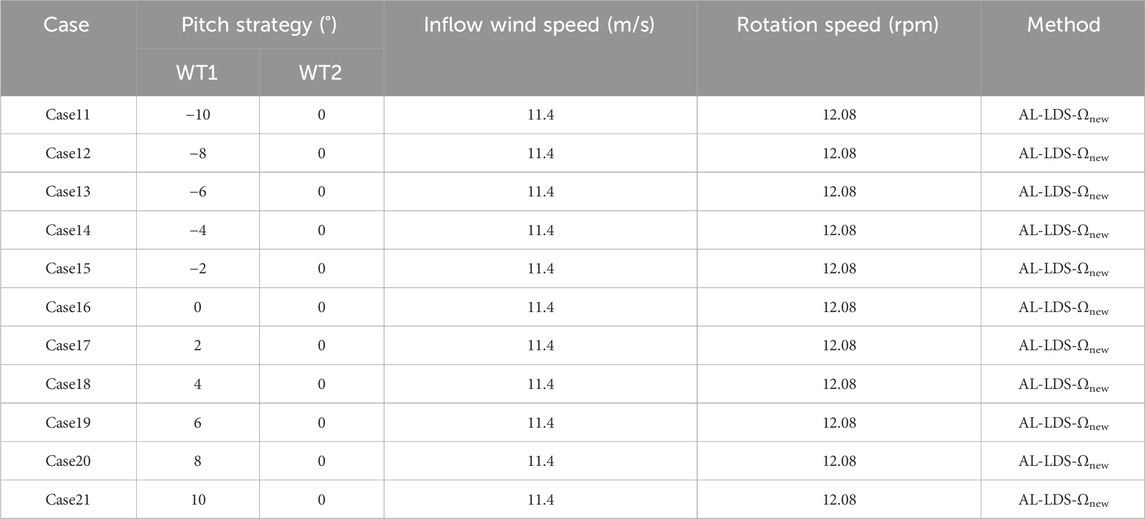
Table 4. Case settings of tandem twin-rotor turbines under pitch strategy.
5 Results
5.1 Power output characteristics
The wind turbine’s power and thrust employ the average of the instantaneous last three cycles (stable state) results. Figure 6 shows the numerical performance (power left, and thrust right) of the tandem twin-rotor turbines under the pitch strategy, in terms of single (green bar for WT2 and red bar for WT1) and overall output (black bars). In addition, the ratio of the power of each wind turbine to the power of WT1 without pitch is defined as the power output ratio η, as shown in Table 5.
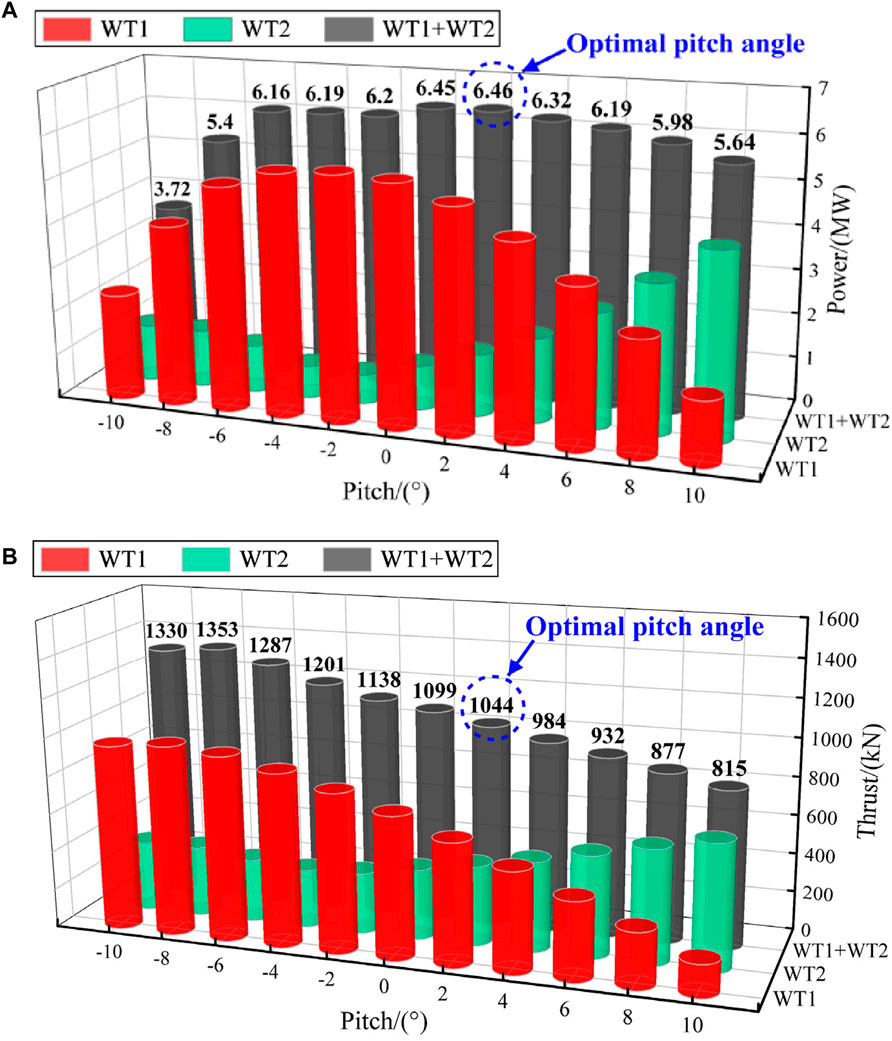
Figure 6. Output power and thrust of tandem twin-rotor turbines. (A) Output power (B) Thrust.
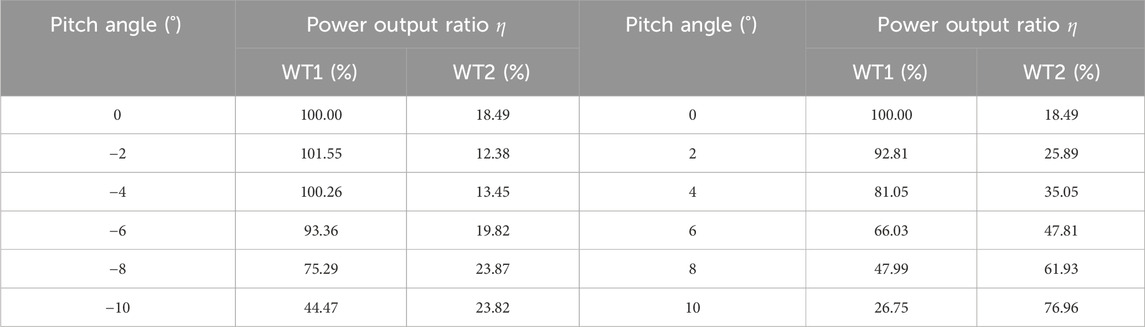
Table 5. Power output ratio η of each wind turbine in the twin-rotor array under pitch strategy.
By analyzing Figure 6; Table 5, it can be seen that.
(1) When the pitch angle of WT1 increases from −10° to 10° using an interval of 2°, the output power of WT1 and WT2 changes obviously. WT1 shows a trend of first increasing and then decreasing, while WT2 shows the opposite trend. When the pitch angle of WT1 is −2, the power of WT1 is a maximum at 5.53 MW, while WT2’s is a minimum at 0.674 MW. However, the combined output power is not the highest among the cases.
(2) When the pitch angle of WT1 increases from negative to zero pitch angles (−10° ∼ 0°), the change of power WT1 is significant. However, it can be seen from Table 5 that the maximum power output ratio η of WT2 is always less than 24%, so WT2 is always in a low-power state. This indicates that although the negative pitch angle reduces the power output of WT1, it still leads to a strong wake state for downstream turbines. Therefore, the negative pitch angle should be avoided in wind farm engineering.
(3) When the pitch angle of WT1 changes increases from zero to positive pitch angles (0° ∼ 10°), the power of WT1 gradually decreases, while the power of WT2 gradually increases. Table 5 shows that the maximum power output ratio η of WT2 is close to 77%. The above indicates that the positive pitch angle reduces the power and wake output of the WT1, improving the inflow conditions of downstream turbines and as well the WT2 power. Therefore, the front wind turbines can find an optimal positive pitch angle.
(4) The overall maximum output power of the tandem twin-rotor array occurs at a pitch angle of 2°, with a maximum power value of 6.4648 MW, compared to a slightly lower power reduction (0.29%) of 6.4463 MW using 0 pitch angle. However the thrust in the maximum power state is lower: 5% in combined and 14.13% in the front mode (WT1) This not only reduces the fatigue load, but also benefits the long-term operation of the wind turbine.
(5) The overall minimum output power of the tandem twin-rotor array occurs at a pitch angle of −10°, with a minimum power value of 3.7162 MW. Compared with the results at the optimal pitch angle of 2, the overall output power decreases by 42.5%, while the overall thrust increases by 27.4%, further indicating that the wind turbine should avoid the occurrence of the negative pitch angle.
5.2 Wake velocity contour
Figure 7 shows the wake velocity contour of the tandem twin-rotor array at hub height with varying WT1’s pitch angles. The following can be conclude:
(1) When WT1 rotates directly against the inflow direction, a wake velocity deficit region is formed behind WT1. Meanwhile, a backward flow propagation expands the stream tube, which is slightly larger than the diameter of the wind turbine. When the wake develops to the downstream turbine position, a severe secondary velocity deficit occurs, affecting the downstream turbine’s output power and increasing the power fluctuation and fatigue load.
(2) When the pitch angle is negative (Pitch < 0°), the wake velocity deficit of WT1 is more severe, indicating that although the output power of WT1 is reduced due to the negative pitch angle, the wake effect of WT1 is not weakened and WT2 is still in a strong wake state (consistent with the conclusion of the previous section). In addition, the length of the near wake under the negative pitch angle is shorter, and the wake’s expansion trend and meandering phenomenon are more obvious. The instability of the wake increases, and WT2 stays completely in the mixing region of the wake, which increases its fatigue stress; it is not conducive to the long-term operation of the wind turbine.
(3) When the pitch angle is positive (Pitch > 0°), the wake velocity deficit of WT1 is reduced compared with a negative pitch angle, which improves the inflow conditions of WT2 and leads to an increase in WT2 output power (consistent with the conclusion in the previous section). Meanwhile, under the positive pitch angle, the near wake length becomes longer, whereas the wake expansion trend is weaker and the wake propagates more stably downstream. That is to say, the downstream turbine is in the stable region of the wake. Therefore, in order to achieve global optimization, the optimal positive pitch angle must be found in the wind farm layout. In addition, as the positive pitch angle further increases, the meandering phenomenon of the wake disappears.
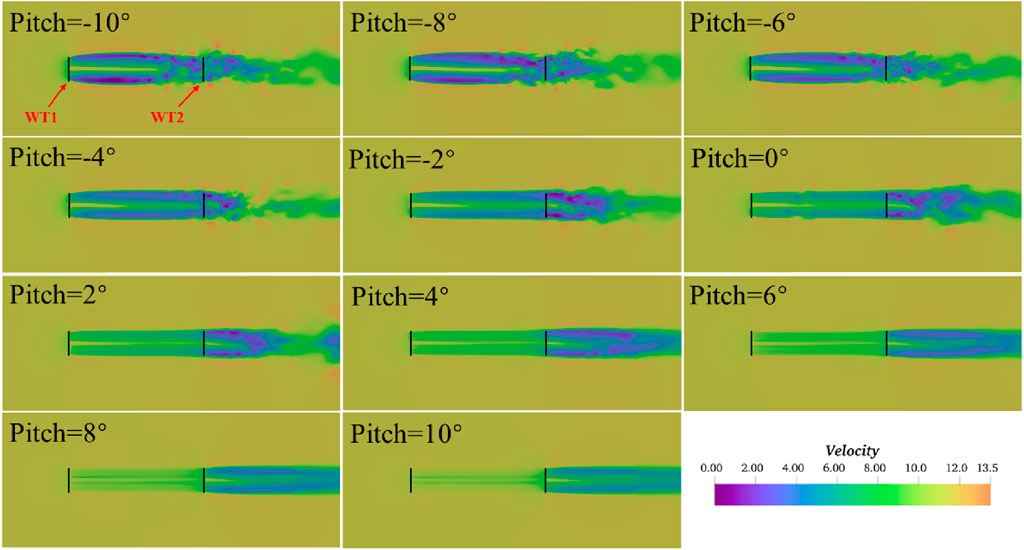
Figure 7. Wake velocity contour of the tandem twin-rotor array.
5.3 Wake vortex structures
In order to deeply understand the influence mechanism of upstream turbine wake vortex structure on downstream wake, the third-generation vortex identification method (Ωnew) is applied to the wake vortex identification of wind turbine under pitch strategy for the first time. In the wake analysis, only the optimal pitch angle of 2° is selected. By comparing the differences in wake vortex visualization among three different vortex identification methods (1st generation Vorticity, 2nd generation Q, and 3rd generation Ωnew), the applicability of the latest third-generation Ωnew method in turbine wake vortex identification under pitch strategy is investigated, and the advantages of this method compared with the previous generation methods are discussed.
The first-generation vortex identification method (Vorticity) is used to visualize the vortex structure by selecting five different thresholds, as shown in Figure 8. The following can be seen.
(1) The displayed vortex structure rapidly decreases with threshold value.
(2) The downstream development of the wake vortex structure of WT1 is reasonably captured using Vorticity = 0.2, which in turn affects the inflow condition of WT2.
(3) After repeated debugging of the thresholds, it is found that the first-generation vortex identification method (Vorticity) displays defects. It can only identify a rough outline of the vortex surface but not the root, tip, strong and weak vortex, in addition to the vortex shedding and development.
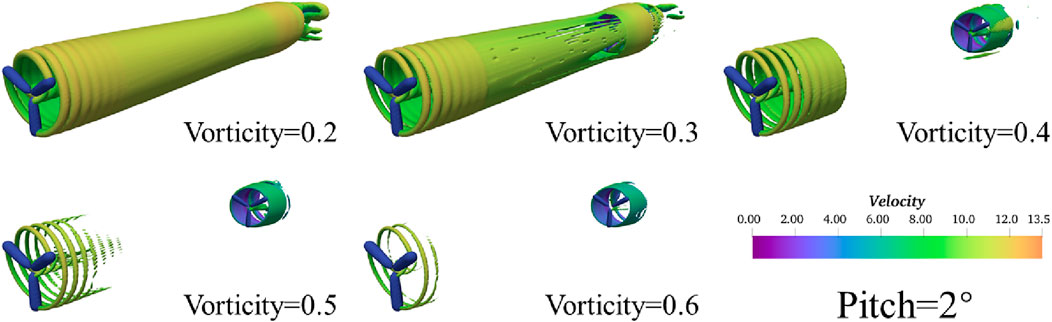
Figure 8. Under the optimal pitch angle of 2, the first-generation vortex identification method (Vorticity) visualizes the wake vortex structure of the wind turbine.
Secondly, by using the second-generation vortex identification method (Figure 9) the following can be concluded:
(1) It is also necessary to repeatedly adjust different thresholds to visualize the wake vortex structure, relying significantly on experience. Likewise, the displayed vortex structure gradually decreases with threshold.
(2) A Q = 0.0001 leads to a better capture of the blade tip vortex developing downstream and gradually merging into vortex surfaces, thereby affecting downstream turbines.
(3) Only the strong vortex structure can be captured as the weak vortex structure after the vortex surface is broken.
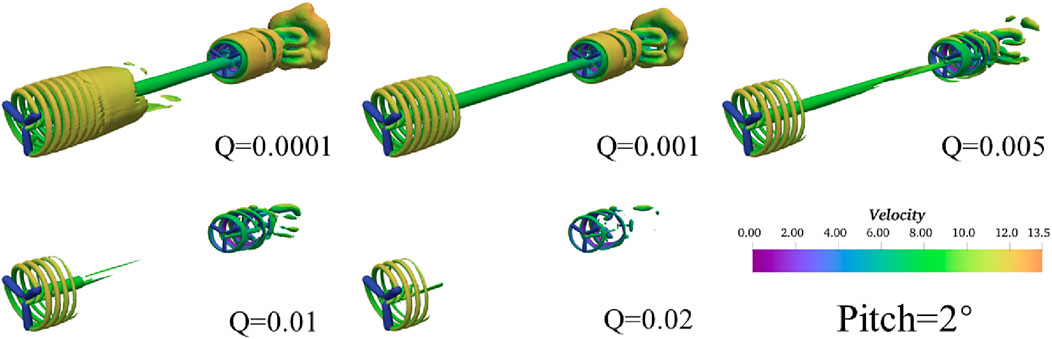
Figure 9. Under the optimal pitch angle of 2, the second-generation vortex identification method (Q) visualizes the wake vortex structure of the wind turbine.
Finally, Figure 10 explores the applicability of Ωnew by selecting five thresholds near Ωnew = 0.52. It can be stated that.
(1) Visualization of the wake vortex structure does not rely on the selection of thresholds.
(2) The recommended value (Ωnew = 0.52) is also applicable under a pitch strategy (Liu et al., 2016).
(3) The process of the blade vortex system developing downstream and gradually dissipating can be clearly captured.
(4) The Ωnew method can capture both strong and weak vortexes simultaneously. The wake vortex of WT1 gradually develops downstream and interacts with WT2, threby separating the upstream wake vortex into several (broken) weak vortexes. This phenomenon cannot be captured by adjusting the threshold using other methods.
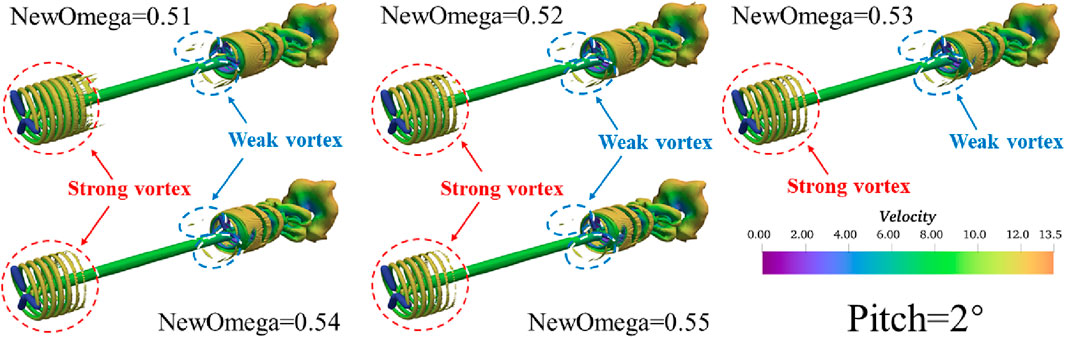
Figure 10. Under the optimal pitch angle of 2, the third-generation vortex identification method (Ωnew) visualizes the wake vortex structure of the wind turbine.
In summary, a comparison of the three different vortex identification methods reveals the AL-LDS-Ωnew coupling method provides a more refined vortex structure (strong and weak vortexes) at a fixed threshold. It is due to the coupling the high-accuracy dynamic sub-grid scale (SGS) model and the new-generation vortex identification method (Ωnew). This provides a new approach for the future refined numerical simulation of the wind farm.
6 Conclusion
In this paper, a refined numerical simulation method (AL-LDS-Ωnew) for the wind turbine wake is developed by coupling the AL with a high-accuracy localized dynamic SGS and the third-generation Ωnew method. The overall wake and performance characteristics (power and thrust) of the tandem twin-rotor array are explored by changing the pitch angle of the front turbine WT1 (−10° ∼ 10°). The following can be concluded:
(1) When the WT1 is at a negative pitch angle, its power and not the wake effect decreases. The velocity deficit becomes more severe and WT2 stays in a strong wake state. Therefore, the negative pitch angle should be avoided in wind farm engineering.
(2) Under a negative pitch angle state, the near wake length of WT1 is shorter, and the wake’s expansion trend and meandering phenomenon are more obvious. The instability of the wake increases, and WT2 stays completely in the mixing region of the wake, increasing its fatigue stress.
(3) When WT1 is at a positive pitch angle, its wake and power output decreases, improving the inflow conditions of WT2. In engineering applications, the optimal positive pitch angle should be selected to reduce farm costs.
(4) At a positive pitch angle state, the near wake length of WT1 increases, whereas the expansion shortens yet the downstream development is stable. In other words, the rear turbine WT2 stays in the stable region of the WT1’s wake. As the positive pitch angle further increases, the meandering phenomenon of the wake disappears.
(5) The overall maximum output power of the tandem twin-rotor array occurs at a pitch angle of 2. Compared to the no-pitch case, the overall output power increases by 0.29%, and the thrust decreases: 5% in combined and 14.13% in single (WT1) state. This reduces the fatigue load of the turbine and is more conducive to the long-term operation of the turbine.
(6) Regarding the vortex structure, the first-generation method (Vorticity) captures a rough vortex surface profile, incorrectly characterizing the environmental flow impact. The second-generation method (Q) is able to capture the blade vortex system development and dissipation, but threshold selection remains difficult. By contrast, the threshold of the third-generation method (Ωnew) is fixed, thus capturing strong and broken weak vortexes due to interaction with rear downstream turbines; this cannot be captured by other vortex identification methods.
In general, the applicability and advantages of the third-generation method (Ωnew) in visualizing the wake vortex of the tandem twin-rotor array are validated using a simple turbine pitch optimization. Future work should concentrate in wake and performance optimization, using front and rear pitch-controlled turbines, as a continuous incentive for pitch control systems in the wind farm layouts.
Data availability statement
The original contributions presented in the study are included in the article/supplementary material, further inquiries can be directed to the corresponding authors.
Author contributions
RJ: Methodology, Validation, Writing–original draft, Writing–review and editing. MK: Data curation, Software, Writing–review and editing. KS: Conceptualization, Data curation, Funding acquisition, Investigation, Methodology, Resources, Writing–original draft. JZ: Funding acquisition, Investigation, Resources, Supervision, Writing–original draft. RZ: Writing–review and editing, Funding acquisition, Resources, Supervision. MY: Writing–review and editing, Data curation, Formal Analysis, Software. YZ: Investigation, Writing–review and editing, Methodology, Resources. EF-R: Investigation, Writing–review and editing.
Funding
The author(s) declare that financial support was received for the research, authorship, and/or publication of this article. This work was supported by the Basic Science (Natural Science) Foundation of the Jiangsu Higher Education Institutions of China (No. 24KJB570001), the National Natural Science Foundation of China (No. 52171255 and 52271318) and the Key Project of NSFC-Shandong Joint Research Funding POW3C (No. U1906230).
Conflict of interest
The authors declare that the research was conducted in the absence of any commercial or financial relationships that could be construed as a potential conflict of interest.
Publisher’s note
All claims expressed in this article are solely those of the authors and do not necessarily represent those of their affiliated organizations, or those of the publisher, the editors and the reviewers. Any product that may be evaluated in this article, or claim that may be made by its manufacturer, is not guaranteed or endorsed by the publisher.
References
Boadu, S., and Otoo, E. (2024). A comprehensive review on wind energy in Africa: challenges, benefits and recommendations. Renew. Sustain. Energy Rev. 191, 114035. doi:10.1016/j.rser.2023.114035
Fleming, P., Gebraad, P. M. O., Lee, S., van Wingerden, J. W., Johnson, K., Churchfield, M., et al. (2015). Simulation comparison of wake mitigation control strategies for a two-turbine case. Wind Energy 18 (12), 2135–2143. doi:10.1002/we.1810
Gao, Z., Li, Y., Wang, T., Shen, W., Zheng, X., Pröbsting, S., et al. (2021). Modelling the nacelle wake of a horizontal-axis wind turbine under different yaw conditions. Renew. Energy 172, 263–275. doi:10.1016/j.renene.2021.02.140
Hornung, C., Viellieber, M., and Class, A. (2015). Simulation of wake effects of windfarms using an Actuator Disk implementation. PAMM 15 (1), 487–488. doi:10.1002/pamm.201510234
Hu, D., Yang, G., Huo, N., et al. (2016). Effect of dynamic inflow on the performance of wind turbine. Renew. Energy Resour. (7), 1058–1066. (in Chinese). doi:10.13941/j.cnki.21-1469/tk.2016.07.017
Huang, Y., Cao, L., and Wan, D. (2021). Application of liutex for analysis of complex wake flows characteristics of the wind turbine[M],” in Liutex and third generation of vortex definition and identification. Cham: Springer, 353–371.
Hunt, J., Wray, A., and Moin, P. (1988). Eddies, stream, and convergence zones in turbulent flows[R]. Center for Turbulent Research Report CTR-S88.
Issa, R. I. (1986). Solution of the implicitly discretised fluid flow equations by operator-splitting. J. Comput. Phys. 62 (1), 40–65. doi:10.1016/0021-9991(86)90099-9
Ji, R., Sheng, Q., Wang, S., Zhang, Y., Zhang, X., and Zhang, L. (2019). Array characteristics of oscillating-buoy two-floating-body wave-energy converter. J. Mar. Sci. Appl. 18 (3), 325–333. doi:10.1007/s11804-019-00079-5
Ji, R., Sun, K., Wang, S., Li, Y., and Zhang, L. (2018). Analysis of hydrodynamic characteristics of ocean ship two-unit vertical axis tidal current turbines with different arrangements. J. Coast. Res. 83 (83), 98–108. doi:10.2112/si83-017.1
Ji, R., Sun, K., Zhang, J., Zhu, R., and Wang, S. (2022). A novel actuator line-immersed boundary (AL-IB) hybrid approach for wake characteristics prediction of a horizontal-axis wind turbine. Energy Convers. Manag. 253, 115193. doi:10.1016/j.enconman.2021.115193
Li, F., Yao, J., Eskilsson, C., Pan, Y., Chen, J., and Ji, R. (2023). Investigations on the wave performance of Savonius turbine operating under initial phase-locked strategy. Phys. Fluids 35 (9), 097138. doi:10.1063/5.0162835
Li, P., Cheng, P., Wan, D., and Xiao, Q. (2015) “Numerical simulations of wake flows of floating offshore wind turbines by unsteady actuator line model,” in Proceedings of the 9th international workshop on ship and marine hydrodynamics. Glasgow, UK, 26–28.
Liu, C. Q., Wang, Y. Q., Yang, Y., and Duan, Z. (2016). New omega vortex identification method. Sci. China Phys. Mech. and Astronomy 59 (8), 684711–684719. doi:10.1007/s11433-016-0022-6
Liu, Q. (2014). Dynamic response and aerodynamic characteristics of floating wind turbines[D]. University of Chinese Academy of Sciences. (in Chinese).
Liu, Q., Yang, K., Huang, C.-W., Zhang, L., and Xu, J.-Z. (2012). Simulation and analysis of the aerodynamic characteristics of a 5MW wind turbine. J. Eng. Thermophys. 33 (7), 1155–1159. (in Chinese).
Liu, S., Li, Q., Lu, B., and He, J. (2024). Impact of incoming turbulence intensity and turbine spacing on output power density: a study with two 5MW offshore wind turbines. Appl. Energy 371, 123648. doi:10.1016/j.apenergy.2024.123648
Liu, Y. (2023). The effect of vertical arrangement on performance and wake characteristics of two tandem offshore wind turbines under various operating conditions. Energy Convers. Manag. 278, 116743. doi:10.1016/j.enconman.2023.116743
Mühle, F. V., Heckmeier, F. M., Campagnolo, F., and Breitsamter, C. (2024). Wind tunnel investigations of an individual pitch control strategy for wind farm power optimization. Wind Energy Sci. 9 (5), 1251–1271. doi:10.5194/wes-9-1251-2024
Piomelli, U., and Liu, J. (1995). Large-eddy simulation of rotating channel flows using a localized dynamic model. Phys. fluids 7 (04), 839–848. doi:10.1063/1.868607
Qian, Y., Zhang, Z., and Wang, T. (2018). Comparative study of the aerodynamic performance of the New Mexico rotor under yaw conditions. Energies 11 (4), 833. doi:10.3390/en11040833
Ren, Z., Wang, J., and Wan, D. (2020). Investigation of the flow field of a ship in planar motion mechanism tests by the vortex identification method. J. Mar. Sci. Eng. 8 (9), 649. doi:10.3390/jmse8090649
Shen, W. Z., Zhu, W. J., and Yang, H. (2015). Validation of the actuator line model for simulating flows past yawed wind turbine rotors. J. Power Energy Eng. 3 (07), 7–13. doi:10.4236/jpee.2015.37002
Sorensen, J. N., and Shen, W. Z. (2002). Numerical modeling of wind turbine wakes. J. Fluids Eng. 124 (2), 393–399. doi:10.1115/1.1471361
Sun, K., Ji, R., Zhang, J., Li, Y., and Wang, B. (2021). Investigations on the hydrodynamic interference of the multi-rotor vertical axis tidal current turbine. Renew. Energy 169, 752–764. doi:10.1016/j.renene.2021.01.055
Wang, B. C., and Bergstrom, D. J. (2005). A general optimal formulation for the dynamic Smagorinsky subgrid-scale stress model. Int. J. Numer. Methods Fluids 49 (12), 1359–1389. doi:10.1002/fld.1031
Wang, Y., Gao, Y., Xu, H., Dong, X. r., Liu, J. m., Xu, W. q., et al. (2020). Liutex theoretical system and six core elements of vortex identification. J. Hydrodynamics 32 (2), 197–211. doi:10.1007/s42241-020-0018-0
Wang, Y., Miao, W., Ding, Q., and Xiang, B. (2019). Numerical investigations on control strategies of wake deviation for large wind turbines in an offshore wind farm. Ocean. Eng. 173, 794–801. doi:10.1016/j.oceaneng.2019.01.042
Yu, S. (2018). The aerodynamic analysis of Spar type floating offshore wind turbine[D]. Harbin Engineering University. (in Chinese).
Yu, Z., Hu, Z., Zheng, X., Ma, Q., and Hao, H. (2020). Aeroelastic performance analysis of wind turbine in the wake with a new elastic actuator line model. Water 12 (5), 1233. doi:10.3390/w12051233
Yuan, R., Ji, W., Luo, K., Wang, J., Zhang, S., Wang, Q., et al. (2017). Coupled wind farm parameterization with a mesoscale model for simulations of an onshore wind farm. Appl. Energy 206, 113–125. doi:10.1016/j.apenergy.2017.08.018
Yuan, Z., Sheng, Q., Sun, K., Zang, J., Zhang, X., Jing, F., et al. (2021). The array optimization of vertical axis wind turbine based on a new asymmetric wake model. J. Mar. Sci. Eng. 9 (8), 820. doi:10.3390/jmse9080820
Zeng, X., Shao, Y., Feng, X., Xu, K., Jin, R., and Li, H. (2024). Nonlinear hydrodynamics of floating offshore wind turbines: a review. Renew. Sustain. Energy Rev. 191, 114092. doi:10.1016/j.rser.2023.114092
Zeng, X., Shi, W., Feng, X., Shao, Y., and Li, X. (2023). Investigation of higher-harmonic wave loads and low-frequency resonance response of floating offshore wind turbine under extreme wave groups. Mar. Struct. 89, 103401. doi:10.1016/j.marstruc.2023.103401
Zeng, X., Shi, W., Michailides, C., Wang, K., and Li, X. (2021b). Comparative experimental and numerical study of wave loads on a monopile structure using different turbulence models. China Ocean. Eng. 35, 554–565. doi:10.1007/s13344-021-0050-z
Zeng, X., Shi, W., Michailides, C., Zhang, S., and Li, X. (2021a). Numerical and experimental investigation of breaking wave forces on a monopile-type offshore wind turbine. Renew. Energy 175, 501–519. doi:10.1016/j.renene.2021.05.009
Zhang, S. (2014). Analysis of wake flow fields and aerodynamic performance for horizontal-axis wind turbine[D]. Lanzhou University of Technology. (in Chinese).
Zhang, W. (2018). Detached Eddy Simulation of wind turbine wake effects[D]. North China Electric Power University. (in Chinese).
Zhang, Y., Ji, R., Sun, K., Zhang, Z., Zheng, Y., Zhang, J., et al. (2022). Research on complex wake interference of aligned rotors considering the precone variation of the upstream wind turbine. Front. Mar. Sci. 9, 1039233. doi:10.3389/fmars.2022.1039233
Zhao, W., and Wan, D. (2015). Numerical study of interactions between phase II of OC4 wind turbine and its semi-submersible floating support system. J. Ocean Wind Energy 2 (01), 45–53.
Zhao, W., and Wan, D. (2021). “Vortex identification study of flow past stationary or oscillating cylinder[M],” in Liutex and third generation of vortex definition and identification (Cham: Springer), 315–325.
Zhao, W., Wang, J., and Wan, D. (2020). Vortex identification methods in marine hydrodynamics. J. Hydrodynamics 32 (02), 286–295. doi:10.1007/s42241-020-0022-4
Keywords: wind turbine, actuator line, localized dynamic Smagorinsky, Ωnew vortex identification method, pitch strategy, array effect
Citation: Ji R, Kong M, Sun K, Zhang J, Zhu R, Yin M, Zhang Y and Fernandez-Rodriguez E (2024) Wake interference of tandem wind turbines considering pitch strategy based on the AL-LDS-Ωnew coupling method. Front. Energy Res. 12:1449454. doi: 10.3389/fenrg.2024.1449454
Received: 19 June 2024; Accepted: 29 July 2024;
Published: 12 August 2024.
Edited by:
Eldad Avital, Queen Mary University of London, United KingdomReviewed by:
Yang Yang, Ningbo University, ChinaHaitao Wu, University of Strathclyde, United Kingdom
Jing Liu, Sun Yat-Sen University, China
Copyright © 2024 Ji, Kong, Sun, Zhang, Zhu, Yin, Zhang and Fernandez-Rodriguez. This is an open-access article distributed under the terms of the Creative Commons Attribution License (CC BY). The use, distribution or reproduction in other forums is permitted, provided the original author(s) and the copyright owner(s) are credited and that the original publication in this journal is cited, in accordance with accepted academic practice. No use, distribution or reproduction is permitted which does not comply with these terms.
*Correspondence: Ke Sun, c3Vua2VAaHJiZXUuZWR1LmNu; Jianhua Zhang, empoQGhyYmV1LmVkdS5jbg==