 Vlatko Milić1,2*
- 1Division of Energy Systems, Department of Management and Engineering, Linköping University, Linköping, Sweden
- 2Division of Building, Energy and Environment Technology, Department of Technology and Environment, University of Gävle, Gävle, Sweden
In the era of society’s ongoing digitization and the exponential growth in data volume, alongside a growing energy demand, energy management plays an integral role in data centers (DCs) and is a key factor in the quest for decarbonization. In light of the complex nature of DCs, traditional energy management strategies are inadequate. This research introduces a data-driven decision-making framework for DCs, grounded in the OODA (Observation, Orientation, Decision, and Action) loop and based on insights from an Ericsson-operated DC in Linköping, Sweden. The developed framework enables DCs to enhance energy efficiency effectively. Rooted in the OODA loop and leveraging extensive datasets from DCs’ building management systems, this framework aids in decreasing cooling energy usage through strategic, data-driven decision-making. By adopting AI methods, specifically K-means clustering in this research, for continuous monitoring and fine-tuning (Proportional, Integral, Derivative) PID parameters, the framework aids in improving operational efficiency.
Highlights
• Data-driven DC energy management.
• The framework is grounded in the OODA loop.
• Insights from an Ericsson-operated DC in Linköping, Sweden.
• The framework provides decision support for cooling operations.
1 Introduction
1.1 Background
The rapid evolution of data centers (DCs) necessitates the development of novel energy management strategies in the pursuit of carbon neutrality (Shao et al., 2022). In 2022, the global DC market was $195 billion and is forecasted to grow at an annual growth rate of 11% from 2023 to 2030 (Grand View Research, 2030). The approximated electricity use of DCs globally in 2022 was between 240 and 340 TWh1, corresponding to 1%–1.3% of the total worldwide electricity demand (International Energy Agency, 2023). In fact, with the escalating growth in data volume, it is expected that the electricity usage attributed to DCs will substantially increase in the future (Andrae, 2017). In the context of continuous digitization in society, coupled with rapid growth in data volume, and increased electricity demand, the importance of energy efficiency in this sector becomes integral to achieving sustainable development.
Existing research highlights a substantial potential for improving energy efficiency in the industrial sector by adopting energy management strategies (Thollander and Ottosson, 2010). Proper management and operation of a company’s energy system are essential to establish market leadership in their industry, particularly for energy-intensive sectors (Schulze et al., 2016), such as DCs. Nonetheless, it is important to be aware that effective energy management necessitates a comprehensive understanding of the dynamic energy use patterns within the organization (ISO 50006, 2023). As these facilities continue to grow in size and complexity, traditional approaches to energy management are proving to be inadequate (Panwar et al., 2022; Clean Energy Institute, 2024). As a result, there is an urgent need for innovative strategies, including cooling approaches, to tackle the evolving challenges of energy management in DCs (Panwar et al., 2022; Manganelli et al., 2021).
An increasingly more common approach to improve energy efficiency and decrease environmental impact from the energy sector involves Artificial Intelligence (AI) (IEA, 2017; Rolnick and al, 2019). Beyond the energy industry, AI has already become a fundamental component in other industries, such as manufacturing and healthcare (Kim et al., 2021; Alowais et al., 2023). An essential feature of AI is its ability to analyze patterns within extensive datasets, a task that is challenging for humans to perform due to the intricate nature and vast size of the datasets. In the realm of DCs, this capability is particularly crucial, given the substantial volume of data generated by measurements and operations of servers and cooling equipment.
Energy management strategies have previously effectively decreased energy usage of DC components (Guitart, 2017). For example, numerous scientific investigations have applied computational fluid dynamics (CFD) procedures to enhance DC energy efficiency, such as (Gupta et al., 2020; Gupta et al., 2021; Lee et al., 2023; Liu et al., 2023; Manaserh et al., 2021; Lim and Chang, 2021). Gupta et al. (2020) developed a trade-off energy management strategy to decrease the Power Usage Effectiveness (PUE) while maximizing exergy efficiency through multi-objective optimization and CFD in an air-cooled DC. In another study, Gupta et al. (2021) introduced an approach for optimizing cooling in a multi-rack DC with a two-dimensional workload distribution. Similarly, the authors used multi-objective optimization and CFD procedures. The results showed that regulating chilled water flow temperature and airflow setpoints holds significant potential for improving energy efficiency. Lee et al. (2023) used CFD and evaporative cooling to enhance DC energy management. The findings indicated that evaporative cooling can assist in adding cooling capacity to the supplied air and decrease the cooling load. Based on CFD and statistical analysis in combination with historical and real-time datasets, Liu et al. (2023) decreased the maximum server temperature by 30% in air-cooled servers. Moreover, Manaserh et al. (2021) studied the effects on cooling capacity and PUE resulting from the integration of liquid cooling-based technologies. Their approach involved utilizing an experimentally validated CFD modeling strategy, revealing a PUE of 1.06 along with effective cooling performance. Lim and Chang, (2021) applied CFD to investigate airflow characteristics associated with hot spots. CFD simulations and experimental investigations demonstrated that a vertical angle of 60˚ enhances temperature distribution and reduces the risk of hot spots. While CFD procedures offer benefits in DC energy management, it is important to be aware that simulations of this nature are often time-consuming and computationally complex (Jóczik et al., 2022). Other energy management methods, including the implementation of AI, have been used in DCs (Senthilkumar et al., 2023; Manaserh et al., 2022; Milić et al., 2023). However, as stated by Guitart (Guitart, 2017), while certain energy management methods have managed to successfully decrease DC energy use, sustainable energy management requires a holistic and interconnected approach. Current research has largely overlooked the integration of a continuous and adaptive framework, which is important for responding to the dynamic and evolving requirements of DC operations. In this quest, the Observation, Orientation, Decision, and Action (OODA) loop (Osinga, 2005; Richards, 2011) facilitates a responsive and adaptive approach. This is achieved by the ongoing assessment and adjustments to enhance DC energy efficiency. Moreover, integrating phronesis (practical experience), episteme (theoretical and scientific knowledge), and techne (professional knowledge) is important in decision-making related to energy management aspects (Thollander and Palm, 2023). This integration ensures practical application and increases knowledge within the organization.
1.2 Research contribution
The modern digital landscape relies on DCs. The extensive energy use associated with server operations and cooling processes is a defining characteristic of this sector. As a result, increasing energy efficiency in DCs stands as a pivotal focus to achieve sustainability objectives. Energy management approaches, which have shown success in various other sectors, are instrumental in reducing energy use. Despite the comprehensive research carried out on energy management across different industries, the scientific community has not given detailed attention to the aspects of process cooling within the context of DCs, particularly in relation to AI applications. To shed light on this overlooked research field, the objective of this research is to develop an AI-powered decision-making framework for energy management in DCs. By including both practical and theoretical knowledge within an OODA loop designed for the framework, this approach provides a holistic method for effectively addressing real-world challenges in the pursuit of increasing energy efficiency in the DC sector. Another key feature of the framework is the inclusion of data-driven analysis, which facilitates time-effective exploration of opportunities for enhancing energy efficiency, such as detecting deviating cooling patterns through AI-driven visualization of cooling parameters. This analysis is enhanced by the inclusion of an interdisciplinary team, which incorporates phronesis, episteme, and techne, enabling a holistic energy management approach. This integration is a key contribution of the research, particularly in the context of DCs. The research object is a DC situated in the city of Linköping, Sweden, and is operated and managed by Ericsson AB, a multinational networking and telecommunications company.
The novelty of the proposed research is the design of data-driven energy management approach within the realm of DCs, which can contribute to rapid decision-making and adaptation to changing circumstances related to the DC operation, such as dynamically adjusting cooling loads as a response to equipment failure and reconfiguration of (Proportional, Integral, Derivative) PID parameters in cooling units based on AI-powered insights. This is achieved through continuous monitoring and measurement of cooling, utilizing AI to visualize and detect deviations in cooling patterns, and establishing an interdisciplinary team. Additionally, the use of an actual case study in real- world setting further enhances the study’s applicability and significance, providing valuable insights for DC operators and decision-makers to address energy management challenges effectively.
2 Theoretical framework
2.1 Data centers and cooling
The foundation of DCs lies in the time-sharing technology of the 1960s (Saunavaara et al., 2022). During this era, the expense of a computer was distributed among users by allocating its time, leading to prompt responses from the computer to the commands of each user. Today, DCs play a pivotal role in coordinating various aspects of our lives, including transportation, healthcare, cloud computing, and information sharing (Geng, 2015). Servers, digital storage equipment, and network infrastructure are all housed within DCs to enable data processing, data storage and communications (Siddik et al., 2021). The rising need for data creation, data processing and storage, driven by both existing and established technologies, e.g., online platforms, interconnected infrastructure systems, AI, and autonomous transportation, has resulted in significant increase in computational demands and DC workloads (Masanet et al., 2020).
A typical DC infrastructure comprises various rooms, each designed for specific functions. Each DC room is equipped with racks that house hardware server units. These racks are capable to store IT equipment, such as servers or storage equipment, which can vary in size from single to multiple units based on the DCs particular function. Apart from IT equipment, the DC room’s infrastructure consists of cooling supply systems, as well as other equipment. Nearly all electrical power utilized by a DC is converter into heat, requiring the integration of a cooling system to effectively dissipate this thermal load (Capozzoli and Primicier, 2015). The predominant cooling method in DCs is air cooling using Computer Room Air Handlers (CRAHs), mainly for their applicational and operational ease (Moazamigoodarzi et al., 2019). However, the increase in DCs has given rise to issues related to inadequate cooling supply in the context of air cooling (Ebrahimi et al., 2014). In light of these challenges, cooling techniques using liquids, characterized by their better capability to transfer heat compared to air, have emerged (Greenberg et al., 2006; Wei et al., 2020). The heat transfer process from IT equipment within these cooling systems involves the use of dielectric liquid or water (American Society of Heating, 2006). Interestingly, Nadjahi et al. (2018) underscores liquid-based cooling systems as a strategy to enhance energy efficiency.
2.2 Energy management
As outlined in ISO 50006:2023 (Energy management systems—Evaluating energy performance using energy performance indicators and energy baselines), the assessment of energy performance serves as a valuable tool for analyzing the outcomes of energy management (ISO 50006, 2023). This is accomplished through the evaluation of analyzing energy baselines (EnBs) and Energy Performance Indicators (EnPIs), providing a comprehensive understanding of energy consumption across the organization, encompassing, e.g., equipment and various processes. Moreover, energy performance improvements within an organization have the potential to enhance competitiveness and contribute to decarbonization (ISO 50006, 2023). Even if there is no planned improvement in energy performance, the determination of EnBs and EnPIs has other benefits, such as managing operational control, identifying maintenance needs, and pinpointing deviations in energy performance. Another important aspect in enhancing energy performance and energy management involves gaining insights into the dynamic energy usage of various components within organizations, such as systems and processes, as well as factors that impact energy performance (ISO 50006, 2023). This is made possible through quantitative values or measures of cooling characteristics, such as chilled water flow rate and LCP return air temperature, in the context of DCs. However, it is important to be aware that challenges exist with determining quantitative values of these characteristics. This encompasses a lack of data on relevant variables, poor data quality, and the lack of ongoing monitoring and collection of data.
Adaptable energy management is important within the context of DC due to the operational differences between each facility (Guitart, 2017). In this pursuit, the OODA loop, see Figure 1, can serve as a structured framework for quickly observing changes, orienting to the new situation, make decisions on a course of action, and ultimately, act. Hence, this allows for energy management strategies that are continuously adapted based on real-time data. Colonel John Boyd designed the OODA loop in the 1970s, creating it as a decision tool for in-combat use by the U.S. Air Force (Osinga, 2005; Richards, 2011). The acronym OODA represents Observation, Orientation, Decision, and Action. Observation involves sensing oneself and the surrounding environment. Orientation encompasses contextualization of the observations. During the decision step, alternative courses of action are reviewed, and the preferred course is then selected. Lastly, the selected decision is tested through implementation. A key feature of the OODA loop is its potential to stimulate creativity and innovation across organizational domains, strategically aligned with the fulfillment of objectives (Richards, 2011), such as energy management. As stated by Richards (Richards, 2011), successful implementation of the OODA loop necessitates adapting to organizational practices and their unique landscape.
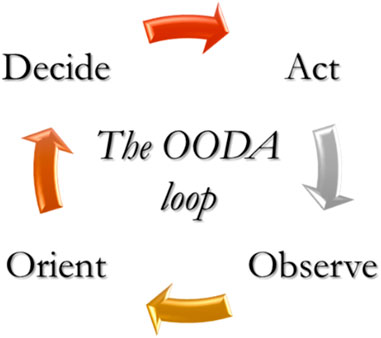
Figure 1. Schematic of the OODA loop.
2.3 AI for improving energy efficiency
In the scientific community, the 2020s witnessed a notable increase in research papers on AI (Fox and Griffy-Brown, 2022). Today, AI has a substantial impact on various aspects of society and is expected to fundamentally transform organizations and society (Kaplan and Haenlein, 2019). Considering the intricate nature of DCs, there is an interest in exploring how AI may contribute to improving energy efficiency (Liu et al., 2022). However, Liu et al. (2022) emphasizes that research on AI-driven improvements in cooling performance in DCs is at an early stage. This demonstrates the value of this research, alongside the inclusion of an interdisciplinary team utilizing phronesis, episteme, and techne to develop a holistic framework for energy management in DCs.
The main objective of the data mining process is to derive valuable and concrete knowledge and information from gathered data (Abualigah, 2019). Clustering is an unsupervised AI technique used to divide a set of data into categories of similar characteristics (Kogan et al., 2006; Han et al., 2012). Essentially, clustering facilitates concise summaries of large datasets with numerous attributes (Kogan et al., 2006). Within the realm of AI, unsupervised learning algorithms like clustering have the capability to detect patterns in data without the need for labeled data, in contrast to supervised learning methods, which require labeled data for training. Clustering algorithms have previously been employed across different fields, including energy efficiency within the building sector (Sun and Yu, 2021; Okereke et al., 2023), assessing energy efficiency in various industries (Liu et al., 2018; Howard et al., 2023), and classification of medical data within the healthcare sector (Yang et al., 2024; Awad et al., 2023).
Within DCs, clustering can be employed to identify and analyze diverse cooling operational patterns (Milić et al., 2023), offering valuable insights into energy management aspects. The primary data clustering techniques can be categorized into partitioning techniques, hierarchical techniques, density-based techniques, and grid-based techniques (Han et al., 2012). In the landscape of data clustering techniques, partitioning techniques are acknowledged as the most fundamental methods. One of the most widely utilized and established partitioning methods is K-means (Ikotun et al., 2023), and was proposed in the 1950s and 1960s by various scholars (Pérez-Ortega et al., 2019). The algorithm functions with the selection of K random objects as initial cluster centers. It then proceeds to allocate each remaining object to the nearest center, using Euclidean distance to enable comparison of similarities between data points. Following this, the algorithm iteratively enhances the within-cluster variation by repeatedly calculating the clusters’ mean and reallocating the data points until reaching convergence, at which point no data points are allocated to another cluster. An overview of the K-means clustering approach can be seen in Figure 2.

Figure 2. The K-means clustering approach: (A) visualizing the initial clustering, (B) the iteration process, and (C) the final clustering. Visualization inspired by (Han et al., 2012).
In K-means, the objective is to minimize the within-cluster sum of squares (WCSS), as can be seen in Equation 1. Here, k denotes the predetermined number of clusters, p refers to a data point which is assigned to cluster i, ci corresponds to the cluster center of cluster Ci, which is the estimated mean vector, and the squared Euclidean distance between p and ci is referred to as dist (p, ci). Moreover, the optimal number of clusters in K-means can be determined using the elbow method in which the “elbow point” is identified, i.e., adding more clusters does significantly decrease the WCSS. This method is based on a visualization of the relationship between WCSS and different values of K, as visualized in Figure 3. The elbow point indicates an optimal number of clusters, achieving a balance between enhancing data fit, i.e., the similarity between data points within each cluster, and maintaining model simplicity. Disadvantages of the elbow method include the subjective identification of the elbow point, as well as the possible lack of a well-defined one.
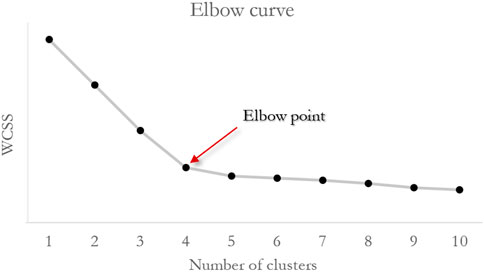
Figure 3. Elbow curve visualizing the relationship between WCSS and the number of clusters.
3 Description of framework
3.1 Framework architecture
The framework’s architecture is designed to integrate AI techniques, enabling both real-time and predictive analyses to enhance energy efficiency, all based on the foundation of the OODA loop. It leverages extensive datasets collected from the DC’s building management system across two distinct time periods, allowing for a comprehensive understanding of cooling energy usage patterns, and deviating cooling characteristics where attention from operators is needed. The architecture outlines the flow of data through the four phases of the OODA loop, detailing the methods employed at each phase to ensure effective, data-driven decision making for energy management. The developed framework, which resembles an extended OODA loop, includes three sub-loops, namely: (i) Continuous monitoring and measurement, (ii) Determination of cooling characteristics to analyze, and (iii) and Selection and adoption of a suitable AI method, as visualized in Figure 4. The blue-colored shapes represent sub-loop (i), the yellow-colored shapes represent sub-loop (ii), and the green-colored shapes represent sub-loop (iii).
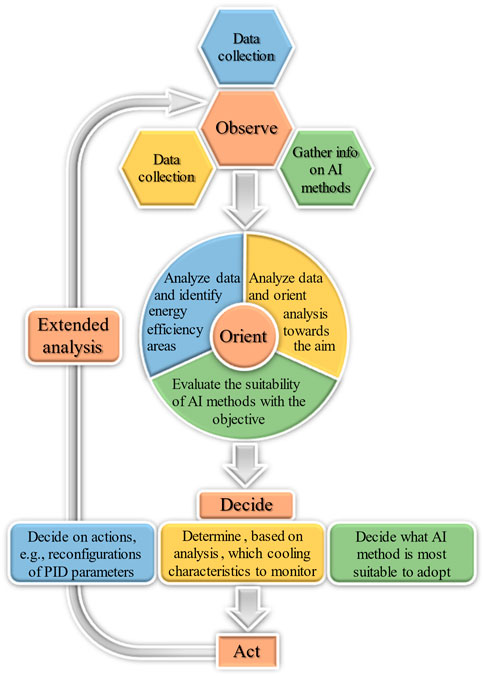
Figure 4. Proposed framework for next-generation DC energy management, consisting of three sub-loops. Blue-colored shapes = continuous monitoring and measurement, yellow-marked shapes = determination of cooling characteristics, and green-marked shapes = selection and adoption of suitable AI method.
3.2 Observation
Digital technologies are important tools for efficiently collecting and analyzing data (International Energy Agency, 2020). Using sensors for measurements and subsequently collecting digital data provides support for the Observation phase of the OODA loop. It is important to note that this method of data collection necessitates appropriate metering tools and may involve a time-intensive process. The data collection process constitutes the Observation phase for sub-loops (i) and (ii). The Observation phase of the third sub-loop, (iii), involves screening available AI methods and evaluating their respective strengths and downsides.
3.3 Orientation
Utilizing the data generated from the Observation phase, both the information gathered from data collection and the screening of AI methods are analyzed. Ideally, the Orientation phase involves interdisciplinary teams, enabling the practical application of knowledge creation in real-world settings, as highlighted in Industry 5.0 by the European Commission (European Commission, 2022). Hence, individuals possessing knowledge in both practical and theoretical domains are necessary to appropriately align with the goals of the diverse sub-loops. In sub-loops (i) and (ii), potential areas for energy efficiency, such as the reconfiguration of PID parameters, and key areas for determining cooling patterns are evaluated, respectively. Sub-loop (iii) involves evaluating how the studied AI methods align with the analysis objective.
3.4 Decision
In the Decide phase, decisions are made regarding the specific actions to be taken for the sub-loops. During this phase, it's essential to engage experts from various disciplines to mitigate potential challenges when implementing the new concept (Thollander and Palm, 2023). In sub-loop (i), actions such as changes in PID parameters are implemented, and their effects on cooling characteristics are monitored. Sub-loop (ii) involves deciding what specific cooling characteristics are to be monitored and measured, e.g., DC power density. In sub-loop (iii), the most suitable AI method, based on effectiveness and feasibility, is selected for adoption.
3.5 Action
Within the Action phase of the OODA loop for DC energy management, actions for (i) Continuous monitoring and measurement, (ii) Determination of cooling characteristics, and (iii) Selection and adoption of a suitable AI method are implemented based on decisions made in the previous phase. For example, this involves continual assessment of various parameters related to cooling patterns (sub-loops (i) and (ii)), which allows for internal benchmarking of EnPIs.
3.6 Extended analysis
The final phase of the proposed framework includes an extensive analysis of the insights and learnings obtained from each of the three sub-loops. Consequently, insights from one sub-loop may lead to changes or developments in another sub-loop. For instance, the synergy between sub-loops (i) Continuous monitoring and measurement and (ii) Determination of cooling characteristics can result in the installation of additional sensors to enable the quantification of other DC cooling characteristics. An important benefit of the extended OODA loop involves the ongoing analysis of the attributes of the DC system, with potential actions taken in response to modifications in operational characteristics and gathering of new information.
4 Research object
In this research, a DC room located in Linköping, Sweden, and operated by the multinational networking and telecommunications company Ericsson AB is investigated. The designed decision-making framework is the outcome of an interdisciplinary research collaboration involving academia, Ericsson, facility management company COOR, and municipally owned company Tekniska Verken AB.
With the support of facility management consultants, digital data describing energy flows in the Ericsson DC room has been gathered from building management systems during two different time periods. The first data collection was conducted from 2021–01–01 to 2021–11–10, and the second data collection spanned from 2021–12–31 to 2022–12–31, with a time interval of 5 minutes. In total, the first data collection consisted of more than 90,000 data points, while the second encompassed over 105,000 data points. For both investigated time periods, data on energy flows for 21 Liquid cooling package (LCP) units were gathered. The 21 LCP units are distributed among three server rows, with each row comprising seven units, as visualized in Figure 5. In total, the server area measures 34 m2. Moreover, a summary of the collected parameters within the dataset can be seen in Table 1. It is important to mention that data and information irrelevant to the cooling characteristics of the LCP units are removed from the collected dataset. This process also involves removing outliers, identified through visualization. Consequently, any information that does not align with the research objectives is excluded from the analysis, enabling the effective use of the chosen AI-powered algorithm.

Figure 5. Visualization of the studied DC room, which includes three rows of servers and 21 LCPs in total.
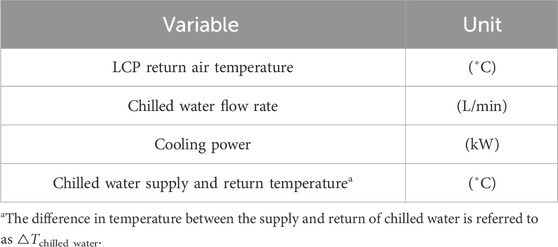
Table 1. Collected parameters for the LCP units.
It is important to note that continuously gathering data on energy flows for two different time periods enables the monitoring of changes in energy characteristics within an organization. Hence, valuable information for diagnosing potential inefficiencies in the LCP units can be provided. Another benefit of monitoring and measuring energy characteristics includes the possibility to perform internal benchmarking. In fact, the significance of quantifying metrics to improve energy performance has been underscored in previous scientific investigations, e.g., (Bunse et al., 2011; May et al., 2013).
5 Results and discussion
5.1 Sub-loop (i): Continuous monitoring and measurement
As stated in section 4, data were collected for two time periods: from 1 January 2021, to 10 November 2021, and from 31 December 2021, to 31 December 2022. Figure 6 shows the power used for cooling, servers, and auxiliary systems2 per square meter (at the top), along with a comparison of the absolute differences between the first and second data collections (at the bottom). The average cooling power density for the first data collection is 7.23 kW/m2, the average electricity supply for servers is 7.14 kW/m2, and the average electricity supply for auxiliary systems is 0.59 kW/m2. The corresponding figures for the second data collection are 9.09 kW/m2, 8.93 kW/m2, and 0.37 kW/m2, respectively. As displayed in Figure 6, the first data collection shows increasing power densities from the beginning to the end of the analyzed time period. In-depth analysis of the data set reveals that several LCP units were non-operational during the initial part of the first time period. Consequently, this results in substantial differences in the power densities measured between the two time periods. Moreover, the large variation in power densities between the two data sets is also evident when investigating the interquartile range. For example, the interquartile range for cooling power density is more than seven times larger in the first time period (2.68 kW/m2) compared to the second time period (0.37 kW/m2). However, as shown at the bottom of Figure 6, the absolute differences in power densities between the two time periods decrease significantly when comparing the end of 2021 and 2022.

Figure 6. Displayed at the top are power densities for cooling LCP units, power for servers, and power for auxiliary systems, with the bottom presenting a comparison between the first and second data collection in terms of absolute differences in kW/m2. The blue line represents the cooling, the red line indicates the server power, and the green line shows the auxiliary systems.
5.2 Sub-loop (ii): Determination of cooling characteristics
The determination of cooling characteristics to analyze directly depends on the parameters collected for the LCP units. As presented in Table 1, the cooling parameters collected in this research include LCP return air temperature (˚C), chilled water flow rate (L/min), LCP cooling power (kW), and the temperatures of the chilled water supply and return (˚C).
Building on the data collected the cooling characteristics selected for analysis within the OODA loop, specifically in the Decide phase, are based on these measurements. Specifically, the ΔTchilled water, which is the temperature difference between the chilled water supply and return, is analyzed as a cooling characteristic, alongside the LCP return air temperature, chilled water flow rate, and LCP cooling power. This comprehensive approach allows for a detailed assessment of the LCP systems’ cooling characteristics. Additionally, the data facilitate the exploration of potential reconfigurations of PID parameters, which could further improve the cooling of server units. Identifying key areas for determining cooling patterns not only enhances system performance but can also be used as decision support in predicting maintenance strategies. By analyzing the collected data, responsible personnel can detect suboptimal performance trends. This analysis aids in identifying potential issues before they become severe, allowing for timely interventions before server units are affected by issues such as insufficient cooling supply. This strategic approach not only improves system reliability and efficiency but also supports maintenance decisions, ensuring stable server operations.
5.3 Sub-loop (iii): Selection and adoption of suitable AI method
The selected and adopted AI method within the OODA loop in this research is the K-means algorithm. The choice of K-means is based on its time-efficient implementation, ability to handle large datasets, and visualization capabilities that facilitate interpretative analysis of the clustering results. Data normalization was performed before applying the K-means algorithm to avoid problems arising from variations in magnitudes of the cooling parameters. It is important to note that while it is possible to use other AI methods within the framework, analyzing AI methods against each other is outside the scope of this research. Instead, the focus is on developing a comprehensive framework that incorporates AI as a key component.
The Decide phase of the OODA loop in this framework centers on the selection of a suitable AI method, in this case, K-means. As mentioned above, this decision was driven by its effectiveness in clustering and identifying LCP operational patterns, which are crucial for identifying deviating cooling characteristics where action is needed to reconfigure PID parameters. By integrating K-means into the OODA loop, the framework ensures that data-driven decisions can support actionable improvements in DC operations.
5.3.1 Identifying optimal number of clusters with elbow curves
Figure 7 depicts elbow curves for the two investigated time periods: 2021–01–01 to 2021–11–10 and 2021–12–31 to 2022–12–31. Interestingly, the optimal number of clusters are four in the first data collection time period and three in the second data collection time period. This clearly demonstrates how different time periods influence the optimal number of clusters in a dataset, which is attributed to the varying cooling characteristics between the two time periods, as shown in section 5.1. Moreover, emphasizing that the identification of the elbow point relies on subjective assessment of the elbow curve is important, as interpreting the results may be challenging without a distinct elbow point. In this research, the analysis related to the determination of the number of clusters was considered satisfactory as both time periods investigated displayed relatively clear break points, thus facilitating a detailed characterization of LCP cooling parameters across both datasets. Additionally, an increase in the number of clusters from four to five in the initial data collection corresponds to only a 27% decrease in WCSS, compared to a 60% decrease when comparing four clusters to three clusters. The corresponding figures for the second data collection are 21% and 48%, respectively. Hence, the marginal improvements in WCSS support the selection of four clusters for the first data collection period and three for the second. This analysis justifies the use of K-means in the proposed research as it effectively identifies optimal cluster numbers, ensuring meaningful data segmentation.
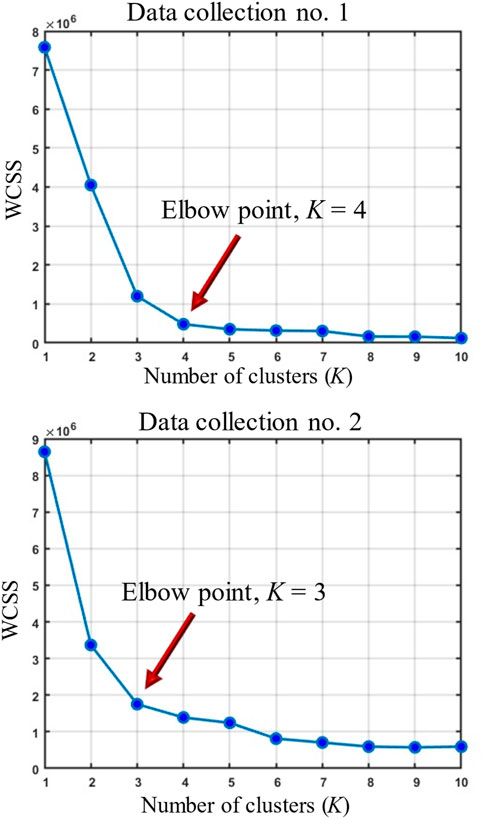
Figure 7. Elbow curves for the first data collection time period, 2021–01–01 to 2021–11–10, and the second data collection time period, 2021–12–31, to 2022–12–31.
5.3.2 Quantification of cooling characteristics using AI-powered clustering
As previously stated, the optimal number of clusters was four in the first data collection and three in the second data collection. Figure 8 shows the clustering results for the investigated cooling parameters for both data collection time periods.
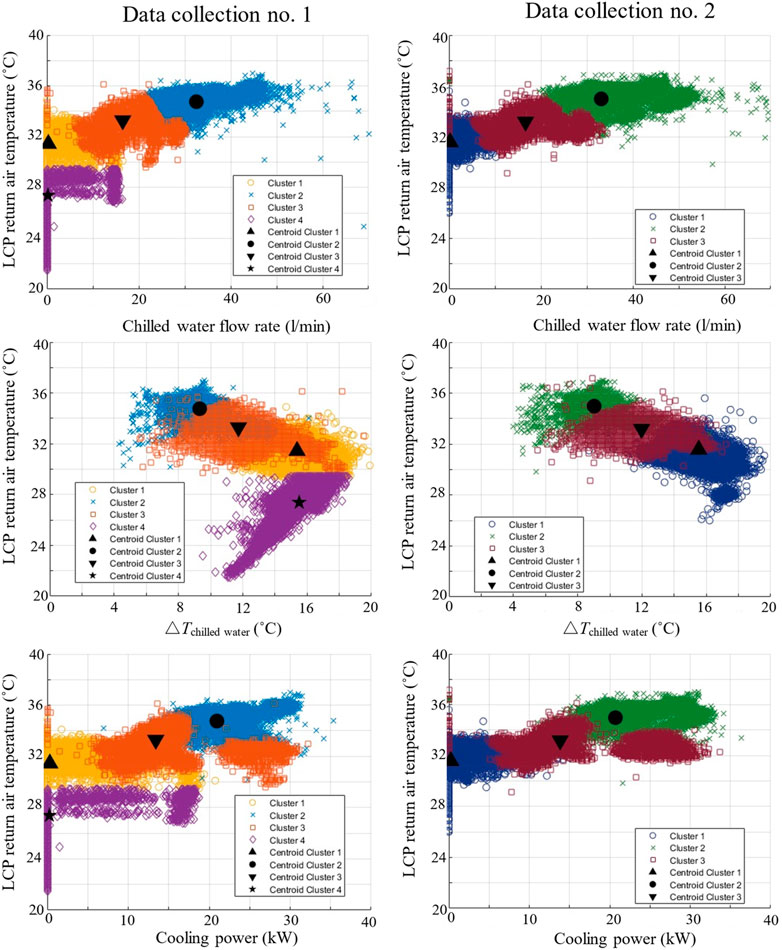
Figure 8. Clustering results of LCP return air temperature with chilled water flow rate, ΔTchilled water, and cooling power, from top to bottom. Data collections are from 2021–01–01 to 2021–11–10 (left), and 2021–12–3, to 2022–12–31 (right). For data collection no. 1, Cluster one is represented by yellow shapes, Cluster two by blue shapes, Cluster three by orange shapes, and Cluster four by purple shapes; for data collection no. 2, Cluster one is represented by dark blue shapes, Cluster two by green shapes, and Cluster three by maroon shapes.
The data from the first data collection, featuring four clusters, reveals median values for each cluster. In Cluster 1, the median LCP return air temperature is 31.4°C, with a chilled water flow rate of 0.31 L/min, a ΔTchilled water of 15.4°C, and a cooling power of 0.32 kW. In Cluster 2, the median values are 34.8°C for LCP return air temperature, 32.53 L/min for chilled water flow rate, 9.3°C for ΔTchilled water and 21.0 kW for cooling power. Cluster three shows median values of 33.3°C for LCP return air temperature, 16.50 L/min for chilled water flow rate, 11.7 ΔTchilled water, and 13.4 for cooling power. Lastly, Cluster four displays median values of 27.4°C for LCP return air temperature, 0.22 L/min for chilled water flow rate, 15.5 (˚C) for ΔTchilled water, and 0.26 kW for cooling power.
In contrast, the second time period reveals three clusters with their respective median values. For Cluster 1, the median LCP return air temperature is 31.6°C, the chilled water flow rate is 0.25 L/min, the ΔTchilled water is 15.53°C, and the cooling power is 0.25 kW. Cluster two demonstrates a median LCP return air temperature of 34.8°C, a chilled water flow rate of 32.53 L/min, a ΔTchilled water of 9.32°C, and a cooling power of 21.0 kW. Cluster three represents another distinct operational status in the LCP units, possibly necessitating different considerations for energy-efficient cooling operation, with median values of 33.3°C for LCP return air temperature, 16.50 L/min for chilled water flow rate, 11.7°C for ΔTchilled water, and 13.4 kW for cooling power.
The clustering results are important related to analysis of the energy efficiency of LCP units and to provide insights concerning fine-tuning PID parameters to improve cooling performance of LCP units. For example, from an energy efficiency perspective, it is important to have a high ΔTchilled water. Additionally, elevated LCP return air temperatures may suggest insufficient cooling supply to the servers. These findings are important as decision support for the Decide phase in the OODA loop, ultimately providing data that can be used to reconfigure PID parameters. Consequently, actions on PID reconfiguration can be taken to help reduce the risk of system downtime and increase equipment lifespan. In the context of DC energy management, the results connected to cooling attributes, such as ΔTchilled water, provide a comprehensive overview of the cooling system’s efficacy. By integrating these attributes into broader metrics like PUE and cooling power density, operators and owners of DCs gain insights to enhance cooling strategies and adjust PID parameters through digital monitoring and data analysis. This allows for informed follow-up procedures to improve overall cooling performance. Moreover, the use of clustering techniques has been used in other scientific investigations. Interestingly, (Grishina et al., 2020) applied clustering techniques to detect individual servers that often occur in overheated locations within a DC room. The authors also emphasize that the developed approach can be applied to analyze thermal characteristics in any air-cooled DC with a thermal monitoring system. In this context, it is important to mention that the framework developed in this research also depends on continuous monitoring and data collection from building management systems. Another example of using clustering techniques to analyze DCs includes the work by (Daradkeh et al., 2020) who presented a method for clustering workloads and configurations in DCs. A key result involved investigating workload types based on related jobs performed, server type, and other factors. Although research on utilizing clustering techniques exists, as presented above, there are insufficient scientific investigations on AI methods for enhancing cooling performance in DCs, as stated by (Liu et al., 2022). To the best of the author’s knowledge, this is particularly the case for clustering techniques such as K-means.
5.4 Extended OODA loop and consequences for policy frameworks
The developed framework uses advanced AI techniques to enhance energy efficiency within DCs. Rooted in the OODA (Observe, Orient, Decide, Act) loop, originally developed for military strategy, this architecture leverages extensive datasets from Ericsson DCs’ building management systems collected over distinct time periods. These datasets provide crucial insights into cooling energy usage patterns, highlighting deviations necessitating operator attention.
Aligned with policy frameworks, this framework addresses key policy objectives related to energy efficiency and environmental sustainability. By continuously monitoring and measuring real-time data, the framework supports compliance with regulatory standards and benchmarks for energy use in DCs. This not only ensures adherence to environmental policies but also facilitates reporting requirements, supporting transparency and accountability. Moreover, the adoption of AI methods underscores a proactive approach to enhance cooling efficiency and achieve energy management goals. This includes fine-tuning PID parameters based on AI-powered insights, ensuring continuous improvement in cooling system performance. In the Decide phase of the OODA loop, key decisions can be made, such as installing additional sensors to gain a more comprehensive understanding of cooling characteristics. Additionally, the interactive nature of the OODA loop may lead to the adoption of new AI algorithms as they become available, allowing the framework to evolve and incorporate more advanced techniques for even greater efficiency in DC operations. Such actions not only bolster operational efficiency but also position DCs as leaders in sustainable practices, fostering a conducive environment for policy innovation and adaptation.
The framework’s scalability across different DC environments hinges on consistent data monitoring and collection practices. This scalability is pivotal for its integration into diverse policy contexts and regulatory frameworks. By standardizing cooling data metrics and analytical methodologies, the framework facilitates comparability and benchmarking across facilities, supporting broader policy initiatives aimed at sector-wide energy efficiency improvements. In conclusion, the extended OODA loop framework represents a structured approach to data-driven decision-making in DC energy management. Its alignment with policy frameworks not only supports regulatory compliance and environmental stewardship but also catalyzes innovation and adaptation within the sector. By leveraging AI techniques and comprehensive data analysis, DC operators can proactively address evolving policy requirements, contributing to sustainable development goals and enhancing resilience in the face of future regulatory changes.
6 Conclusion and future research
This research seeks to extend the current understanding of data-driven energy management in DCs, providing a foundation for advancements in practices that foster a more sustainable and energy-efficient digital infrastructure. By analyzing collected cooling data over two distinct time periods (1 January 2021, to 10 November 2021, and 31 December 2021, to 31 December 2022), insights into energy usage trends have been uncovered. The observed increase in power densities from the beginning to the end of the first time period underscores the importance of continuous monitoring and adaptive management strategies. Additionally, the application of AI techniques, such as K-means clustering in this research, has proven instrumental in identifying optimal clusters and providing insights into fine-tuning PID parameters to enhance cooling system efficiency. Moreover, the clustering offers a detailed analysis of LCP return air temperature, chilled water flow rate, ΔTchilled water, and cooling power across both time periods. This quantitative approach not only enhances understanding of cooling system performance but also supports informed decision-making aimed at improving overall operational efficiency.
Aligned with the extended OODA loop framework, the research emphasizes the integration of extensive datasets from Ericsson DCs’ building management systems. These datasets provide crucial insights into cooling energy usage patterns, guiding policy frameworks towards enhanced energy efficiency within DC environments. By leveraging AI-powered insights, DC operators can effectively navigate regulatory landscapes and contribute to sustainable development goals.
In conclusion, this study demonstrates that a data-driven approach rooted in the OODA loop framework is important for advancing energy management practices in DCs. By harnessing technological innovations and comprehensive data analysis, DCs can not only enhance operational performance but also lead the way in environmental stewardship and policy adaptation within the digital infrastructure.
In future work, it is of interest to expand the scope of this study to include a broader range of DC environments. This includes investigating the application of AI techniques, such as K-means clustering, in other DCs with varying infrastructure and cooling technologies. Since this study analyzed a DC room cooled by LCPs, it would be of interest to apply the developed framework to DCs utilizing CRAH units. By comparing the performance of the developed framework across different cooling systems, valuable insights can be gained into its adaptability. Such a comparison will help identify specific challenges, such as gaps in data monitoring, and opportunities unique to each DC infrastructure. This process will refine the framework to accommodate diverse operational conditions and enhance its applicability across various DC environments. Additionally, future development of the framework will include analysis of the impact of cooling technology on overall primary energy use and CO2 emissions, including improvements in cooling performance such as fine-tuning PID parameters. By evaluating the effects of enhanced cooling strategies, future studies can provide comprehensive guidance on achieving sustainability targets in the DC sector.
Data availability statement
The datasets presented in this article are not readily available because only the presented data is available, due to restrictions from Ericsson. Requests to access the datasets should be directed todmxhdGtvLm1pbGljQGxpdS5zZQ==.
Author contributions
VM: Conceptualization, Data curation, Formal Analysis, Investigation, Methodology, Validation, Visualization, Writing–original draft, Writing–review and editing.
Funding
The author(s) declare that financial support was received for the research, authorship, and/or publication of this article. The author would like to express his gratitude to the Swedish Energy Agency for their financial support (grant number P2020-90010).
Acknowledgments
The author expresses gratitude to Hans Liedman and Oskar Kollserud from COOR, a facility management company, for their input during the project. Additionally, I would like to thank Jim Enkel, Johan Granhagen and Thomas Gotenstam from Ericsson, and Mile Elez from the energy company Tekniska Verken AB, for their valuable feedback. Furthermore, the author acknowledges the insights and recommendations provided by Maria Andersson, Patrik Thollander, and Bahram Moshfegh from Linköping University. Lastly, the author would like to express his gratitude to the Swedish Energy Agency for their financial support (grant number 50227-1).
Conflict of interest
The author declares that the research was conducted in the absence of any commercial or financial relationships that could be construed as a potential conflict of interest.
Publisher’s note
All claims expressed in this article are solely those of the authors and do not necessarily represent those of their affiliated organizations, or those of the publisher, the editors and the reviewers. Any product that may be evaluated in this article, or claim that may be made by its manufacturer, is not guaranteed or endorsed by the publisher.
Footnotes
1The figures provided do not include energy use related to cryptocurrency mining, which was approximately 110 TWh in 2022.
2Auxiliary systems refer to processes that are not connected to cooling or the electricity supply to servers, such as lighting.
References
Abualigah, L., Feature selection and enhanced Krill herd algorithm for text document clustering. 2019.
Alowais, S., Alghamdi, S. S., Alsuhebany, N., Alqahtani, T., Alshaya, A. I., Almohareb, S. N., et al. (2023). Revolutionizing healthcare: the role of artificial intelligence in clinical practice. BMS Med. Educ. 23, 689. doi:10.1186/s12909-023-04698-z
American Society of Heating (2006). Refrigerating and Air-Conditioning Engineers, Liquid cooling guidelines for datacom equipment centers. ASHRAE datacom Ser.
Andrae, A. S. G. (2017). “Total consumer power consumption forecast,” in Presented at the the nordic digital business summit. Helsinki: Finland.
Awad, F., Hamad, M., and Alzubadi, L. (2023). Robust classification and detection of big medical data using advanced parallel K-means clustering, YOLOv4, and logistic regression. Life 13 (3), 691. doi:10.3390/life13030691
Bunse, K., Vodicka, M., Schönsleben, P., Brülhart, M., and Ernst, F., Integrating energy efficiency performance in production management – gap analysis between industrial needs and scientific literature industrial needs and scientific literature. J. Clean. Prod., vol. 19, pp. 667–679. doi:10.1016/j.jclepro.2010.11.0112011
Capozzoli, A., and Primicier, G. (2015). “Cooling systems in data centers: state of art and emerging technologies,” in Presented at the 7th international conference on sustainability in energy and buildings.
Clean Energy Institute (2024). Data center energy management. Available at: https://www.cei.washington.edu/research/energy-systems/data-center-energy-management/.
Daradkeh, T., Agarwal, A., Zaman, M., and Goel, N. (2020). Dynamic K-means clustering of workload and cloud resource configuration for cloud elastic model. IEEE Access 8, 219430–219446. doi:10.1109/access.2020.3042716
Ebrahimi, K., Jones, G. F., and Fleischer, A. S. (2014). A review of data center cooling technology, operating conditions and the corresponding low-grade waste heat recovery opportunities. Renew. Sustain. Energy Rev. 31, 622–638. doi:10.1016/j.rser.2013.12.007
Fox, S., and Griffy-Brown, C. (2022). Artificial intelligence in society: technology in society briefing. Technol. Soc. 71, 102130. doi:10.1016/j.techsoc.2022.102130
Grand View Research (2030). Data center market size, share and growth report. Available at: https://www.grandviewresearch.com/industry-analysis/data-center-market-report.
Greenberg, S., Mill, E., Tschudi, B., Rumsey, P., and Myatt, B. (2006). “Best practices for data centers: lessons learned from benchmarking 22 data centers,” in Presented at the Proceedings of 14th. CA, USA: ACEEE summer study on energy efficiency in buildings.
Grishina, A., Chinnici, M., Kor, A., Rondeau, E., and Georges, E. (2020). A machine learning solution for data center thermal characteristics analysis. Energies 13 (4378), 4378. doi:10.3390/en13174378
Guitart, J. (2017). Toward sustainable data centers: a comprehensive energy management strategy. Computing 99, 597–615. doi:10.1007/s00607-016-0501-1
Gupta, R., Asgari, S., Moazamigoodarzi, H., Down, D., and Puri, I. K. (2021). Energy, exergy and computing efficiency based data center workload and cooling management. Appl. Energy 299, 117050. doi:10.1016/j.apenergy.2021.117050
Gupta, R., Moazamigoodarzi, H., Nejad, S., Down, D., and Puri, I. K. (2020). Workload management for air-cooled data centers: an energy and exergy based approach. Energy 209, 118485. doi:10.1016/j.energy.2020.118485
Howard, D., Jørgensen, B., and Ma, Z. (2023). Identifying best practice melting patterns in induction furnaces: a data-driven approach using time series K-means clustering and multi-criteria decision making, presented at the energy informatics. EI.A 2023. Lect. Notes Comput. Sci. doi:10.48550/arXiv.2401.04751
IEA (2017). Digitalization and energy. Paris 2017. Available at: https://www.iea.org/reports/digitalisation-and-energy.
Ikotun, A., Ezogwu, A., Abualigah, L., Abuhaija, B., and Heming, J. (2023). K-means clustering algorithms: a comprehensive review, variants analysis, and advances in the era of big data. Inf. Sci. 622, 178–210. doi:10.1016/j.ins.2022.11.139
International Energy Agency, Energy end-use data collection methodologies and the emerging role of digital technologies, 2020.
International Energy Agency (2023). Data centres and data transmission networks. Available at: https://www.iea.org/energy-system/buildings/data-centres-and-data-transmission-networks.
ISO 50006 (2023). Energy management systems - evaluating energy performance using energy performance indicators and energy baselines.
Jóczik, S., Zimborás, Z., Majoros, T., and Kiss, A. (2022). A cost-efficient approach towards computational fluid dynamics simulations on quantum devices. Appl. Sci. 12, 2873. doi:10.3390/app12062873
Kaplan, A., and Haenlein, M. (2019). Digital transformation and disruption: on big data, blockchain, artificial intelligence, and other things. Bus. Horizons 62, 679–681. doi:10.1016/j.bushor.2019.07.001
Kim, S., Kong, J., and Lee, S. (2021). Recent advances of artificial intelligence in manufacturing industrial sectors: a review. Int. J. Precis. Eng. Manuf. 23, 111–129. doi:10.1007/s12541-021-00600-3
Kogan, J., Nicholas, C., and Teboulle, M. (2006). “Grouping multidimensional data,” in Recent advances in clustering. Springer.
Lee, Y., Chen, K., Yan, W., Shih, Y., and Chao, C. (2023). Evaporative cooling method to improve energy management of overhead downward flow-type data center. Case Stud. Therm. Eng. 45, 102998. doi:10.1016/j.csite.2023.102998
Lim, S., and Chang, H. (2021). Airflow management analysis to suppress data center hot spots. Build. Environ. 197, 107843. doi:10.1016/j.buildenv.2021.107843
Liu, G., Yang, J., Hao, Y., and Zhang, Y. (2018). Big data-informed energy efficiency assessment of China industry sectors based on K-means clustering. J. Clean. Prod. 183, 304–314. doi:10.1016/j.jclepro.2018.02.129
Liu, H., Aljbri, A., Song, J., Jiang, L., and Hua, C. (2022). Research advances on AI-powered thermal management for data centers. Present. A. T. Tsinghua Sci. Technol. 27, 303–314. doi:10.26599/tst.2021.9010019
Liu, H. Y., Sun, X., Wang, Y., Chao, H., and Yan, F. (2023). Data center server workload and infrastructure control based on a joint RSM and CFD approach. J. Build. Eng. 77, 107431. doi:10.1016/j.jobe.2023.107431
Manaserh, Y., Tradat, M., Gharaibeh, A., Sammakia, B., and Tipton, R. (2021). Shifting to energy efficient hybrid cooled data centers using novel embedded floor tiles heat exchangers. Energy Convers. Manag. 247, 114762. doi:10.1016/j.enconman.2021.114762
Manaserh, Y., Tradat, M. I., Bani-Hani, D., Alfallah, A., Sammakia, B. G., Nemati, K., et al. (2022). Machine learning assisted development of IT equipment compact models for data centers energy planning. Appl. Energy 305, 117846. doi:10.1016/j.apenergy.2021.117846
Manganelli, M., Soldati, A., Martirano, L., and Ramakrishna, S.- (2021). Strategies for improving the sustainability of data centers via energy mix, energy conservation, and circular energy. Sustainability 13 (11), 6114. doi:10.3390/su13116114
Masanet, E., Shebabi, A., Lei, N., Smith, S., and Koomey, J. (2020). Recalibrating global data center energy-use estimates. Science 367 (6481), 984–986. doi:10.1126/science.aba3758
May, G., Taisch, M., Prabhu, V., and Barletta, I. (2013). Energy related key performance indicators – state of the art, gaps and industrial needs. Springer, 257–267.
Milić, V., Kåge, L., Andersson, M., Enkel, J., and Moshfegh, B. (2023). “AI-assisted characterization of cooling patterns in a water-cooled ICT room,” in Presented at the 2023 29th international workshop on thermal investigations of ICs and systems (THERMINIC). Budapest, Hungary.
Moazamigoodarzi, H., Peiyin, J. T., Pal, S., Ghosh, S., and Puri, I. K. (2019). Influence of cooling architecture on data center power consumption. Energy 183, 525–535. doi:10.1016/j.energy.2019.06.140
Nadjahi, C., Louahlia, H., and Lemasson, S. (2018). A review of thermal management and innovative cooling strategies for data center. Sustain. Comput. Inf. Syst. 19, 14–28. doi:10.1016/j.suscom.2018.05.002
Okereke, G., Bali, M., Okwueze, C., Ukekwe, E., Echezona, S., and Ugwu, C., K-means clustering of electricity consumers using time-domain features from smart meter data, J. Electr. Syst. Inf. Technol. volume, vol. 10, 2, doi:10.1186/s43067-023-00068-32023
Osinga, F. (2005). Science, strategy and war. The strategic theory of john Boyd. Leiden University: Eburon Academic Publishers. Doctoral thesis.
Panwar, S., Rauthan, M., and Bartwal, V. (2022). A systematic review on effective energy utilization management strategies in cloud data centers. J. Cloud Comput. 11, 95. doi:10.1186/s13677-022-00368-5
Pérez-Ortega, J., Almanza-Ortega, N., Vega-Villalobos, A., Pazos-Rangel, R., Zavala-Díaz, C., and Martínez-Rebollar, A. (2019). “The K-means algorithm evolution,” in Introduction to data science and machine learning (IntechOpen: IntechOpen).
Rolnick, D., and al, E. (2019). Tackling climate change with machine learning. arXiv Prepr. arXiv:1906.05433. doi:10.1145/3485128
Saunavaara, J., Laine, A., and Salo, M. (2022). The Nordic societies and the development of the data centre industry: digital transformation meets infrastructural and industrial inheritance. Technol. Soc. 69, 101931. doi:10.1016/j.techsoc.2022.101931
Schulze, M., Nehler, H., Ottosson, M., and Thollander, P. (2016). Energy management in industry – a systematic review of previous findings and an integrative conceptual framework. J. Clean. Prod. 112, 3692–3708. doi:10.1016/j.jclepro.2015.06.060
Senthilkumar, G., Rajendarn, P., Suresh, Y., Herald Anantha Rufus, N., Rama Chaithanya, T., and Rajdeep Singh, S. (2023). Computational engineering based approach on artificial intelligence and machine learning-driven robust data centre for safe management. J. Mach. Learn. Comput. 3, 465–474. doi:10.53759/7669/jmc202303038
Shao, X., Zhang, Z., Song, P., Feng, Y., and Wang, X. (2022). A review of energy efficiency evaluation metrics for data centers. Energy Build. 271, 112308. doi:10.1016/j.enbuild.2022.112308
Siddik, M. A. B., Shebabi, A., and Marston, L. (2021). The environmental footprint of data centers in the United States. Environ. Res. Lett. 16, 064017. doi:10.1088/1748-9326/abfba1
Sun, F., and Yu, J. (2021). Improved energy performance evaluating and ranking approach for office buildings using Simple-normalization, Entropy-based TOPSIS and K-means method. Energy Rep. 7, 1560–1570. doi:10.1016/j.egyr.2021.03.007
Thollander, P., and Ottosson, M. (2010). Energy management practices in Swedish energy-intensive industries. J. Clean. Prod. 18, 1125–1133. doi:10.1016/j.jclepro.2010.04.011
Thollander, P., and Palm, J. (2023). The unhinged paradox – what does it mean for the energy system? Adv. Appl. Energy 10, 100143. doi:10.1016/j.adapen.2023.100143
Wei, S., Qun, C., Kelun, H., and Mengqi, Z. (2020). Operation optimization of liquid cooling systems in data centers by the heat current method and artificial neural network. J. Therm. Sci. 29, 1063–1075. doi:10.1007/s11630-020-1283-5
Keywords: data center, energy management, AI, K-means, OODA loop, data-driven decision-making, framework
Citation: Milić V (2024) Next-generation data center energy management: a data-driven decision-making framework. Front. Energy Res. 12:1449358. doi: 10.3389/fenrg.2024.1449358
Received: 14 June 2024; Accepted: 30 August 2024;
Published: 10 September 2024.
Edited by:
A. S. M. Monjurul Hasan, University of Technology Sydney, AustraliaReviewed by:
Md Ahsan Kabir, Military Institute of Science and Technology (MIST), BangladeshRakib Hossain, University of Nevada, Reno, United States
Copyright © 2024 Milić. This is an open-access article distributed under the terms of the Creative Commons Attribution License (CC BY). The use, distribution or reproduction in other forums is permitted, provided the original author(s) and the copyright owner(s) are credited and that the original publication in this journal is cited, in accordance with accepted academic practice. No use, distribution or reproduction is permitted which does not comply with these terms.
*Correspondence: Vlatko Milić, dmxhdGtvLm1pbGljQGxpdS5zZQ==