 Jiarui Wang
 Xiu Ji
 Xiangdong Meng
 Yang Bai
 Meiyue Li
- 1State Grid Jilin Electric Power Co., Ltd., Changchun, China
- 2National Local Joint Engineering Research Center for Smart Distribution Grid Measurement and Control with Safety Operation Technology, Changchun Institute of Technology, Changchun, China
In the context of “dual carbon”, in order to promote the consumption of renewable energy and improve energy utilization efficiency, a low-carbon economic dispatch model of an integrated energy system containing carbon capture power plants and multiple utilization of hydrogen energy is proposed. First, introduce liquid storage tanks to transform traditional carbon capture power plants, and at the same time build a multi-functional hydrogen utilization structure including two-stage power-to-gas, hydrogen fuel cells, hydrogen storage tanks, and hydrogen-doped cogeneration to fully exploit hydrogen. It can utilize the potential of collaborative operation with carbon capture power plants; on this basis, consider the transferability and substitutability characteristics of electric heating gas load, and construct an electric heating gas comprehensive demand response model; secondly, consider the mutual recognition relationship between carbon quotas and green certificates, Propose a green certificate-carbon trading mechanism; finally establish an integrated energy system with the optimization goal of minimizing the sum of energy purchase cost, demand response compensation cost, wind curtailment cost, carbon storage cost, carbon purchase cost, carbon trading cost and green certificate trading compensation. Optimize scheduling model. The results show that the proposed model can effectively reduce the total system cost and carbon emissions, improve clean energy consumption and energy utilization, and has significant economical and low-carbon properties.
1 Introduction
“Under the dual-carbon background, building a clean, low-carbon, safe, efficient, and decentralized energy system has become the development direction of China’s future energy system construction (Sun et al., 2015). Compared with a single energy supply system, integrated energy system (IES) has to adapt to the rapid development of distributed energy and meet the needs of in terms of diversified energy use by users, it has significant advantages such as reliability, efficiency, economy, and environmental protection (He et al., 2020). On the one hand, since China will still be in a coal-dominated energy structure for a long time, it is necessary to consider how to promote the production and utilization of renewable energy and hydrogen energy. The coexistence of clean coal power generation promotes the coordinated development of high-carbon energy and low-carbon energy (Chen et al., 2021; Liu et al., 2023; Yang et al., 2018). On the other hand, the development of a high proportion of renewable energy has become an inevitable choice to achieve the “dual carbon” goal, and the renewable energy power consumption mechanism, carbon trading mechanism and The green certificate trading mechanism has become a key way to help achieve this goal (Liang et al., 2023). However, with the increase in the proportion of renewable energy, internal load fluctuations in IES have become a prominent problem, and demand response has a positive effect on reducing load fluctuations and alleviating system energy supply pressure (Liu et al., 2024). Therefore, it is crucial to explore low-carbon economic dispatch strategies for IES that consider demand response mechanisms and the coupling of power-to-gas and carbon capture (Xiliang et al., 2022).
The emergence of carbon capture technology provides a solution for clean coal-fired power generation. Traditional coal-fired power plants can be transformed into carbon capture power plants (CCPP) by introducing carbon capture devices. Existing literature has conducted a lot of research on the operation mechanism of carbon capture power plants. Faruque and Monzure-Khoda (2022) studied the basic model of carbon capture power plants, analyzed their internal energy flow, and pointed out that carbon capture power plants have good flexible operation characteristics. Liu et al. (2024) studied the typical operation mode of carbon capture power plants. The results showed that the liquid storage operation mode effectively expanded the operation range compared with the diversion operation mode. Many scholars have also studied the participation of carbon capture power plants in optimal scheduling. Tian et al. (2020) considered the joint operation of carbon capture power plants and wind power. The results showed that carbon capture power plants can reduce the impact of wind power fluctuations on system operation. Zhou et al. (2018) established a synergistic model of carbon capture power plants and power-to-gas (P2G). The results showed that the joint operation of the two can promote the consumption of new energy and realize carbon recycling. However, the above literature mostly considers the diversion mode and less considers the impact of liquid storage devices on system operation. Chen et al. (2012) points out that there is a coupling phenomenon between carbon absorption and renewable links in split-flow carbon capture power plants. The introduction of liquid storage devices can transform them and jointly dispatch them with wind power, greatly improving the level of wind power consumption. Wang et al. (2022) proposed a liquid storage carbon capture-power-to-gas-combined heat and power (CHP) synergistic operation model, which achieved good low-carbon economic benefits. In general, existing studies have considered the operation mode of carbon capture power plants participating in the integrated energy system in a relatively simple way, and have not fully utilized their flexible operation advantages. In addition, they are mostly combined with power-to-gas with low energy efficiency, and have not considered the introduction of hydrogen energy to optimize the energy consumption link.
If the value of hydrogen energy utilization in the intermediate link of P2G can be fully explored, it will be beneficial to improve energy utilization efficiency and achieve energy supply substitution for traditional fossil energy (Rosen and Koohi-Fayegh, 2016). Hydrogen energy can be flexibly transferred through hydrogen storage equipment. When combined with hydrogen-using equipment, it will have great scheduling potential. Many scholars have studied the participation of hydrogen energy in system optimization scheduling (Arsad et al., 2022). Akarsu and Serdar Genç et al. (2022) uses renewable synergistic electrolyzer (EL) to produce hydrogen and realizes flexible consumption of wind and solar power. Liwei et al. (2022) conducts a detailed modeling of hydrogen storage tanks, refines power-to-gas into EL and methane reactors (MR), and cooperates with hydrogen fuel cells (HFC) to solve the problem of imbalance between supply and demand of the integrated energy system. Li et al. (2023) considers EL, hydrogen storage tanks, and gas-mixed hydrogen to construct an electric-hydrogen-heat multi-energy complementary system, which optimizes energy utilization efficiency while minimizing operating costs and wind abandonment. However, existing research mostly focuses on one or more hydrogen usage scenarios, and does not involve the full range of hydrogen production, storage and multi-use from EL, MR, hydrogen storage tanks (HES), hydrogen fuel cell (HFC) and hydrogen blending from natural gas. Hydrogen equipment is mostly scheduled with the goal of improving operating economy or renewable consumption rate, with less consideration given to carbon emission reduction targets, and the potential for coordinated operation with other energy supply equipment, especially carbon capture power plants, has not been fully explored.
Improving the level of renewable energy consumption is an important way to solve my country’s energy pollution (Cui et al., 2020a). The introduction of carbon emission trading (CET) and green certificate trading (GCT) provides a strong policy guarantee for the realization of the above two approaches. As one of the most effective measures to reduce carbon emissions, CET has been widely developed in the study of IES. Wei et al. (2016) introduced the CET mechanism into the IES scheduling model, comprehensively considered the carbon trading cost and system energy supply cost, and established a low-carbon economic scheduling model suitable for the combined heat and power system (Fang et al., 2019). combines the demand response mechanism of carbon capture power plants to further improve the level of wind power consumption (Li and Xu, 2019). established a combined model of electric to gas conversion and carbon capture, and the results showed that this model has advantages in improving system economy (Wang et al., 2020a; Wang et al., 2020b). proposes a low-carbon economic dispatch model for regional integrated energy systems based on a carbon trading green certificate joint trading mechanism, which includes cogeneration units, carbon capture, and electric to gas conversion equipment. Simulation results show that the model can effectively reduce the system’s carbon emissions. It proves that the model can effectively take into account environmental benefits and improve the total benefits of the IES.
Demand response can enhance the two-way interaction between the energy supply side and the energy consumption side, reduce the load fluctuation within the IES, and achieve the “peak shaving and valley filling” of the load curve (Zhang et al., 2022). Cui et al. (2020b) introduces a price elasticity matrix to describe the demand response behavior and analyzes the effectiveness of demand response in alleviating the peak load pressure of the system; Wang et al. (2021) adopts an incentive-based demand response to make the electric load within the dispatch cycle more matched with the wind and solar output, which can effectively improve the consumption of new energy. However, the types of demand response considered in existing literature are relatively single, and the coordinated optimization of demand response with energy supply equipment and CET-GCT mechanism is not fully considered, which cannot give full play to the green regulation capacity of the demand side (Xu et al., 2023).
In summary, based on the existing literature, this paper proposes a low-carbon economic dispatch method for IES that considers the coupling of power-to-gas-carbon capture power plants, the mutual recognition mechanism of carbon-green certificates, and flexible loads of electricity and heat. The main innovations of this paper are as follows:
1. Establish a flexible operation model of a carbon capture power plant considering liquid storage tanks and a diversified utilization structure of hydrogen energy to fully tap the flexible operation advantages and high-efficiency energy utilization potential of the system;
2. Consider the transferable, reducible, and replaceable characteristics of flexible loads of electricity and heat in the IES, and construct an electric-heat joint demand response model to reduce the internal load fluctuation of the IES;
3. Introduce a green certificate trading mechanism and a reward-and-punishment carbon trading mechanism, and explore the principle of joint trading between the two, and construct a CET-GCT joint trading mechanism considering carbon quotas and mutual recognition of green certificates;
4. Establish IES dispatch model with the minimum total cost as the optimization goal. The low-carbon economic benefits of the proposed model are verified through example simulation, and the impact of demand response mechanism, flexible operation characteristics of carbon capture power plants, diversified utilization benefits of hydrogen energy, and green certificate-carbon trading mechanism on the operation of the integrated energy system is explored.
2 IES with carbon capture power plant and multiple utilization of hydrogen energy
The framework of the IES proposed in this paper is shown in Figure 1. The system’s electrical load is provided by the upper power grid, CCPP, wind turbine, CHP and HFC, the thermal load is provided by CHP, GB and heat storage tank (HST), and the gas load is provided by P2G and purchased natural gas.
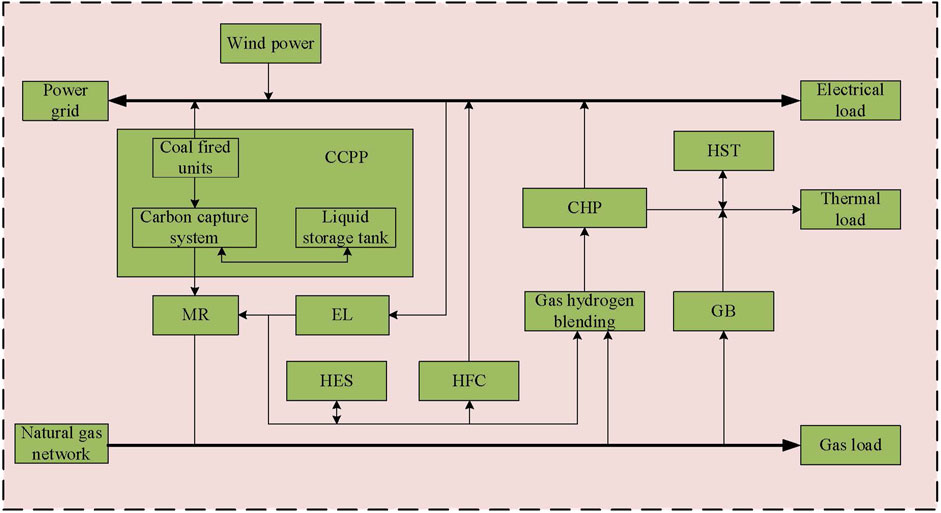
Figure 1. Structure diagram of IES.
2.1 Flexible operation model of CCPP
The typical carbon capture process includes three parts: carbon absorption, regeneration and compression. Due to physical structural limitations, the split-flow CCPP is coupled in the carbon absorption and regeneration stages. When the power supply demand is high, the coal-fired units generate more carbon. At this time, if the carbon absorption is increased, the energy consumption of the regeneration and compression stages will increase, resulting in a decrease in the net output level of the power plant, and it is impossible to take into account the carbon capture and power supply needs.
This paper makes a flexible transformation of the traditional CCPP by installing a group of liquid storage tanks (including one lean liquid tank and one rich liquid tank) between the absorption tower and the regeneration tower. The liquid storage tanks are used to balance the amount of solution entering and leaving the absorption tower and the regeneration tower. The amount of carbon processed by the regeneration tower no longer needs to match the amount of carbon absorbed by the absorption tower.
The flexible operation model of the CCPP is shown in Formula 1. Among them, the carbon capture energy consumption consists of basic energy consumption and operating energy consumption. The basic energy consumption does not change with the carbon capture state and is regarded as a constant value; the operating energy consumption is approximately proportional to the amount of CO2 that needs to be processed by the regeneration tower. In this paper, the amount of CO2 after the regeneration process is completed is defined as the actual CO2 capture amount.
Where:
The mathematical model of the liquid storage tank is shown in Equation 2:
Where:
2.2 Hydrogen energy diversified utilization structure
The multi-utilization structure of hydrogen energy proposed in this paper is shown in Figure 2. The P2G conversion is refined into an EL and MR, and HES is introduced in the middle link. The hydrogen production process is carried out in the EL. In addition to being used as a raw material for the MR, the generated hydrogen can also be used for gas-hydrogen cogeneration and hydrogen fuel cell power generation. The hydrogen storage tank can store excess wind power in the form of hydrogen energy and share the energy supply pressure for the system during periods of high load demand.
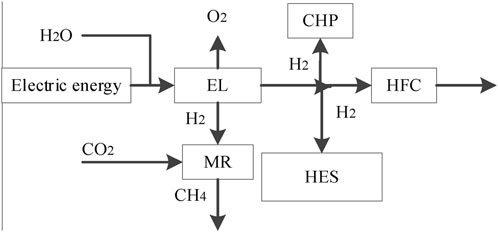
Figure 2. Hydrogen energy multi-utilization structure.
2.2.1 Two-stage power-to-gas model
2.2.1.1 EL model
The EL model is shown in Equation 3.
Where:
2.2.1.2 MR model
The MR model is shown in Equation 4.
Where:
2.2.1.3 HFC model
The energy conversion efficiency of hydrogen fuel cells can be regarded as a constant, The HFC model is shown in Equation 5:
Where:
2.2.1.4 HES model
The model of the HES needs to consider the storage capacity constraint, the single hydrogen storage/release constraint, the storage and release state complementarity constraint, and the periodic reserve conservation constraint. The HES model is shown in Equation 6:
Where:
2.2.2 Gas-hydrogen-blended cogeneration model
The Gas-hydrogen-blended cogeneration model is shown in Equation 7.
Where:
The CHP with adjustable heat-to-electricity ratio can adjust the electricity and heat output according to the real-time electricity and heat energy demand, further optimizing the operation efficiency. The CHP model is shown in Equation 8:
Where:
3 Carbon-green certificate joint trading mechanism
3.1 Reward-and-penalty carbon trading mechanism model
The reward-and-penalty ladder-type carbon trading mechanism includes the carbon emission quota model, the actual carbon emission model and the reward-and-penalty ladder-type carbon emission cost model.
3.1.1 Carbon emission quota model
This paper adopts the benchmark value method in free allocation to allocate carbon emission quotas for external power purchases, GB, and CHP in the IES, and assumes that the electricity of the external power grid comes from thermal power units. Among them, the CHP must provide heat energy while generating electricity. When the heat-to-electricity ratio is greater than 1, the cogeneration unit is used for heating. When the heat-to-electricity ratio is less than 1, the CHP is used for power supply. Since the heat-to-electricity ratio of the CHP in this paper is greater than 1, its power generation is converted into heating, and the total equivalent calorific value is used for carbon quota. The carbon emission quota model is shown in Equation 9:
Where:
3.1.2 Actual carbon emissions
The actual carbon emissions of the IES are the sum of the actual carbon emissions of the carbon capture power plant, purchased electricity, GB, and CHP, The Carbon trading model is shown in Equation 10:
Where:
3.1.3 Reward and penalty ladder carbon emission cost model
The carbon emission quota of IES participating in the carbon trading market is:
Where:
This paper adopts a step-type carbon price pricing mechanism, which divides the carbon trading price into multiple intervals, and increases stepwise with the intervals. In addition, a reward and punishment mechanism is introduced. When
Where:
3.2 Green certificate trading mechanism
Green certificates are the country’s certification of renewable energy grid-connected electricity, and are also certificates for demand-side consumption of green electricity. Similar to the carbon trading mechanism, the green certificate trading mechanism also uses transactions to play the role of the market in optimizing resource allocation. When the number of green certificates in the integrated energy system exceeds the system’s free green certificate quota, the surplus number of green certificates can be sold in the green certificate trading market to obtain revenue. On the contrary, it is necessary to purchase additional insufficient green certificates from the market to meet the green certificate quota indicators. The calculation formula for the Green certificate trading mechanism model is shown in Equation 13:
where:
Considering that the transaction price of green certificates changes with the change of the number of green certificates, this paper characterizes the transaction price of green certificates based on the Cournot transaction model of quantity competition. According to the Cournot model formula, the green certificate model transaction price is shown in Equation 14:
Where:
Among them,
Where:
3.3 Joint transaction mechanism based on CET-GCT
At present, there are problems of incoordination between my country’s carbon trading market, green certificate trading market and electricity market. Among them, the Chinese certified emission reduction (CCER) has strengthened the connection and coordination of my country’s electricity market. Since CCER and green certificates have a mutual recognition relationship through electricity substitution, and CCER and carbon quotas can be converted in equal proportion, CCER can be used as a bridge to achieve mutual recognition of green certificates and carbon quotas, so that the CET mechanism and the GCT mechanism are coupled with each other to jointly promote carbon emission reduction.
The implementation steps of the CET-GCT joint trading mechanism are as follows:
1) Calculate the initial carbon emission amount of IES
By adopting the baseline method to allocate the carbon emission quota of IES, the calculation model is Formula 11.
2) Determine the carbon emission reduction of CCER
According to the “Integrated Baseline Methodology for Renewable Energy Generation Grid-connected Projects” promulgated in 2013, the emission reduction of each MWh of renewable energy generation can be determined by the “regional grid baseline emission factor”, based on which the carbon emission reduction corresponding to GCT can be shown in Equation 16:
In the formula:
3) Determine the carbon quota of IES after mutual recognition of carbon and green certificates
After considering the carbon emissions behind the green certificate, it can directly affect the carbon emissions of IES, which can be shown in Equation 17:
4) Analyze the benefits of CET-GCT joint trading mechanism
After the mutual recognition of carbon and green certificates is completed, on the one hand, the carbon quota of IES can be increased, effectively reducing the carbon trading cost of IES, and on the other hand, the enthusiasm of power generation companies to purchase green certificates can be increased. Although the market functions of the CET mechanism and the GCT mechanism are different, the ultimate goal of both is to absorb new energy and reduce carbon emissions.
3.4 Comprehensive demand response
Comprehensive demand response is to guide users to change their energy consumption habits through compensation methods such as price incentives on the load side, thereby reducing or shifting the load demand within a certain period of time. This paper divides the comprehensive demand response load into fixed type, shift type and replaceable type. The mathematical model is shown in the Equation 18:
Where:
4 IES low carbon economic dispatch model
4.1 Objective function
The IES optimization dispatch model takes the lowest IES comprehensive cost
Where:
4.1.1 Energy purchase cost
The Energy purchase cost model is shown in Equation 20:
Where:
4.1.2 Operation and maintenance cost
The Operation and maintenance cost model is shown in Equation 21:
Where:
4.1.3 Cost of curtailed wind power
The Cost of curtailed wind power model is shown in Equation 22:
Where:
4.1.4 Demand response compensation cost
The Demand response compensation cost model is shown in Equation 23:
Where:
4.1.5 Carbon storage cost
CCPP-P2G joint operation provides the CO2 captured by CCPP to MR for reaction first, and the rest is stored, which reduces the carbon source cost of MR and the carbon storage cost of the system. This paper assumes that the volume of CO2 consumed in the methanation reaction is equal to the volume of methane generated, and the carbon storage cost is shown in Formula 24.
Where:
4.2 Constraints
4.2.1 Power balance constraint
The energy balance of the integrated energy system is shown in Equations 25–28:
5 Example analysis
In order to verify the effectiveness of the model proposed in this paper, an example is set up with
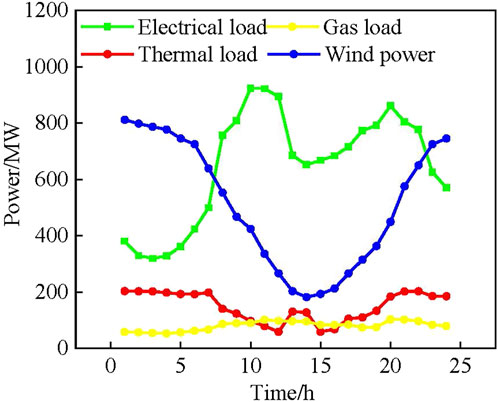
Figure 3. IES load forecast and wind power output forecast.
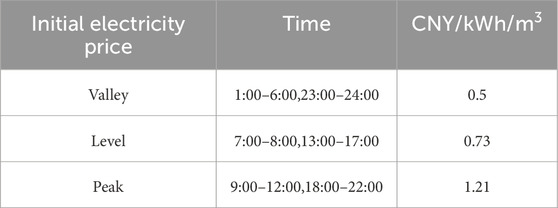
Table 1. Time-of-use electricity price information.
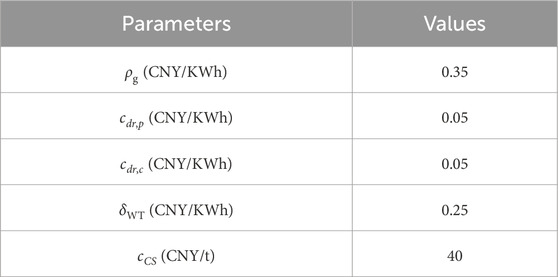
Table 2. System internal cost parameters.
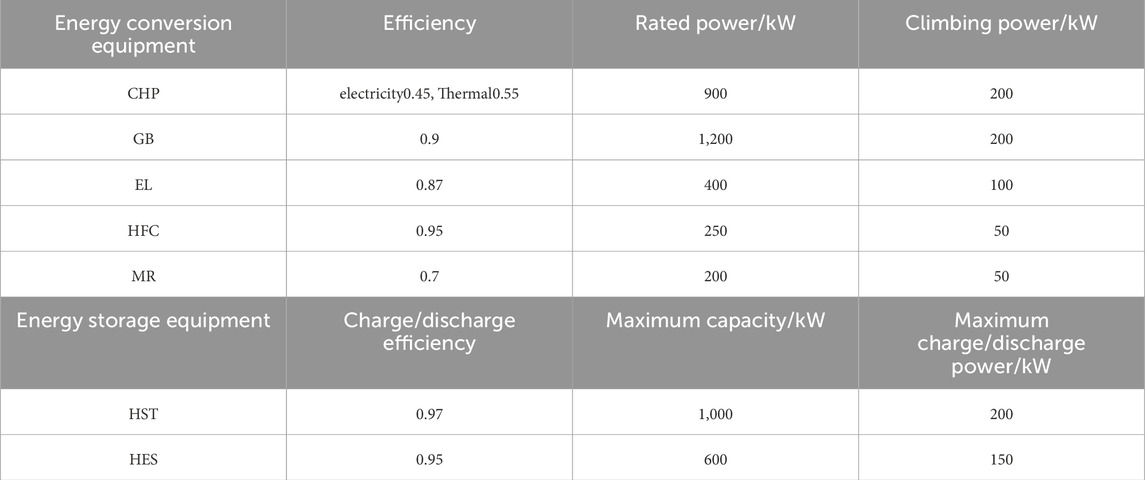
Table 3. Internal equipment parameters of the IES.
5.1 Analysis of the results of optimized dispatch of IES
In order to verify the effectiveness of the integrated energy system optimization scheduling model of comprehensive demand response, carbon capture power plant and hydrogen energy diversified utilization proposed in this paper, the following four scenarios are set for analysis:
Scheme 1: IES only considers carbon capture equipment.
Scheme 2: IES considers the coordinated operation of carbon capture power plant and traditional P2G equipment.
Scheme 3: Consider the diversified utilization structure of hydrogen energy on the basis of Scheme 2
Scheme 4: Consider the comprehensive demand response mechanism on the basis of Scheme 3
Scheme 5: Consider the green certificate-carbon trading mechanism on the basis of Scheme 4, that is, the optimization scheduling model proposed in this paper.
The optimization scheduling results of the above scheme are shown in Table 4:
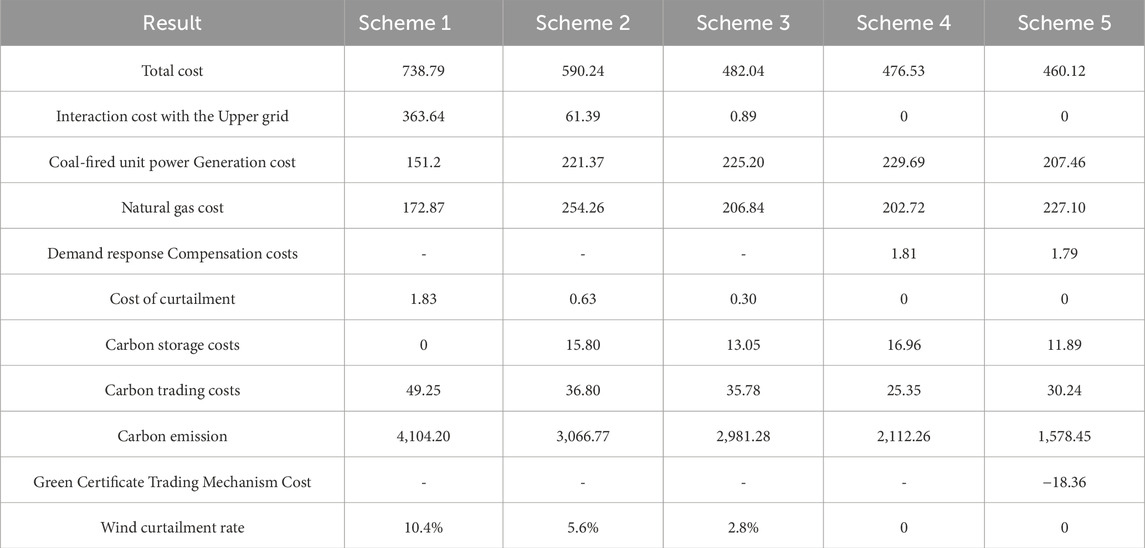
Table 4. IES optimization scheduling results of Schemes 1–5.
As shown in Table 4, the optimization scheduling model proposed in this paper has achieved good results in low carbon and economy. Compared with Scheme 1, Scheme 2 has a total cost reduction of 20.1%, a carbon emission reduction of 25.3%, and a wind abandonment rate reduction from 10.4% to 5.6%. This shows that under the joint action of the carbon capture system and traditional P2G equipment, the IES system can effectively suppress the anti-peak characteristics of wind power generation, reduce the interaction cost between the system and the external power grid, and thus reduce the carbon emissions of the system.
Scheme 3 has a total cost reduction of 18.3%, a carbon emission reduction of 2.79%, and a wind abandonment rate reduction from 5.6% to 2.8% compared with Scheme 2. Scheme 3 introduces a hydrogen energy multi-utilization structure on the basis of Scheme 2. Compared with traditional P2G, considering the hydrogen energy utilization links such as HFC and gas hydrogen blending, it can optimize the energy structure, and use part of the hydrogen generated by EL for power and heat through HFC and CHP, without the need to convert it into natural gas for reaction. The process is cleaner and more efficient, reducing energy loss and carbon emissions, and improving energy utilization efficiency, thereby improving system flexibility and economy. At the same time, compared with natural gas, hydrogen can effectively reduce the carbon emissions of the system.
Compared with Scheme 3, Scheme 4 reduces the total cost by 1.14%, reduces carbon emissions by 29.1%, and reduces the wind abandonment rate from 2.8% to 0, proving that demand response can reduce the carbon emissions of the system while improving the economy of the system. Under the influence of time-of-use electricity prices, the interaction cost between the system and the upper power grid is reduced by 8,900 yuan, which shows that demand response can optimize the energy supply of the system and make the output of the internal equipment of the system more flexible; during the peak load during the day, part of the load is transferred to the night when the electricity price is lower, which effectively suppresses the anti-peaking characteristics of wind power generation; the nighttime electricity price is relatively low, and the use of low electricity prices to meet the load demand reduces the cost of coal-fired power generation, and the overall power supply cost is reduced. At the same time, part of the thermal load and gas load are replaced by the electricity load at low electricity prices through energy conversion equipment, which reduces the cost of purchasing gas.
Compared with Scheme 4, Scheme 5 has a total cost reduction of 3.44% and a carbon emission reduction of 25.27% under the influence of the green certificate-carbon trading mechanism. Under the influence of the green certificate-carbon trading mechanism, the system will give priority to energy with lower carbon emissions for energy supply. CET effectively reduces the system’s carbon emissions by rewarding low-carbon units and punishing the output power of high-carbon units. In addition, it can sell abundant carbon quotas in the carbon trading market to obtain part of the income. At the same time, the GCT mechanism can effectively promote the proportion of green electricity in the model. Due to the high proportion of green electricity in the model, IES can obtain green certificate income in the green certificate trading market, which improves the economic benefits of the system.
5.2 Impact of multiple utilization of hydrogen energy on system operation
In order to further verify the effectiveness of the hydrogen energy multi-utilization model, the following four scenarios are set for analysis:
Scheme 6. Consider only P2G, that is, Scheme 2 of this paper.
Scheme 7. Based on Scheme 6, consider hydrogen fuel cells.
Scheme 8. Based on Scheme 7, further consider gas-hydrogen CHP, that is, Scheme 4 of this paper. The optimization scheduling results of the above schemes are shown in Table 5.
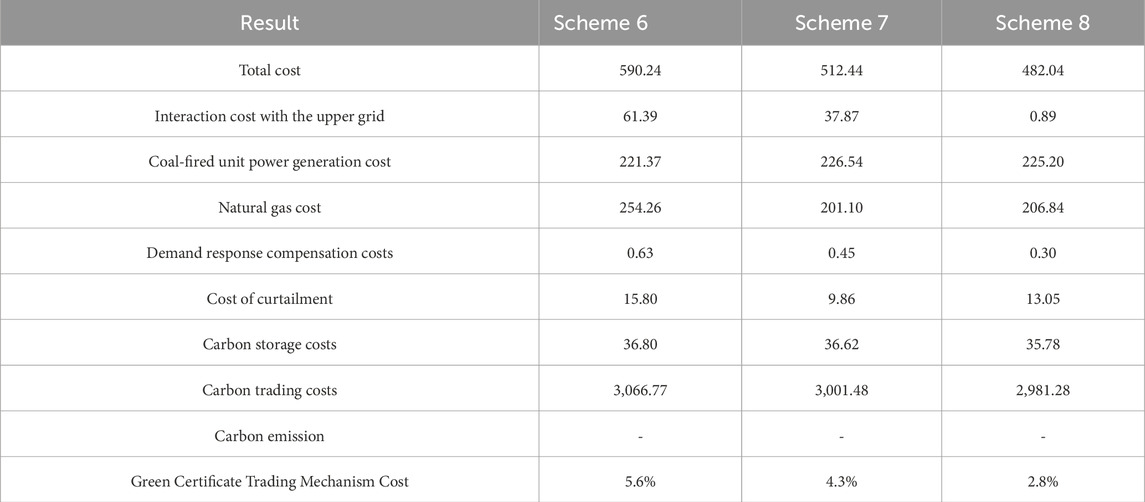
Table 5. IES optimization scheduling results of Schemes 6–8.
As shown in Table 5, compared with Scheme 6, Scheme 7 has a total cost reduction of 13.18% and a total carbon emission reduction of 2.13%, which proves that considering hydrogen fuel cells can effectively reduce the total cost and carbon emissions of the system. After the introduction of hydrogen fuel cells, the hydrogen produced by the EL can be directly used for cogeneration through HFC, which is cleaner and more efficient than producing natural gas through MR reaction and then cogeneration through CHP, reducing energy loss and carbon emissions. Compared with Scheme 7, Scheme 8 has a total cost reduction of 5.93% and a total carbon emission reduction of 0.67%, which proves that considering gas-hydrogen CHP can reduce the total cost and carbon emissions of the system to a certain extent. Gas-hydrogen CHP only adds the way that hydrogen is directly used for cogeneration through CHP, reducing the energy loss of MR reaction, thereby reducing the cost of purchasing gas. At the same time, hydrogen is directly supplied to CHP, replacing part of natural gas and reducing carbon emissions. Affected by the existing hydrogen blending technology and the upper limit of CHP power, gas-hydrogen CHP can only optimize the total cost and carbon emissions of the system to a small extent.
It can be concluded that the diversified utilization of hydrogen energy can further reduce the total cost and carbon emissions of the system compared with single utilization. The introduction of HFC and gas-hydrogen-blended CHP can enable hydrogen to be directly used for cogeneration and reduce energy loss. When the HFC power reaches its upper limit, gas-hydrogen-blended CHP can increase the application of hydrogen and use surplus hydrogen for cogeneration, thereby improving energy utilization.
The hydrogen power balance diagram of the optimized dispatching operation of Scheme 8 system is shown in Figure 4.

Figure 4. IES hydrogen power balance diagram.
As shown in Figure 4, when there is surplus wind power at night, in order to improve wind power consumption, the system uses EL to produce hydrogen, a part of the hydrogen is stored in hydrogen storage tanks, and the surplus hydrogen is used for cogeneration through HFC. Due to the power limit, a part of it is used to produce natural gas through MR, and a small part of hydrogen is used for gas hydrogen blending; during the peak power consumption during the day, the system releases the hydrogen in the hydrogen storage tank and uses it all for HFC energy supply, and continues to produce hydrogen at night. When the HFC reaches the power limit and hydrogen is surplus, the system will give priority to hydrogen storage, and then MR reaction will produce natural gas. The system will still produce natural gas through MR. This is because the heat load demand is high at night and the electricity load demand is low. The surplus hydrogen is used to produce natural gas, using GB high-efficiency heating to reduce gas purchase costs.
5.3 Comprehensive demand response benefit analysis
The comprehensive demand response scheduling result of the system in Scheme 4 is shown in Figure 5.
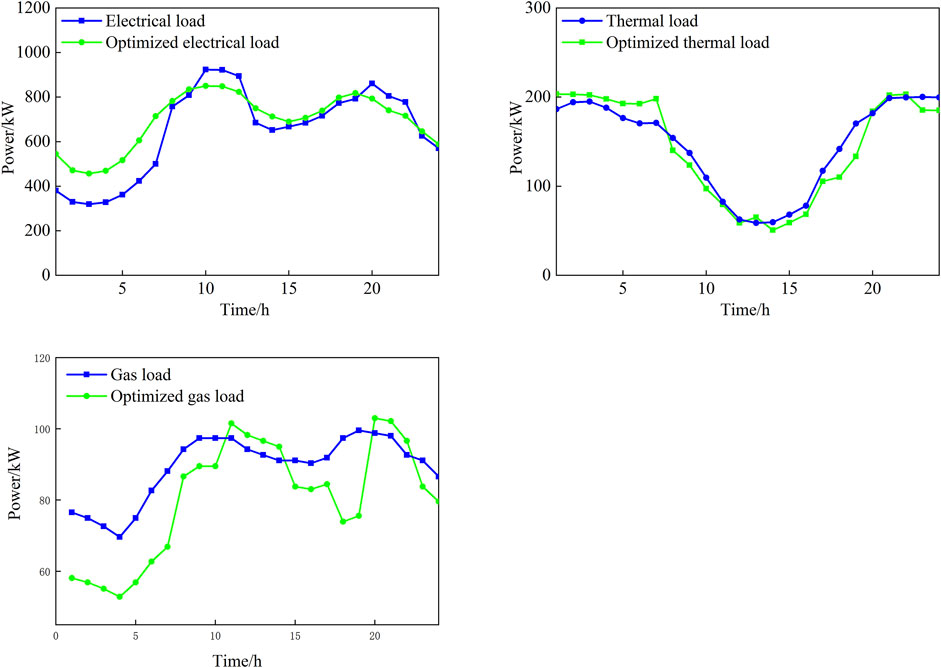
Figure 5. IES demand response comparison chart.
As shown in Figure 5, for loads that can be horizontally shifted, due to the abundance of wind power resources at night and the influence of time-of-use electricity prices, the system transfers part of the electricity load during peak hours to the valley and flat valley hours, which alleviates the pressure of electricity consumption during peak loads and reduces the power supply cost. The demand for heat load and gas load is higher at night and lower during the day. In order to alleviate the pressure of purchasing gas at night for heating through GB and CHP, part of the heat load is transferred to the daytime. Since the electricity load during the peak hours during the day is reduced and affected by the time-of-use electricity price, increasing the heat load can increase the output power of CHP and HFC, thereby reducing the system’s electricity purchase cost during the peak hours during the day. The system’s natural gas sources mainly include the natural gas grid and MR. When the natural gas produced by MR is not enough to meet the gas load, the transfer of gas load will not affect the system’s carbon emissions, and will further increase the demand response cost. Therefore, this article does not consider the transfer of gas load.
For alternative loads, replacing part of the nighttime heat load and gas load with electric load can not only promote the utilization of wind power resources at night, but also purchase electricity from the upper power grid at the nighttime valley price, reducing the total system cost; during the peak period of daytime electricity load, since the heat production efficiency of GB is higher than that of HFC and CHP, replacing part of the heat load with gas load can alleviate the heating pressure and reduce the energy consumption of the system.
Based on the above analysis, it can be seen that comprehensive demand response can guide the shift and replacement of multiple loads on the demand side, and can effectively adjust the peak-valley difference of the system load, thereby smoothing the load fluctuation, promoting the consumption of wind power, reducing the system carbon emissions and electricity purchase costs, and promoting the low-carbon economic operation of IES.
5.4 Analysis of the impact of green certificate-carbon trading mechanism on the low-carbon economic benefits of the integrated energy system
In order to further verify the effectiveness of the green certificate-carbon trading mechanism, the following three scenarios are set for analysis:
Scheme 9: Only consider the traditional carbon trading mechanism, that is, Scheme 4 of this article.
Scheme 10: On the basis of Scheme 9, introduce a reward and punishment carbon trading mechanism.
Scheme 11: On the basis of Scheme 9, introduce a green certificate trading mechanism.
Scheme 12: On the basis of Scheme 9, introduce a green certificate-carbon trading mechanism, that is, Scheme 5 of this article.
Figure 6 shows the output of high and low carbon units in Scheme 9 and Scheme 10. In this system, high carbon units are purchased electricity, and low carbon units are gas units. Compared with Scheme 4, after Scheme 5 introduces the reward ladder carbon trading mechanism, since the proportion of gas units in IES is relatively high, after introducing the reward and punishment ladder carbon trading mechanism, IES can increase the output of low carbon units and reduce the output of high carbon units by rewarding the output power of low carbon units and punishing high carbon units, effectively reducing the carbon emissions of the system. In addition, it is also possible to sell the surplus carbon quota in the carbon trading market and obtain part of the income.
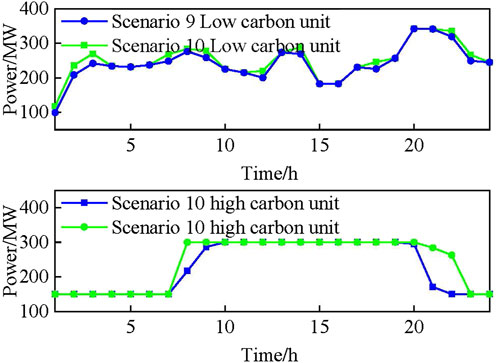
Figure 6. Unit output of Scheme 9 and Scheme 10.
Figure 7 shows the comparison of new energy consumption between Scheme 9 and Scheme 10. Scheme 5 introduces the GCT mechanism compared to Scheme 4. Since the proportion of green electricity in the model is relatively high, IES can obtain benefits in the green certificate trading market, which improves the economic benefits of the system.
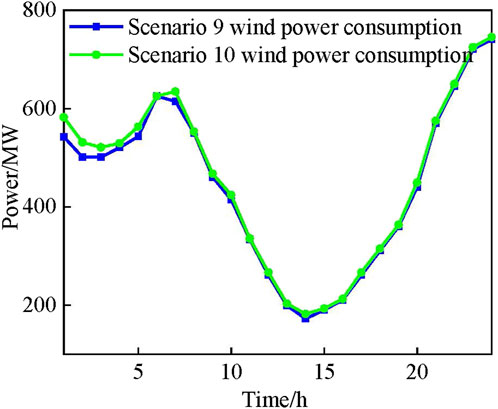
Figure 7. Comparison of new energy consuption.
By considering the mutual recognition of CCER and green certificates to calculate the carbon emission reduction behind the new energy supply, and then affecting the carbon quota of the system, the CET mechanism and the GCT mechanism are coupled with each other. The CET-GCT joint trading mechanism can further reduce the carbon emissions of the system and increase the enthusiasm of the system to purchase green certificates and low-carbon unit output. As shown in Table 4, compared with Scheme 10 and Scheme 11, Scheme 12 combines the advantages of the CET mechanism and the GCT mechanism, so that the comprehensive cost and carbon emissions of IES are further reduced, which verifies the low-carbon economy of the CET-GCT joint trading mechanism proposed in this paper.
6 Conclusion
This paper proposes a low-carbon economic dispatch model for an integrated energy system containing carbon capture power plants and multiple utilization of hydrogen energy. The model takes into account the flexible operation characteristics of liquid-storage CCPP, refines the P2G two-stage operation, and adopts a hydrogen energy diversified utilization strategy to improve energy utilization efficiency. On this basis, the green certificate-carbon trading mechanism and comprehensive demand response are introduced to Minimizing the total system cost is the optimization goal, and through research and analysis, the following conclusions are reached:
1) The calculation example results prove that the model proposed in this article can effectively reduce the total system cost and carbon emissions, improve clean energy consumption and energy utilization, and has significant economical and low-carbon properties.
2) Diversified utilization of hydrogen energy increases the utilization of hydrogen energy, gives full play to the clean and efficient characteristics of hydrogen energy, reduces energy cascade losses, can effectively improve system flexibility, promote night-time wind power consumption, reduce system carbon emissions, and improve system’s low-carbon economic benefits.
3) Comprehensive demand response can cut peaks and fill valleys in the system load demand to a certain extent, stabilize load fluctuations, alleviate the pressure of system supply and demand imbalance, promote clean energy consumption, and reduce system energy purchase costs.
4) The CET-GCT joint trading mechanism proposed in this article reduces carbon emissions by 25.81% and comprehensive costs by 18.87%. Compared with only considering the CET mechanism and the GCT mechanism alone, the CET-GCT joint trading mechanism has better emission reduction effects and economics, and can effectively bring into play the complementary characteristics and synergistic effects of the two mechanisms, thereby further improving the economics and low-carbon of IES sex.
Data availability statement
The original contributions presented in the study are included in the article/supplementary material, further inquiries can be directed to the corresponding author.
Author contributions
JW: Conceptualization, Methodology, Project administration, Writing–review and editing. XJ: Conceptualization, Methodology, Writing–review and editing. XM: Conceptualization, Methodology, Writing–original draft. YB: Formal Analysis, Writing–review and editing. ML: Writing–review and editing.
Funding
The author(s) declare that financial support was received for the research, authorship, and/or publication of this article. This project is funded by Jilin Province’s “Land Scenery Three Gorges” high-quality development major science and technology project-park-level multi-microgrid system participating in key technology research projects for grid-friendly interaction (project number: 20230303003SF).
Acknowledgments
Thank you for the funding of the “Land Scenery Three Gorges” high-quality development major science and technology project in Jilin Province - Park level multi micro grid system participation in grid friendly interaction key technology research project (project number: 2023030303SF).
Conflict of interest
Authors JW and XM were employed by State Grid Jilin Electric Power Co Ltd.
The remaining authors declare that the research was conducted in the absence of any commercial or financial relationships that could be construed as a potential conflict of interest.
Publisher’s note
All claims expressed in this article are solely those of the authors and do not necessarily represent those of their affiliated organizations, or those of the publisher, the editors and the reviewers. Any product that may be evaluated in this article, or claim that may be made by its manufacturer, is not guaranteed or endorsed by the publisher.
References
Akarsu, B., and Serdar Genç, M. (2022). Optimization of electricity and hydrogen production with hybrid renewable energy systems. Fuel 324, 124465. doi:10.1016/j.fuel.2022.124465
Arsad, A. Z., Hannan, M. A., Al-Shetwi, A. Q., Mansur, M., Muttaqi, K. M., Dong, Z. Y., et al. (2022). Hydrogen energy storage integrated hybrid renewable energy systems: a review analysis for future research directions. Int. J. Hydrogen Energy 47, 17285–17312. doi:10.1016/j.ijhydene.2022.03.208
Chen, J., Hu, Z., Chen, Y., Chen, J., Chen, W., Gao, M., et al. (2021). Thermoelectric optimization of integrated energy system considering ladder-type carbon trading mechanism and electric hydrogen production. Dianli Zidonghua Shebei/Electric Power Autom. Equip. 41 (9). doi:10.16081/j.epae.202109032
Chen, Q., Ji, Z., Kang, C., and Ming, H. (2012). Analysis on relation between power generation and carbon emission of carbon capture power plant in different operation modes. Dianli Xit. Zidonghua/Automation Electr. Power Syst. 36 (18). doi:10.3969/j.issn.1000-1026.2012.18.020
Cui, Y., Jiang, T., Zhong, W., Cui, C., and Zhao, Y. (2020a). Source-load coordination economic dispatch method for regional integrated energy system considering wind power accommodation. Dianwang Jishu/Power Syst. Technol. 44 (7). doi:10.13335/j.1000-3673.pst.2019.2317
Cui, Y., Zhang, H., Zhong, W., Zhao, Y., Wang, Z., and Xu, B. (2020b). Day-ahead scheduling considering participation of price-based demand response and CSP plant in wind power accommodation. Dianwang Jishu/Power Syst. Technol. 44 (1). doi:10.13335/j.1000-3673.pst.2019.0181
Fang, S., Xu, Y., Li, Z., Ding, Z., Liu, L., and Wang, H. (2019). Optimal sizing of shipboard carbon capture system for maritime greenhouse emission control. Pap. Present. A. T. IEEE Trans. Industry Appl. 55, 5543–5553. doi:10.1109/tia.2019.2934088
Faruque, M. H. S. M. Z., and Monzure-Khoda, K. (2022). Challenges and opportunities in carbon capture, utilization and storage: A process systems engineering perspective. Computers and Chemical Engineering, 166.
He, J., Li, Y., Li, H., Tong, H., Yuan, Z., Yang, X., et al. (2020). Application of game theory in integrated energy system systems: a review. IEEE Access 8, 93380–93397. doi:10.1109/ACCESS.2020.2994133
Li, Z., and Xu, Y. (2019). Temporally-coordinated optimal operation of a multi-energy microgrid under diverse uncertainties. Appl. Energy 240, 719–729. doi:10.1016/j.apenergy.2019.02.085
Liang, B., Liu, W., and Zhang, J. (2023). Coordinated scheduling of electricity–heat–gas integrated energy system considering emerging energy conversion technologies. Energy Rep. 9, 136–144. doi:10.1016/j.egyr.2023.08.059
Liu, X., Nie, F., Yang, D., Wang, Y., and Xu, Y. (2023). Low carbon economic dispatch of integrated energy systems considering green certificates-carbon trading mechanism under CCPP-P2G joint operation model. Dianwang Jishu/Power Syst. Technol. 47 (6). doi:10.13335/j.1000-3673.pst.2022.1507
Liu, Y., Hu, Z., Chen, J., Weng, C., Gao, M., and Liu, S. (2024). Low-carbon economic dispatch of integrated energy system considering carbon capture power plant and multi-utilization of hydrogen energy. Dianli Xit. Zidonghua/Automation Electr. Power Syst. 48 (1). doi:10.7500/AEPS20230221001
Liwei, J., Zhe, Y., Qingqing, Z., Qiaochu, L., Peng, W., Wenxu, T., et al. (2022). Nearly-zero carbon optimal operation model and benefit allocation strategy for a novel virtual power plant using carbon capture, power-to-gas, and waste incineration power in rural areas. Applied Energy, 310.
Rosen, M. A., and Koohi-Fayegh, S. (2016). The prospects for hydrogen as an energy carrier: an overview of hydrogen energy and hydrogen energy systems. Energy, Ecol. Environ. 1, 10–29. doi:10.1007/s40974-016-0005-z
Sun, H., Guo, Q., and Pan, Z. (2015). Energy internet: concept, architecture and frontier outlook. Dianli Xit. Zidonghua/Automation Electr. Power Syst. 39 (19). doi:10.7500/AEPS20150701007
Tian, F., Jia, Y., Ren, H., Bai, Y., and Huang, T. (2020). Source-load low-carbon economic dispatch of integrated energy system considering carbon capture system. Dianwang Jishu/Power Syst. Technol. 44 (9). doi:10.13335/j.1000-3673.pst.2020.0728
Wang, Y., Gao, S., Jia, W., Ding, T., Zhou, Z., and Wang, Z. (2022). Data-driven distributionally robust economic dispatch for park integrated energy systems with coordination of carbon capture and storage devices and combined heat and power plants. IET Renew. Power Gener. 16 (12), 2617–2629. doi:10.1049/rpg2.12436
Wang, Y., Qiu, J., Tao, Y., Zhang, X., and Wang, G. (2020a). Low-carbon oriented optimal energy dispatch in coupled natural gas and electricity systems. Appl. Energy 280, 115948. doi:10.1016/j.apenergy.2020.115948
Wang, Y., Qiu, J., Tao, Y., and Zhao, J. (2020b). Carbon-Oriented operational planning in coupled electricity and emission trading markets. IEEE Trans. Power Syst. 35 (4), 3145–3157. doi:10.1109/TPWRS.2020.2966663
Wang, Y., Xie, H., Sun, X., and Bie, Z. (2021). Day-Ahead economic dispatch for electricity-heating integrated energy system considering incentive integrated demand response. Diangong Jishu Xuebao/Transactions China Electrotech. Soc. 36 (9). doi:10.19595/j.cnki.1000-6753.tces.L90240
Wei, Z., Zhang, S., Sun, G., Xu, X., Chen, S., and Chen, S. (2016). Carbon trading based low-carbon economic operation for integrated electricity and natural gas energy system. Dianli Xit. Zidonghua/Automation Electr. Power Syst. 40 (15). doi:10.7500/AEPS20151109004
Xiliang, Z., Xiaodan, H., Da, Z., Yong, G., Lixin, T., Yin, F., et al. (2022). Research on the pathway and policies for China's energy and economy transformation toward carbon neutrality. J. Manag. World 38 (01). doi:10.19744/j.cnki.11-1235/f.2022.0005
Xu, Y., Song, Y., Deng, Y., Liu, Z., Guo, X., and Zhao, D. (2023). Low-carbon economic dispatch of integrated energy system considering the uncertainty of energy efficiency. Energy Rep. 9, 1003–1010. doi:10.1016/j.egyr.2022.11.102
Yang, J., Zhang, N., Wang, Y., and Kang, C. (2018). Multi-energy system towards renewable energy accommodation: review and prospect. Dianli Xit. Zidonghua/Automation Electr. Power Syst. 42. doi:10.7500/AEPS20171002004
Zhang, S., Wang, D., Cheng, H., Song, Y., Yuan, K., and Du, W. (2022). Key technologies and challenges of low-carbon integrated energy system planning for carbon emission peak and carbon neutrality. Dianli Xit. Zidonghua/Automation Electr. Power Syst. 46. doi:10.7500/AEPS20210703002
Zhou, R., Xiao, J., Tang, X., Zheng, Q., Lü, J., and Cao, J. (2018). Coordinated optimization of carbon utilization between power-to-gas renewable energy accommodation and carbon capture power plant. Dianli Zidonghua Shebei/Electric Power Autom. Equip. 38 (7). doi:10.16081/j.issn.1006-6047.2018.07.008
Keywords: liquid storage carbon capture, multiple utilization of hydrogen energy, integrated demand response, integrated energy system, optimized scheduling
Citation: Wang J, Ji X, Meng X, Bai Y and Li M (2025) Low-carbon economic dispatch of integrated energy system with carbon capture power plant and multiple utilization of hydrogen energy. Front. Energy Res. 12:1447858. doi: 10.3389/fenrg.2024.1447858
Received: 12 June 2024; Accepted: 06 November 2024;
Published: 24 January 2025.
Edited by:
Theo Tsotsis, University of Southern California, United StatesReviewed by:
Marcin Wołowicz, Warsaw University of Technology, PolandYunqi Wang, Monash University, Australia
Copyright © 2025 Wang, Ji, Meng, Bai and Li. This is an open-access article distributed under the terms of the Creative Commons Attribution License (CC BY). The use, distribution or reproduction in other forums is permitted, provided the original author(s) and the copyright owner(s) are credited and that the original publication in this journal is cited, in accordance with accepted academic practice. No use, distribution or reproduction is permitted which does not comply with these terms.
*Correspondence: Xiu Ji, aml4aXU1MjNAMTI2LmNvbQ==