 Ran Ding1,2
 Zhihuan Zhuo
94% of researchers rate our articles as excellent or good
Learn more about the work of our research integrity team to safeguard the quality of each article we publish.
Find out more
ORIGINAL RESEARCH article
Front. Energy Res., 13 September 2024
Sec. Sustainable Energy Systems
Volume 12 - 2024 | https://doi.org/10.3389/fenrg.2024.1445092
This article is part of the Research TopicOptimal Scheduling of Demand Response Resources In Energy Markets For High Trading Revenue and Low Carbon EmissionsView all 34 articles
As the integration of high-proportion renewable energy into the grid increases, the intermittency and uncertainty of renewable energy output significantly affect the safe and stable operation of the power system. Combining utility-scale energy storage technology with renewable coordination is one of the methods to address these issues. Compressed air energy storage (CAES) has garnered extensive attention due to its large capacity, long operational life, and clean, low-carbon advantages. Given the poor compressibility of air and its high critical point, using carbon dioxide as the working fluid in utility-scale energy storage systems can achieve higher energy storage density and cycle efficiency. Accordingly, this paper focuses on the study of utility-scale energy storage system modeling and scheduling methods considering carbon dioxide energy storage. It investigates Compressed Carbon Dioxide Energy Storage (CCES) systems, analyzes the operational framework of typical CCES systems, and sequentially establishes models for the energy storage process, energy release process, hot water tank operation, and gas storage tank operation. Based on this, it explores power system optimization dispatch methods considering CCES, incorporating the established models into an optimization dispatch model for power systems with high wind power penetration. Within the framework of a safe constraint unit commitment study, using the IEEE-30 nodes model, the effectiveness of the established models is validated. The case study results confirm the role of CCES in enhancing the absorption rate of renewable coordination. Moreover, under the same storage conditions, compared to, CCES offers greater charging and discharging power and higher energy storage density.
With the rapid depletion of global fossil energy resources, the issues of global warming and environmental pollution are becoming increasingly severe (Liu et al., 2020; Wang et al., 2020; Wang et al., 2023). Energy conservation, emission reduction, and the utilization of renewable energy have emerged as effective strategies to address the growing environmental and energy challenges. To respond to global climate change and achieve the goals of peaking and neutralizing carbon dioxide emissions as soon as possible, it is necessary to further expand the coordination of renewable energy and actively realize a leapfrog development from fossil fuel-based power generation to clean and low-carbon energy sources (Dou et al., 2022; Ti et al., 2022; Zhang et al., 2022; Han et al., 2023; Yu et al., 2023). In 2020, China proposed the objectives of achieving carbon peak and carbon neutrality. The realization of these “dual carbon” goals necessitates proactive efforts in energy conservation and emission reduction, as well as vigorous development of renewable energy sources to reduce and offset our carbon emissions. Consequently, in recent years, China’s renewable energy power generation has entered a phase of multiple growth.
Currently, the only large-capacity storage systems that can achieve 100 MW levels are pumped hydro storage systems and CAES systems (Zhang et al., 2023). However, the construction of pumped hydro storage plants requires special geographical conditions, and they have long construction periods, high initial investments, and can cause damage to the surrounding ecological environment during construction, severely restricting their development. In comparison, compressed air energy storage uses air as the compression medium in the system, not only is it safer, but the required geographical conditions are not as strict, and it has advantages in terms of construction period and investment cost. However, due to the lower compressibility of air compared to other gases (e.g., carbon dioxide), compressed air requires high thermodynamic parameters, necessitating more energy consumption in compressors during the compression process; and because of the low critical temperature of air (−140.5°C), liquid state energy storage places high demands on the equipment, making the technical and economic performance of compressed air energy storage systems often less than ideal (Jiang et al., 2022; Wang et al., 2022).
Compared to pumped hydro and CAES, compressed carbon dioxide energy storage systems, utilizing carbon dioxide as the compression medium, have several major advantages due to its excellent physical properties and environmental friendliness: (1) Compared to air, carbon dioxide has better compressibility, reducing energy consumption during the compression process; (2) The critical temperature and pressure of carbon dioxide are 30.98°C and 7.38 MPa, respectively, making it easier to liquefy than air and thus can be stored in tanks in liquid form, eliminating the need for specific geographical conditions; (3) The thermal cycle based on carbon dioxide is well-developed; (4) Using carbon dioxide as the working medium provides a new pathway for its large-scale application and offers a new effective indirect method for carbon dioxide emission reduction (Cavallo, 2001; Crotogino et al., 2001; Jiang et al., 2022; Wang et al., 2022). Based on these advantages, compressed carbon dioxide energy storage systems have shown better technical and economic performance, leading to an increasing number of proposals for such systems.
Morandin et al. (2012) proposed a hybrid system combining hot water and transcritical CO2 circulation, which was optimized using pinch point analysis tools. Liu et al. (2016) presented a carbon energy storage system that utilized underground double reservoirs as carbon dioxide gas storage chambers, noting that transcritical systems exhibited higher cycle efficiency and energy density. A mathematical model of a compressed liquid CCES was established in (Wang et al., 2015). Parameter analysis was conducted and the results demonstrated that the incorporation of CCES significantly increased the penetration rate of renewable power. Xu et al. (2020) proposed a comparison with a liquid CAES revealed that the liquid CCES exhibited higher cycle efficiency. Furthermore, a trigeneration system based on the transcritical brayton cycle and energy storage system was proposed in (Liu et al., 2019). A thermodynamic model was developed to analyze its performance. Parameter analysis revealed that a lower thermal fluid utilization rate enhanced the cooling capacity, heating capacity, and total output energy of the system, making it more suitable for heating users than cooling users. Other studies have explored different aspects of CCES. For example, Bartela et al. (2021) presented the model of CCES utilizing a post-mining underground infrastructure, and CO2 is stored under low pressure.
Existing studies often focus on the structural parameters and efficiency optimization of compressed carbon energy storage systems, with less research on the involvement of carbon storage systems in the optimization of power system scheduling. Therefore, this paper conducts research on the actual dispatch issues of utility-scale power systems involving carbon storage systems, based on the actual physical properties of carbon dioxide. The main contributions of this paper are as follows: 1) It proposes the system composition and operational framework of CCES utility-scale system, including compressors, expanders, CO2 storage chambers, and thermal storage systems, and models the energy storage process, energy release process, thermal tank operation process, and gas storage tank operation process separately. 2) It employs a mixed-integer programming method to establish the corresponding mathematical model to study the optimal dispatch problem of power systems including compressed carbon dioxide energy storage.
This section presents the working principles and components of a CCES utility-scale system, including compressors, expanders, gas storage chambers, and thermal storage systems. Models are developed for the energy storage process, energy release process, thermal storage tank operation, and gas storage tank operation.
As shown in Figure 1, during low load periods in the power grid, compressors are used to compress low-pressure carbon dioxide stored in underground gas chambers to high-pressure state and deposit it within high-pressure gas reservoir. At the same time, a thermal storage medium recovers and stores the compression heat from the compressor units. During peak electricity usage periods in the power grid, the carbon dioxide stored in high-pressure gas chambers absorbs thermal energy and enters the expander units, utilizing the stored compression heat to drive multi-stage expanders for power generation. The carbon dioxide, after working through the expanders, enters the low-pressure gas chambers. The energy storage system’s thermal storage/cooling units include cold storage tanks, heat storage tanks, intercoolers between compressors, and reheaters between expander stages. When carbon dioxide is compressed, the thermal medium (water or another medium) in the cold tank is heated in the intercooler between compressors and then stored in the heat storage tank. When the expander is working, the high-temperature thermal medium from the heat storage tank enters the expander’s reheater to heat the high-pressure carbon dioxide. The thermal medium, after releasing heat in the reheater, is recovered back to the cold storage tank.
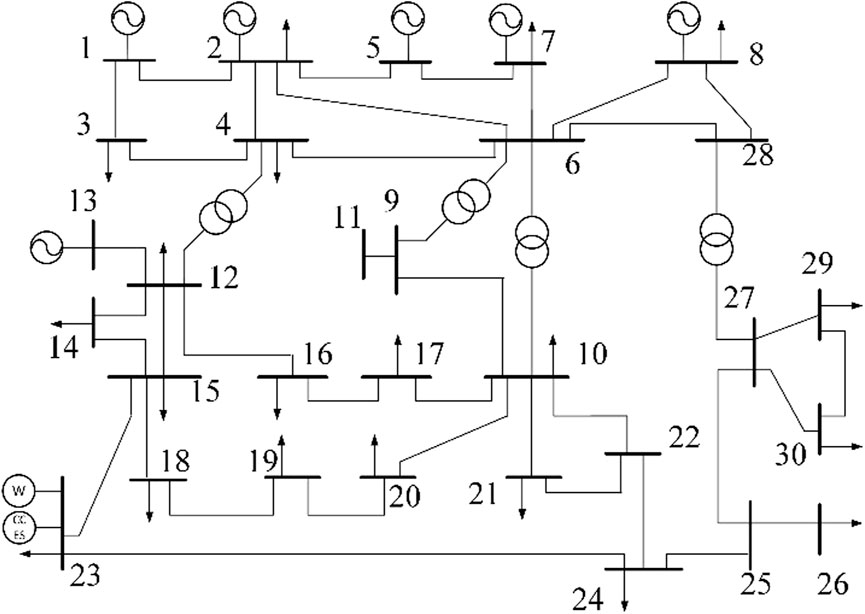
Figure 1. Topology of the IEEE 30-node System.
where
where
Discharge power is the sum of the power of each stage expander during the discharge process.
where
where
The power consumption of the compressor and the work done by the expander are essentially determined by the inlet and outlet states of CO₂ and thermodynamic equations. Taking the compression process as an example, the ideal power consumption of the compressor is calculated by the difference in enthalpy values of CO₂ at the outlet and inlet, multiplied by the unit mass flow rate. This result is then divided by the isentropic efficiency and mechanical efficiency to obtain the actual power consumption. The difference in enthalpy values of CO₂ at the inlet and outlet is further expressed as the product of the specific heat capacity at constant pressure and the temperature difference of CO₂.
In this study, the CCES system employs multistage compression and expansion. It is evident that the temperature of the working medium is a crucial factor influencing the charging and discharging power of CCES system. Thus, accurately characterizing the temperature of carbon dioxide during the charging and discharging processes is an essential aspect of modeling CCES systems. The inlet and outlet temperatures of the compressors and expanders satisfy the following equations:
During the heat exchange process, the introduction of the heat exchanger effectiveness ε denotes the outlet temperature of the heat exchanger, and assuming equal specific heat capacities for the cold and hot fluids, the inlet temperatures of each stage compressor and expander can be expressed as:
According to existing literature, the gas storage chamber of CCES can utilize underground saline aquifers and abandoned mines. When employing these as storage chambers, it is essential to account for the upper and lower limits of the storage pressure. The gas volume and mass within the storage chamber are determined by the state from the previous cycle and the mass flow rate during the scheduling period. Given that the volume remains constant, the relationship between pressure constraints and gas mass is established using the CO₂ volume-pressure-temperature equation. Since the storage chamber exchanges heat with the external environment, it is considered an isothermal storage chamber. The CCES system comprises two gas storage chambers, high-pressure and low-pressure, each satisfying the following equations:
As a new type of power storage system, CCES has a long construction cycle and an operation income period of more than 10 years to decades, which makes the project balance period extended, and the economic benefits are not obvious in the short term. In order to comprehensively and accurately analyze and evaluate the technical and economic characteristics of the system, the economic status of the CCES system in the whole life cycle is studied.
Whole life cycle cost refers to the comprehensive expenses that may occur throughout the entire life cycle of equipment, from investment, operation, maintenance, to decommissioning. Whole life cycle analysis methods can effectively address the contradiction between equipment development and financial constraints, making it a strategic measure to enhance life cycle profitability. For system investment projects, life cycle cost modeling can, to some extent, predict the direct and indirect economic benefits of the project, providing a comprehensive analysis of the technical and economic aspects of system investment projects, thereby offering rational decision-making support for investors. According to the definition of life cycle cost, the production cost of an energy storage system consists of investment construction costs and operating costs.
The investment construction costs of a compressed carbon dioxide energy storage station primarily include the procurement costs of key equipment such as compressors, expanders, and gas storage chambers. The operating and maintenance costs include fixed maintenance costs, variable maintenance costs, electricity purchase costs, and personnel costs. Fixed maintenance costs are determined by the scale of the compressed carbon dioxide energy storage station, while variable maintenance costs are related to the energy throughput of the storage station. The electricity purchase cost of the energy storage system is derived from the off-peak electricity price and the total electricity consumption of the system over its life cycle.
An optimal scheduling model incorporating CCES and wind power is established. The optimization model minimizes the operational cost of the power system and considers operational constraints of CCES power stations, thermal power generation units, and wind power output.
The objective function comprises the fuel costs for electricity generation and the startup costs of thermal power generation units. It is assumed that the operating cost of wind power generation is zero.
T represents the total scheduling duration,
Equations delineate the upper and lower bounds of the unit’s output, with
The actual dispatch output of wind power cannot exceed the forecasted wind power.
Equations calculate network power flows using the correlation matrix and transfer factor matrix, and constrain line power flows not to exceed limits.
This paper conducts case studies based on an improved IEEE 30-node system. The schematic diagram of the system structure is illustrated in Figure 2. A wind farm and a CCES power station are connected to node 23 of the original system. Economic comparative analysis is carried out considering three scenarios: no energy storage, carbon-containing energy storage power station, and compressed air energy storage power station, to analyze the total operating costs of the system. The Cplex toolbox in MATLAB 2020b is took for optimization scheduling modeling solving.
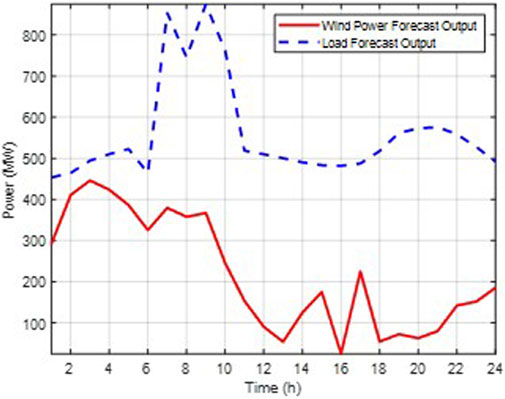
Figure 2. Forecast output of wind power and load.
The IEEE 30-node system depicted in Figure 2 is studied over a 24-h period, comprising ten thermal power generation units labeled as G1 to G6, one wind power, and one CCES unit. The parameters of these units are presented in Tables 1, 2.
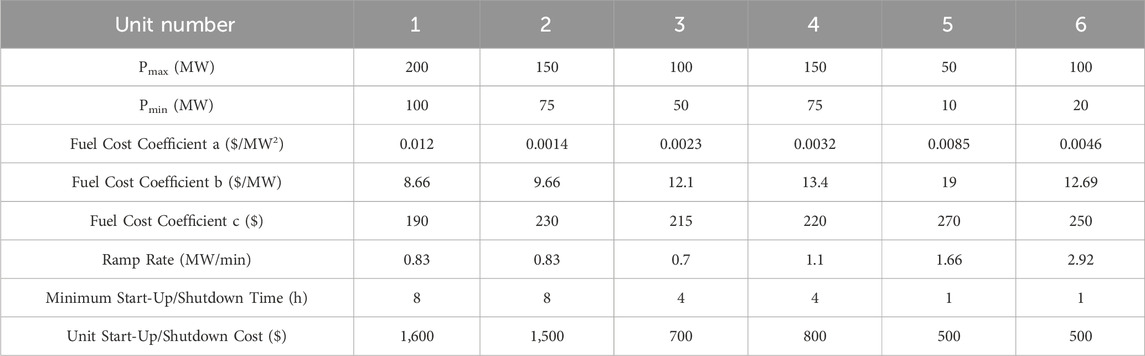
Table 1. Parameters of thermal power generation units.
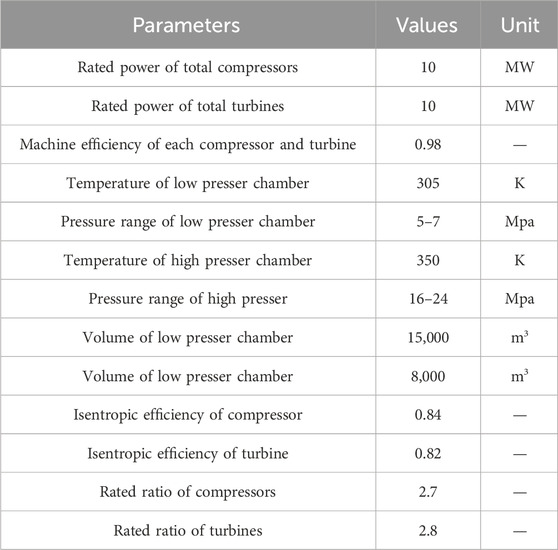
Table 2. Main parameters of CCES.
Figure 3 illustrates the hourly load forecast and wind power forecast over the 24-h period.
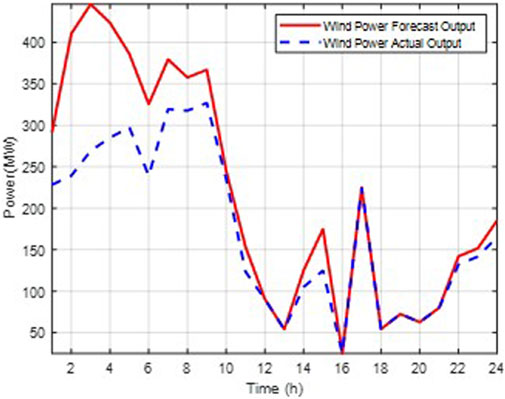
Figure 3. Output results of units without energy storage.
The analysis is conducted using the following three typical scenarios: Case 1: Without the inclusion of an energy storage power station; Case 2: With the inclusion of a CAES power station; Case 3: With the inclusion of a CCES power station.
Case 1. Without the inclusion of an energy storage power station.
As indicated by Figures 4, 5, during the hours with high actual wind power outputs, specifically the 5th, 7th, 9th, and 17th hours, with values of 297.672 MW, 320.11 MW, 327.01 MW, and 225.34 MW respectively, the system’s scheduled wind power dispatch did not fully utilize the surplus wind power generation. This suggests that the system is willing to endure partial shutdowns of thermal power units along with the associated start-up and ramping costs to avoid substantial penalties for wind curtailment. However, due to the lack of energy storage facilities, a significant amount of wind power is still being wasted. This leads to an increased overall operational cost for the system.
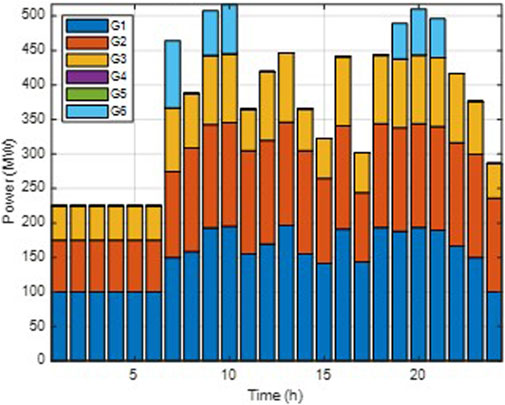
Figure 4. Output results of units without energy storage.
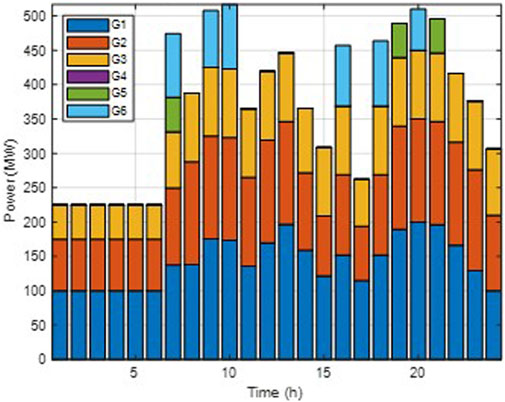
Figure 5. Output results of units with CAES system.
Case 2. With the inclusion of a compressed air energy storage power station;
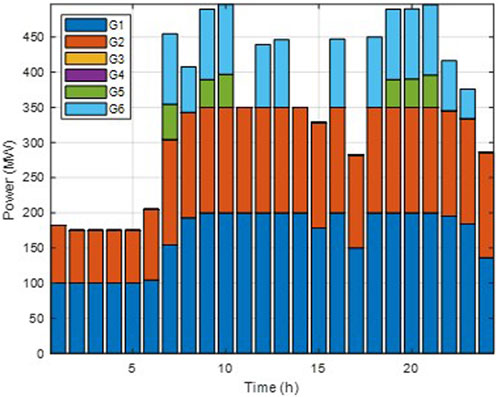
Figure 6. Output results of units with CCES system.
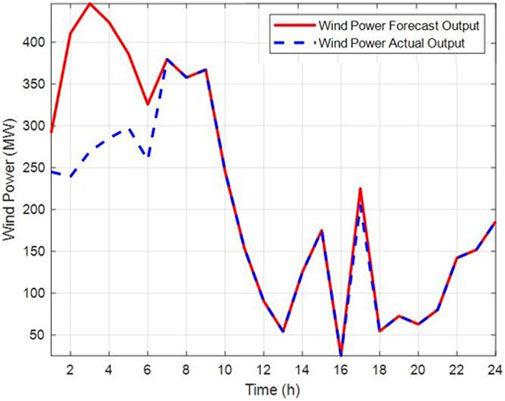
Figure 7. Wind power actual scheduling results with CAES.
Case 3. With the inclusion of a compressed carbon dioxide energy storage power station.
Figures 8, 9 illustrate that, following the implementation of a CCES system, the wind power absorption ratio during the initial 8 hours is significantly enhanced compared to Case 2. This improvement is attributed to carbon dioxide’s ability to more easily surpass critical conditions and enter a supercritical state under the same operating conditions. With a higher fluid density, the working capacity of the medium is enhanced, leading to a substantial increase in both the charging/discharging power and storage capacity of the CCES. Consequently, this elevates the wind power absorption ratio.
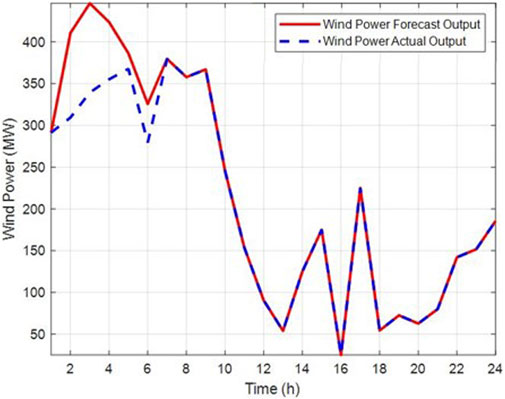
Figure 8. Wind power actual scheduling results with CCES.

Figure 9. Typical daily energy storage status.
Compared to traditional electrochemical energy storage, the state of charge (SOC) of a CCES system must consider both the pressure limits of the gas storage chamber and the maximum heat storage limits of the thermal storage system. To represent the SOC curve of a CCES, it is necessary to construct a dual-state curve of gas storage SOC and thermal storage SOC. The gas storage SOC is defined as the ratio of the mass of gas in the high-pressure storage chamber to the maximum storage mass, while the thermal storage SOC is defined as the ratio of the current heat storage amount to the maximum heat storage amount in the thermal storage system.
Figure 10 illustrates the changes in SOC within a single energy storage cycle under rated conditions for a compressed carbon dioxide energy storage system. Throughout the scheduling cycle, the maximum energy storage capacity of the system is constrained by both the pressure limits of the gas storage chamber and the heat limits of the thermal storage system. During the discharge process, the gas storage SOC decreases more rapidly, with the maximum discharge capacity limited by the pressure of the gas storage chamber. Conversely, during the charging process, the thermal storage SOC increases more rapidly, with the maximum charging capacity constrained by the thermal storage limit. At the end of the scheduling cycle, the gas storage SOC returns to its initial state, allowing direct participation in the next cycle. The thermal storage system retains excess heat due to the heat absorption during the compression and charging process exceeding the heat release during the expansion and discharging process.
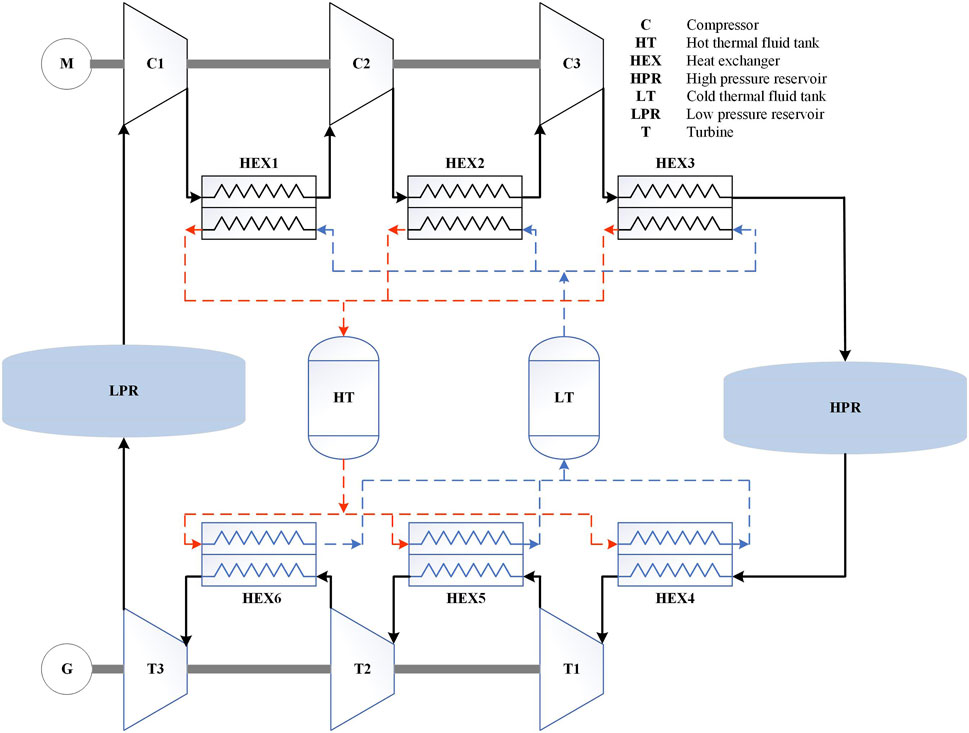
Figure 10. Schematic diagram of carbon energy storage system.
In summary, the reasonable configuration of a compressed carbon dioxide energy storage station needs to consider both the pressure limit of the gas storage chamber and the maximum heat storage limit of the thermal storage system. Additionally, the excess heat in the thermal storage system during the charge-discharge process validates that the compressed carbon dioxide energy storage system can provide thermal load supply under combined heat and power operation. This scheme can effectively reduce the operational costs of cogeneration units and improve the overall economic efficiency of the system.
As shown in Table 3, in Case 1, due to the absence of storage units, the system is unable to absorb a significant amount of wind power during peak wind periods, leading to excessive wind curtailment penalties, particularly during initial 8 hours, when the curtailment reached 113 MW and 142 MW, respectively. Compared to Case 1, Case 2 sees reduced operating costs due to the participation of storage units in the dispatch. In Case 3, thanks to the high power and large capacity of the CCES station, wind curtailment is further reduced, and the system’s operating costs continue to decrease.
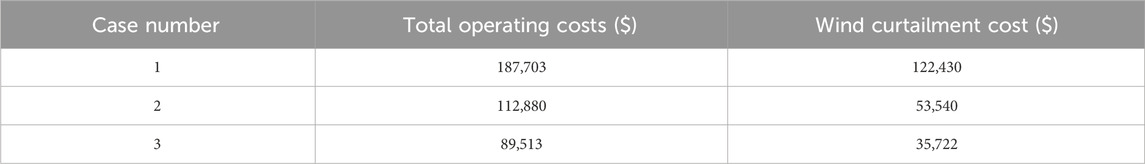
Table 3. Economic indicators.
This paper presents the system composition and operational framework of CCES system, including compressors, expanders, gas storage chambers, and thermal storage systems. It models the energy storage process, energy release process, thermal storage tank operation, and gas storage tank operation, respectively. A mixed integer programming approach is employed to establish the corresponding mathematical models, focusing on the optimal dispatch problem of power systems incorporating CCES. Case studies validate that under identical energy storage conditions, compared to CAES, the CCES system utilizing carbon dioxide as the working fluid possesses higher charging and discharging power and energy storage capacity. In power system optimization dispatch, it can maximize the absorption ratio of renewable energy, effectively reducing the operational costs of the system. As case study highlights the advantages of using CO₂ as a working fluid, there are also associated technical limitations. The large-scale geological sequestration of CO₂ is still under continuous development and improvement. The use of geological sequestration as a gas storage chamber is currently only studied theoretically and requires further validation in actual engineering applications. Additionally, due to the high-density characteristics of CO₂, existing compressors and expanders are mostly designed based on air. Therefore, the energy storage and discharge components suitable for CO₂ gas require further research.
The original contributions presented in the study are included in the article/supplementary material, further inquiries can be directed to the corresponding author.
RD: Writing–original draft, Writing–review and editing. XW: Writing–original draft, Writing–review and editing. WQ: Writing–original draft, Writing–review and editing. YY: Writing–original draft, Writing–review and editing, Conceptualization, Investigation, Software, Data curation, Formal Analysis, Funding acquisition, Methodology, Project administration, Resources, Supervision, Validation, Visualization. HX: Writing–original draft, Writing–review and editing, Data curation, Methodology, Supervision, Conceptualization, Formal Analysis, Funding acquisition, Investigation, Project administration, Resources, Software, Validation, Visualization. YG: Writing–original draft, Writing–review and editing, Formal Analysis, Project administration, Validation, Conceptualization, Data curation, Funding acquisition, Investigation, Methodology, Resources, Software, Supervision, Visualization. ZZ: Writing–original draft, Writing–review and editing, Formal Analysis, Project administration, Validation, Conceptualization, Data curation, Funding acquisition, Investigation, Methodology, Resources, Software, Supervision, Visualization. JH: Writing–review and editing.
The author(s) declare that financial support was received for the research, authorship, and/or publication of this article. This work was supported by State Grid Corporation of China (No. 5100-202214502A-3-0-SF).
Authors RD, XW, WQ, YY, HX, and YG were employed by State Grid Jibei Electric Power Co., Ltd.
The remaining authors declare that the research was conducted in the absence of any commercial or financial relationships that could be construed as a potential conflict of interest.
The authors declare that this study received funding from State Grid Corporation of China. The funder had the following involvement in the study: Study design, data collection and the writing of this article.
All claims expressed in this article are solely those of the authors and do not necessarily represent those of their affiliated organizations, or those of the publisher, the editors and the reviewers. Any product that may be evaluated in this article, or claim that may be made by its manufacturer, is not guaranteed or endorsed by the publisher.
Bartela, Ł., Skorek-Osikowska, A., Dykas, S., and Stanek, B. (2021). Thermodynamic and economic assessment of compressed carbon dioxide energy storage systems using a post-mining underground infrastructure. Energy Convers. Manag. 241, 114297. doi:10.1016/j.enconman.2021.114297
Cavallo, A. J. E. (2001). Energy storage technologies for utility scale intermittent renewable energy systems. J. Sol. Energy Eng. 123 (4), 387–389. doi:10.1115/1.1409556
Crotogino, F., Mohmeyer, K.-U., and Scharf, R. J. O. (2001). “Huntorf CAES: more than 20 years of successful operation,” in Solution mining research institute (SMRI) spring meeting. Orlando. FL.
Dou, X., Wang, Y., Ciais, P., Chevallier, F., Davis, S. J., Crippa, M., et al. (2022). Near-real-time global gridded daily CO2 emissions. Innovation 3 (1), 100182. doi:10.1016/j.xinn.2021.100182
Han, J., Wang, J., He, Z., An, Q., Song, Y., Mujeeb, A., et al. (2023). Hydrogen-powered smart grid resilience. Energy Convers. Econ. 4 (2), 89–104. doi:10.1049/enc2.12083
Jiang, K., Wang, P., Wang, J., and Liu, N. (2022). Reserve cost allocation mechanism in renewable portfolio standard-constrained spot market. IEEE Trans. Sustain. Energy 13 (1), 56–66. doi:10.1109/tste.2021.3103853
Liu, H., He, Q., Borgia, A., Pan, L., and Oldenburg, C. M. (2016). Thermodynamic analysis of a compressed carbon dioxide energy storage system using two saline aquifers at different depths as storage reservoirs. Energy Convers. Manag. 127, 149–159. doi:10.1016/j.enconman.2016.08.096
Liu, Z., Cao, F., Guo, J., Liu, J., Zhai, H., and Duan, Z. (2019). Performance analysis of a novel combined cooling, heating and power system based on carbon dioxide energy storage. Energy Convers. Manag. 188, 151–161. doi:10.1016/j.enconman.2019.03.031
Liu, Z., Yang, X., Jia, W., Li, H., and Yang, X. J. J. o. E. S. (2020). Justification of CO2 as the working fluid for a compressed gas energy storage system: a thermodynamic and economic study. J. Energy Storage 27, 101132. doi:10.1016/j.est.2019.101132
Morandin, M., Maréchal, F., Mercangöz, M., and Buchter, F. (2012). Conceptual design of a thermo-electrical energy storage system based on heat integration of thermodynamic cycles–Part B: alternative system configurations. Energy 45 (1), 386–396. doi:10.1016/j.energy.2012.03.033
Ti, B., Wang, J., Li, G., and Zhou, M. (2022). Operational risk-averse routing optimization for cyber-physical power systems. CSEE J. Power Energy Syst. 8 (3), 801–811. doi:10.17775/CSEEJPES.2021.00370
Wang, J., An, Q., Zhao, Y., Pan, G., Song, J., Hu, Q., et al. (2023). Role of electrolytic hydrogen in smart city decarbonization in China. Appl. Energy 336, 120699. doi:10.1016/j.apenergy.2023.120699
Wang, J., Wu, Z., Du, E., Zhou, M., Li, G., Zhang, Y., et al. (2020). Constructing a V2G-enabled regional energy Internet for cost-efficient carbon trading. CSEE J. Power Energy Syst. 6 (1), 31–40. doi:10.17775/CSEEJPES.2019.01330
Wang, M., Zhao, P., Wu, Y., and Dai, Y. (2015). Performance analysis of a novel energy storage system based on liquid carbon dioxide. Appl. Therm. Eng. 91, 812–823. doi:10.1016/j.applthermaleng.2015.08.081
Wang, S., Sun, P., Zhang, G., Gray, N., Dolfing, J., Esquivel-Elizondo, S., et al. (2022). Contribution of periphytic biofilm of paddy soils to carbon dioxide fixation and methane emissions. Innovation 3 (1), 100192. doi:10.1016/j.xinn.2021.100192
Xu, M., Zhao, P., Huo, Y., Han, J., Wang, J., and Dai, Y. (2020). Thermodynamic analysis of a novel liquid carbon dioxide energy storage system and comparison to a liquid air energy storage system. J. Clean. Prod. 242, 118437. doi:10.1016/j.jclepro.2019.118437
Yu, Y., Wang, J., Chen, Q., Urpelainen, J., Ding, Q., Liu, S., et al. (2023). Decarbonization efforts hindered by China’s slow progress on electricity market reforms. Nat. Sustain. 6, 1006–1015. doi:10.1038/s41893-023-01111-x
Zhang, H., Liang, S., Wu, K., Qiu, Y., Cai, Y., Chan, G., et al. (2022). Using agrophotovoltaics to reduce carbon emissions and global rural poverty. Innovation 3 (6), 100311. doi:10.1016/j.xinn.2022.100311
Keywords: utility-scale energy storage, modeling, scheduling, renewable coordination, compressed carbon dioxide
Citation: Ding R, Wang X, Qiu W, Yao Y, Xu H, Geng Y, Zhuo Z and Han J (2024) Modeling and scheduling of utility-scale energy storage toward high-share renewable coordination. Front. Energy Res. 12:1445092. doi: 10.3389/fenrg.2024.1445092
Received: 06 June 2024; Accepted: 29 July 2024;
Published: 13 September 2024.
Edited by:
Yang Gao, Shanghai Jiao Tong University, ChinaReviewed by:
Junjun Xu, Nanjing University of Posts and Telecommunications, ChinaCopyright © 2024 Ding, Wang, Qiu, Yao, Xu, Geng, Zhuo and Han. This is an open-access article distributed under the terms of the Creative Commons Attribution License (CC BY). The use, distribution or reproduction in other forums is permitted, provided the original author(s) and the copyright owner(s) are credited and that the original publication in this journal is cited, in accordance with accepted academic practice. No use, distribution or reproduction is permitted which does not comply with these terms.
*Correspondence: Jiayi Han, MjIwMTIxMzM1MEBzdHUucGt1LmVkdS5jbg==
Disclaimer: All claims expressed in this article are solely those of the authors and do not necessarily represent those of their affiliated organizations, or those of the publisher, the editors and the reviewers. Any product that may be evaluated in this article or claim that may be made by its manufacturer is not guaranteed or endorsed by the publisher.
Research integrity at Frontiers
Learn more about the work of our research integrity team to safeguard the quality of each article we publish.