 Xiping Ma
 Yanpeng Jin
 Jinju Li
 Wenxi Zhen
 Rui Xu
 Ge Cao
- 1School of Electrical Engineering, Xi’an University of Technology, Xi’an, China
- 2Electric Power Research Institute, State Grid Gansu Electric Power Company, Lanzhou, China
- 3Faculty of Geomatics, Lanzhou Jiaotong University, Lanzhou, China
With the increasing penetration of electric vehicles (EVs) in road traffic, the spatial and temporal stochasticity of the travel pattern and charging demand of EVs as a mode of transportation and an electrical load have generated different degrees of congestion impacts on both the power grid and the transportation network. Based on this, this paper proposes a power–transportation-coupled distribution network optimization strategy based on stochastic user traffic equilibrium theory. First, a stochastic user equilibrium-mixed traffic flow allocation model that expresses user non-completely rational path selection behavior is established, and the traffic flow equilibrium solution is obtained using an improved method of successive algorithm and mapped to charging loads. Second, a distribution network power flow optimization model under the coupled power–transportation architecture is established to optimize the operation state of the distribution network by combining distributed resources such as energy storage, demand response loads, wind power, photovoltaic, and gas turbines.
1 Introduction
With the implementation of China’s new energy vehicle development strategy, China’s electric vehicle market scale continues to expand; in 2023, China’s new energy vehicle production and sales were 9.587 million units and 9.495 million units, respectively, with a year-on-year growth of 35.8% and 37.9%, and the new energy vehicle market penetration rate reached 31.6%, which is 5.9% points higher than that in 2022. Production and sales have ranked first in the world for 9 consecutive years, accounting for more than 60% of global sales. By the end of 2023, China’s new energy vehicle ownership of 20.41 million accounted for 6.07% of the total number of vehicles (PRC National Development and Reform Commission, 2024). The popularity of electric vehicles (EVs) in people’s daily life is getting higher and higher. Electric vehicles have the dual identity of transportation and electric load, and the increasing number of electric vehicles makes the coupling relationship between the road network and the power distribution network deeper and deeper. First, the spatiotemporal disordered access of a large number of electric vehicle charging loads to the distribution network and conventional loads superimposed will result in the superposition of the total peak load of the distribution network, resulting in increased load fluctuations within the grid, aggravating the pressure on the grid supply of electricity (Veldman and Verzijlbergh, 2015). Second, the distribution of charging stations on the road network and the charging capacity will affect the user travel behavior. If the electric vehicle users need to charge and choose the road with more traffic, it will lead to an unbalanced distribution of traffic on the road network, resulting in an increase in the cost of time to pass in the road network (Wei et al., 2018). In addition, a large number of electric vehicles with charging needs are concentrated in a charging station waiting for charging response due to the capacity limitations to the charging station, resulting in queuing and congestion, which not only brings bad service experience to the user but also aggravates the burden of the power distribution node of the charging station. In this context, the coupled electric power–transportation system has been the subject of extensive scholarly attention and research.
In recent years, many studies have been conducted on the cooperative optimization of the two networks under power-transportation coupling. HE et al. (2013) explored the use of wireless power transmission technology to achieve integrated pricing transmission technology for electricity and roads. WEI et al. (2017) optimized the traffic distribution in electric traffic coupling networks by charging congestion fees on electrified roads by independent operators with the aim of minimizing social costs. Zhang Hengrong et al. (2024) identified the location and scale of electric vehicle fast charging stations, distributed photovoltaic generation, and renewable power supply through multi-objective integer planning to increase electric vehicle adoption and reduce emissions caused by transportation and power systems. Considering the fact that power and transportation systems often operate independently in reality, many papers have introduced distributed solving algorithms, such as the pairwise solution (ALIZADEH et al., 2017), alternating direction multiplier method (GENG et al., 2019), optimality condition solution (ZHOU et al., 2020a), and Benders solution (SUN et al., 2019), to protect the privacy of the data on both sides of the network. XIE et al. (2023a) studied the optimization of distributed coefficients for multi-district power–transportation coupling networks. In the coupled power–transportation system, the traffic distribution model established in the current mainstream literature mainly consists of macroscopic network characteristics at the physical level and microscopic user decision-making characteristics at the social level, which can be classified into static, semi-dynamic, and dynamic models according to the network characteristics. Dynamic models are used for the time scales of 15 min, semi-dynamic models are used for the time scales of 15–90 min, and static models are used for the time scales of more than 90 min. According to the decision-making characteristics of the user, it can be divided into user equilibrium (UE) and system optimization (SO). UE describes that the costs on all the paths actually used are equal and smaller than the costs borne by individual vehicles on any unused paths, and SO describes that all the vehicles show cooperative behaviors in choosing the routes, and the costs of the whole transportation system are minimized. Yan et al. (2022) summarized the various types of traffic models with the integration of the two characteristics. Shiwei et al. (2024) adopted the static traffic model to establish a two-layer game model of the power–transportation network considering demand elasticity and adopted the proposed variational inequality to solve the problem. ZHOU et al. (2020b), in the study of the power–transportation multi-time period collaborative pricing problem, used the semi-dynamic model to describe the traffic propagation between adjacent time periods, and the traffic propagation residual flow effect was transformed into a part of the objective function to form a convex optimization for solving. XIE et al. (2022) introduced a two-way wave model and a point queue model to describe the dynamic charging and queuing process in a charging station, established a traffic model with dynamic equilibrium for mixed users, and solved it based on a dynamic network loading algorithm.
Currently, the research on the optimization of the coupled operation of two networks is mainly based on the principle of user equilibrium. The user equilibrium criterion starts from the assumption of individual rational self-interested decision-making that “each vehicle aims to minimize its own travel costs.” Eventually, the traffic flow in the network will reach an equilibrium state, and the result of traffic allocation can be expressed as Wardrop’s first law: for each origin–destination (OD) pair, the access cost on all the paths (with traffic flow greater than 0) that it actually uses is equal, and it is smaller than the access cost on any unused path (with traffic flow equal to 0). Most researchers consider two networks managed by the same central system based on the principle of user equilibrium and establish an optimization model to minimize the total social cost by sharing the data. WEI et al. (2017) developed a mixed-integer, second-order conic power distribution network optimization model under traffic–user equilibrium by setting a road congestion charge to the users and minimizing the operating costs of the two networks as the objective function. LV et al. (2021) established a cooperative demand response model for electricity transportation based on user equilibrium to improve dual-grid congestion by considering multi-travel time slot choices of users and incorporating the flexible load scheduling decisions of the aggregator. ZHOU et al. (2020a) and XIE et al. (2023b) demonstrated from different perspectives, such as optimality condition decomposition and variational inequality, that under the mechanism of the distributed interaction of power and transportation through node marginal tariffs, the operation of the two networks can naturally reach the state of minimizing the operating cost of the power grid and the cost of transportation access.
However, the principle of conventional UE only considers the user rational choice of paths based on time cost, but in reality, users cannot accurately make rational judgments on path selection. Only a few studies have introduced stochastic user equilibrium (SUE) into the study of power–transportation coupling, and ZHOU et al. (2021) analyzed the characteristics of this stochastic user equilibrium from the perspective of a potential game. Qiu et al. (2021) introduced the stochastic user equilibrium model into the charging station planning problem. In addition, the coupled electric power–transportation system still has the uncertainty of the physical link and the perceptual decision-making of the user, and with the increase in the penetration rate of electric vehicles and the proportion of wind–scenery allocation, the distribution grid still needs to be optimized using other flexibility resources to optimize and adjust the power distribution network to solve the ensuing voltage overruns, load fluctuations, and a series of other problems and to ensure the safe and stable operation of the distribution network. In the problem of uncertainty in the physical link, there are related research studies working from stochastic optimization. Leng et al. (2023) proposed a stochastic planning method for the coordinated operation of distributed energy sources in an unbalanced active distribution network, which effectively reduces the system cost and achieves the synergistic optimization of active and reactive power. Li et al. (2021) proposed a risk-averse approach for the deployment of a residential multi-energy microgrid HES, which uses a multilevel self-adaptive stochastic optimization method, which effectively improves the system equivalent daily profit and is more immune to uncertainty. Li et al. (2022) discussed a coordinated two-layer operation scheme for multi-energy building microgrids with integrated uncertainty sources and established a stochastically weighted robust optimization two-layer model of multi-energy building microgrids that considers the actual thermal load and battery degradation, obtaining economical operating instructions, high computational performance, and uncertainty immunity. In summary, the contributions of this paper are described below:
1 In order to better describe the irrational choice behavior of EV users with charging demand for paths in the transportation system, this paper introduces the random utility theory based on the user equilibrium model (Sheffi and Powell, 1982), which assumes that users are finite rationality when choosing paths and charging stations, so that the probability of users’ choosing charging stations and paths follows some kind of distribution, which reflects the bias due to the perception of the information on the road network, which, in turn, leads to the fact that users do not necessarily always choose the path with the lowest access cost, which is more in line with realistic driving needs (Huang and Bell, 1998; Maher, 1998; Du et al., 2019).
2 In order to optimize the distribution network node overload and voltage overrun due to the increase in EV penetration and photovoltaic (PV) ratio in the coupled power–transportation network, this paper introduces a dynamic time-of-use tariff system in the coupled power–transportation system and optimizes the scheduling of the distribution network by considering flexibility resources such as energy storage, demand response loads, wind, PV, and gas turbines, and the two networks are coupled through charging stations and improve the operation status of the two networks by proposing the interaction of charging costs and path costs.
2 Optimization architecture for power–transportation coupled distribution grids based on stochastic user effects
Unlike other energy networks, EVs, as the main body of the transportation network, are not physical devices that can be directly dispatched but are controlled by the travel behaviors of individual EV users. Therefore, the traffic flow and charging loads in the coupled power–transportation network are usually determined by the micro-behaviors and charging decisions of a large number of EV users under the influence of external information, and due to the complex socialization characteristics embedded in them, to exploit its flexibility, multiple units such as transportation departments, power grid companies, and charging operators must be united to optimize the interaction of EV users and their other grid devices through information systems.
In order to facilitate the management and data sharing and, at the same time, protect the data privacy of various departments and users, this paper assumes the existence of a non-profit government organization through the optimal results of the model solution to the two networks to issue scheduling instructions to achieve the macro-control of the entire system. The coupled power–transportation system is coupled through charging stations, and the optimal road traffic flow distribution and charging load distribution are first found through a traffic equilibrium model under the interaction of charging cost and path cost. Then, the dynamic time-sharing tariff is set according to the load state of the distribution network to establish an optimization model to adjust the optimal generator output and flexibility resource response. Eventually, under the interactive regulation of the two networks, the operation status of the two networks reaches the optimal state, as shown in Figure 1.
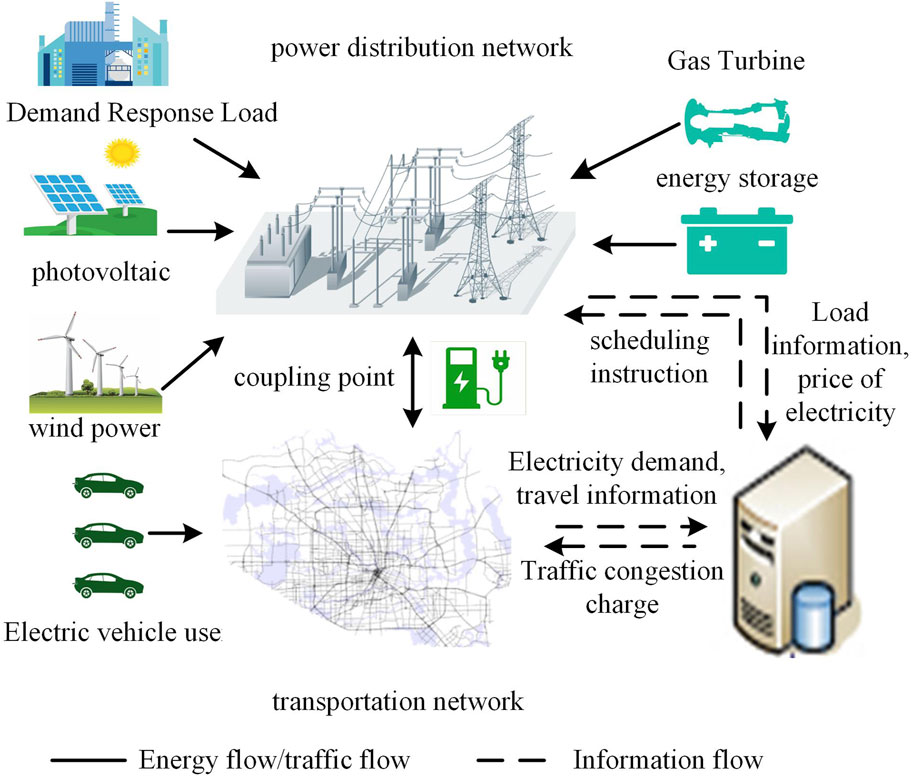
Figure 1. Power–transportation coupling optimization system architecture.
3 Stochastic user-equilibrium traffic-flow assignment model
In order to analyze the macroscopic spatiotemporal distribution of traffic flow and charging load, the OD pair analysis is used to aggregate the travel-charging demand of vehicles departing from and arriving at similar regions in the same time period into the same OD pair, and the distribution of traffic flow and charging load in the network is finally obtained based on the path selection of the OD pair group. In order to estimate the traffic demand more accurately, this paper adopts the great likelihood estimation method for OD matrix estimation.
First, the average travel speed data provided by the car navigation system can be used to obtain the road section traffic flow by using the road section travel time function, which is a function that describes the relationship between the road section traffic flow and the road section travel time. The road section traffic flow can be derived by taking the inverse function of the road section travel time function through the road section travel time query API provided by the navigation software company. However, the road section traffic flow does not accurately reflect the traffic demand, so this method uses the great likelihood estimation to estimate the OD matrix. The basic idea of the method is to find an OD distribution that maximizes the probability of observing the corresponding traffic flow samples. The formula is shown in Equation 1 (Feng et al., 2023):
where P is the path selection probability matrix, the path is the set of road segments connecting the starting and ending points, O is the one-dimensional OD vector obtained by transforming the OD matrix, tr is the traffic flow vector, Λ is the diagonal matrix with diagonal elements P'O, and A is the path-road segment correlation matrix, and Aij = 1 if the road segment i is a part of the path j. N is the number of samples, K is the set of paths, and k denotes the path.
The OD matrix can be obtained by obtaining the traffic flow with maximum probability, and then, the Markov Monte Carlo method (Feng et al., 2023) is used to simulate the behavior of EVs to determine the number of EVs choosing charging at different time intervals. The Monte Carlo sampling of the departure time, travel time, and departure SOC of each EV is carried out, and the state and state transfer probability of each EV in each time interval are obtained by simulation. The number of EVs with fast charging needs is derived from Equation 2, and the path selection and traffic flow distribution of these EVs on different paths and different charging stations can be solved based on the stochastic user-equilibrium traffic flow model developed later.
where
To establish a traffic flow distribution model, first, the topology of the traffic network is defined and represented by G = [N,A], where N is the node set of the traffic network, N = Nr∩Nc, Nr is the regular road node, and Nc is the road node containing charging stations; A is the line set, which represents the road sections in the actual traffic. Virtual road sections are introduced on the basis of the traffic network, and the virtual road section impedance function is established to describe the charging queuing behavior of the charging stations. On the basis of the traffic network, a virtual road section is introduced, and a “virtual road section impedance function” is established to describe the charging queuing behavior of charging stations, A = Ar∩Ac, Ar is the road section without charging stations, and Ac is the virtual road section describing the charging stations. The set of paths contained in a certain OD pair is Kod; the road section impedance function is calculated by using a function of the Bureau of Public Roads as shown in Equation 3, and the virtual roadway section is described using a Davidson function developed based on queuing theory:
where xa,t and ca are the traffic flow and roadway capacity of roadway section a at time t, respectively; τa,t and
In the traffic flow distribution model, Equations 4–6 need to be satisfied:
where
All road travelers in a transportation network have stochastic path selection behavior, i.e., they always try to find the path with the smallest travel cost to travel, but the travel cost of each path is usually not accurately estimated due to the influence of individual finite rational behavior. Thus, the stochastic user equilibrium model refers to the assumption that “all traffic in the network will eventually reach equilibrium under the assumption of individual imperfectly rational self-interested decision-making, where each vehicle aims to minimize its own perceived travel costs.” This method uses a Logit-based random utility model to determine the probability of a user choosing a travel path. The probability of path k at time period t is shown in Equation 7:
where
It has been proved that the traffic flow model with stochastic user equilibrium belongs to a nonlinear complementary problem (Beckmann et al., 1956) (Sheffi, 1985), which can be transformed into a convex optimization model according to the Karush–Kuhn–Tucker condition as shown in Equation 8:
where Sod is the minimum expected travel cost between OD pairs.
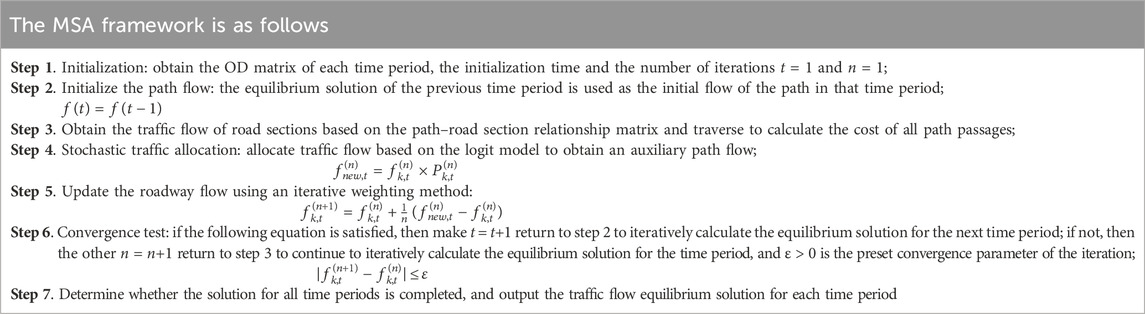
Since the above objective function and the pavement impedance function in the constraints are nonlinear, solving their optimization problems using common commercial solvers requires segmental linearization, but this introduces a large number of new variables, leading to an increase in the efficiency and difficulty of the solution. This method adopts the improved method of successive algorithm (MSA) for the stochastic user equilibrium of semi-dynamic traffic model solving. The main idea of this method is to average a series of auxiliary points in the iterative process, where each iteration point is obtained by solving the auxiliary planning problem, which, in turn, is based on the auxiliary of the previous iterative process. The advantage is that in the process of each iteration, there is no need to solve the linear search problem, and the iteration step is pre-determined, so the MSA is simple and commonly used in the field of transportation research to solve the stochastic user equilibrium model.
4 Distribution network model under coupled power–transportation
By means of charging stations in the coupled power–transportation network, EVs realize the conversion of traffic flows to charging loads based on the traffic flow distribution model given in Section 3. The overall process structure is shown in Figure 2. Affected by the spatial distance, each charging station is powered by the nearest distribution node, thus coupling the transportation node and the distribution node and mapping to the node charging load through the traffic flow and then to the node charging load. Its linear mapping relationship can be expressed as shown in Equation 9:
where
Figure 2. Charging load calculation process.
The load power
where
The tidal current constraint is the most fundamental constraint for active distribution networks. Conventional tidal equations are nonlinear nonconvex equational constraints that contain delta functions in addition to product terms, as shown in Equation 11:
where Vi and Vj are the voltage amplitudes of node i and node j, respectively; Pi and Qi are the active and reactive power injected at node i, respectively; n denotes all the branches connected to i; Gij and Bij are the real and imaginary parts of the elements of the ith and jth rows and columns of the node conductance matrix, respectively; and θij is the difference in the phase angle of the voltages at nodes i and j. The distribution network current model in this paper uses the DistFlow current model, as shown in Equation 12:
where Pij,t denotes the active and reactive power flowing into the first end of line ij at time t; rij and xij are the resistance and reactance of line ij, respectively; Pjk,t and Qjk,t denote the active and reactive power flowing out of node j at time t, respectively; the left side of the equation denotes the sum of power injected into node j; and the right side of the equation denotes the sum of power flowing out of node j. Pj,t and Qj,t are the node injected power, which contains the injected power of interruptible loads, gas turbine, distributed PV, wind turbines, energy storage, and loads, and the loads contain conventional and charging loads, as shown in the previous section. It is shown in Equation 13:
where
The voltage–current equation for the branch ij is constrained as shown in Equation 14:
where Uj,t and Iij,t are the amplitude of the voltage at node j and the current at branch ij, respectively. Among the above constraints, the power flow constraint is a quadratic equality form and does not belong to the solution category of convex optimization. To this end, this chapter uses second-order cone programming (SOCP) to convexly relax the power flow equality constraints, so that the above model can be solved in polynomial time, as shown in Equation 15:
In summary, the power balance equation constraints and voltage–current constraints can be converted as shown in Equation 16:
where Umin and Umax indicate the minimum and maximum values allowed for the node voltage in the operation, respectively; Imax denotes the line current in the operation of the maximum value allowed.
The output of the gas turbine should satisfy a number of constraints, and it should not exceed its allowable range during operation. Climbing constraints should also be considered. It is shown as shown in Equation 17:
where
The energy storage output should not only satisfy the upper and lower limits of its power output but also satisfy the constraints of capacity and state of charge in order to minimize the damage of deep charging and discharging of energy storage to the battery life. It is shown as shown in Equation 18:
where
PV and wind power outputs need to meet the constraints constraints of Equation 19:
where
Demand response load refers to a type of electric load that can be adjusted to the needs of the system. It is a flexible load that can be adjusted to the needs of the power system in order to better match the balance between supply and demand. Demand response loads play an important role in improving power system reliability, reducing energy costs, and promoting the use of renewable energy. This paper adopts an incentive-based demand-response load model, which mainly considers the participation of interruptible loads in scheduling, and its purpose is to selectively cut off all or part of the interruptible loads when the power system relying on the ramping capacity of various types of power supply units fails to satisfy the demand for peak shifting so as to guarantee the balance between the active power supply and demand of the system. The interruptible contract signed in advance between the power supply company and the relevant load users is the realization of interruptible load participation in scheduling, and when the load is interrupted, this part of the users can obtain certain economic compensation. The operation of the demand response load needs to satisfy the constraints as in Equation 20:
where T is the scheduling period,
Based on the power–transportation coupling architecture, in order to ensure the reliable operation of the distribution network, optimize the distribution network node load distribution, and channel the distribution network node load congestion problem caused by the uncontrolled charging of EVs, the objective function is established as shown in Equation 21:
where an and bn are the primary and secondary cost coefficients of the gas turbine, respectively;
As shown in Figure 3, the time-sharing tariff model is established on the basis of equivalent load. When the equivalent load is higher than the sum of the mean value and σ times the difference between the peak and valley, it is the peak period. When it is lower than the difference between the mean value and σ times the difference between peak and valley, it is the trough period, and the rest of the time is the flat period. The time-of-day tariff is expressed as shown in Equation 22:
where ρ0 is the tariff of the equivalent load in the usual period; σ is the range of up and down fluctuation of the tariff in the peak hour and the valley hour; Peq is the equivalent load; Pav,1 is the average value of the equivalent load; and Ph is the peak-to-valley difference of the equivalent load.
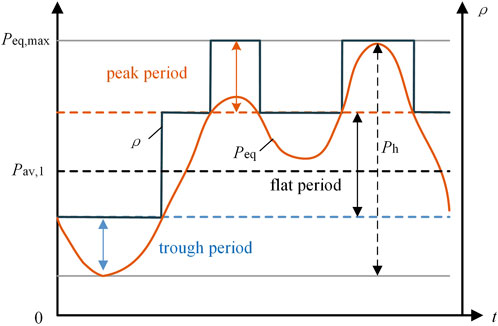
Figure 3. Dynamic time-sharing electricity prices.
5 Case study
5.1 Date settings
The modified IEEE33 node system and Nguyen transportation network coupling topology is shown in Figure 4. The power distribution network rated voltage is 12.66 kV; the base power is 10 MVA; nodes 7, 8, 24, and 25 are the daily peak load nodes; and a certain percentage of the demand response loads is set up. Node 18 is the storage node, and the upper and lower limits of the energy storage loading state are set to 0.2 and 0.8, respectively; node 28 is a photovoltaic power plant; node 14 is a wind turbine; and nodes 16, 20, and 32 are electric vehicle charging stations in the coupling network. Other parameters are set as follows: an = 0.024, bn = 85, and π = 105. Voltage magnitude boundaries are Umin = 0.95 and Umax = 1.05 (all are standardized values), the gas turbine power boundary is Pg max = 500 kw, and the creep rate is 200 kw/h. The time-of-day electricity price is as shown in Table 1. All simulations in this paper are based on the MATLAB platform, using the MSA to solve the stochastic traffic equilibrium model to obtain the equilibrium state of the traffic flow, through the coupling point converted into charging station power. The distribution network optimization model is solved by invoking the commercial solver GUROBI in MATLAB.
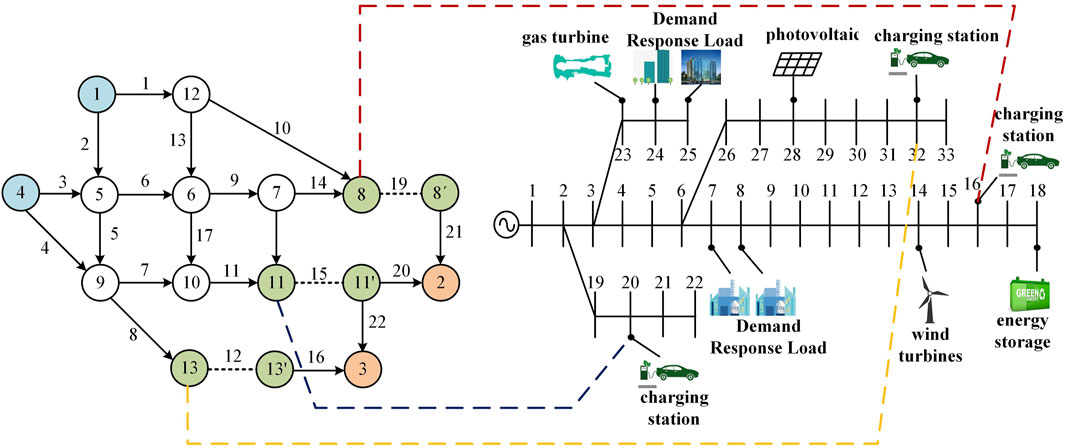
Figure 4. Power–transportation coupling network topology.
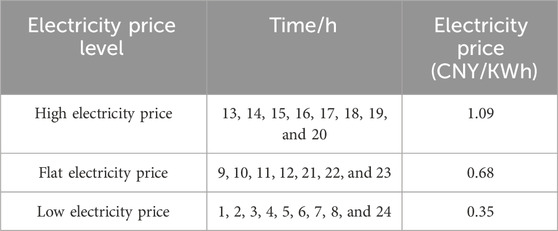
Table 1. Time-sharing electricity price.
5.2 Analysis of results
The flow problem is solved for each time period using the continuous iterative MSA to obtain the flow rate of the charging station in the random user equilibrium state, and the flow rate is converted into charging load by the charging coefficients. The results are shown in Figures 5, 6.
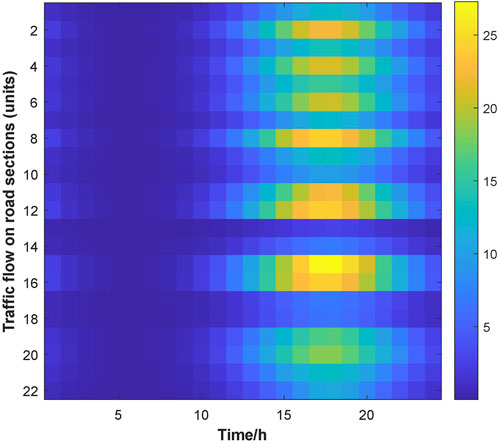
Figure 5. Traffic flow on road sections.
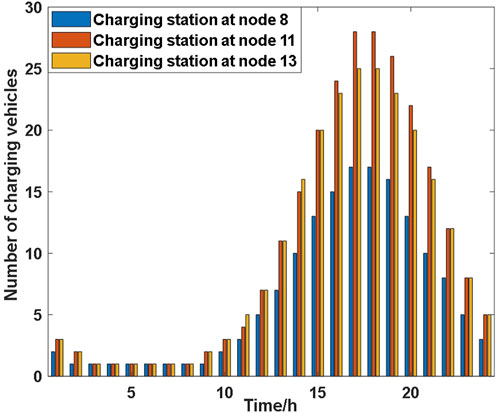
Figure 6. Vehicles being charged at the charging station.
By improving the traditional MSA for single-time period static traffic equalization, i.e., initializing the flow rate of the paths before the start of each time period iteration, so that the equilibrium solution (roadway flow) of the previous time period is used as the initial flow rate of the next time period, due to the continuity of the roadway flow in adjacent time periods of the actual road section and the small rate of change of the traffic flow of the adjacent time periods, we screened out eight paths belonging to the OD pair of 1 for analysis; Figures 7, 8 show that only when t = 1, the number of iterations is more and when t = 2, after two iterations have been completely converged, so the convergence speed of the method is faster than initializing different traffic flows in each time period, which improves the speed of solving the traffic equilibrium problem.
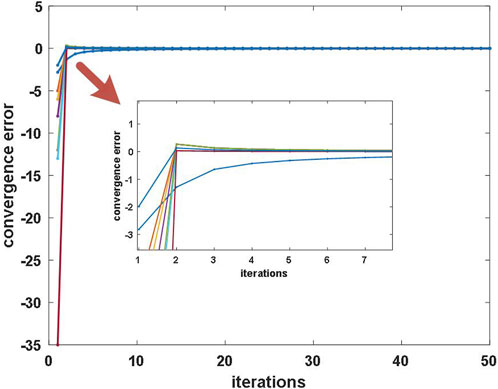
Figure 7. OD converges for all paths of 1 at t = 1.
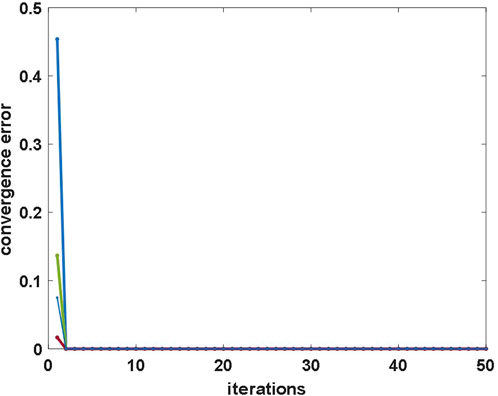
Figure 8. OD converges for all paths of 1 at t = 2.
As can be seen in the power balance shown in Figure 9, a large number of electric vehicles and grid charging will lead to the distribution network peak stacking situation. As the peak price of electricity is relatively higher, the upper level of the economic cost of purchasing power will be increased significantly, and a high proportion of the load access will make the grid voltage decrease too large to affect the safety and reliability of its operation. Therefore, the power balance of the electric vehicles can be optimized. Based on the introduction of gas turbines, energy storage, and demand-response loads to optimize the adjustment under the time-sharing tariff system, it can be seen from the figure that the new energy power is absorbed by the comprehensive use of energy storage and demand response loads during the time when the new energy power is large and released during the time when the new energy power is low, which ensures that the power balance of the system reduces the amount of power purchased by the superior grid and improves the rate of new energy consumption.
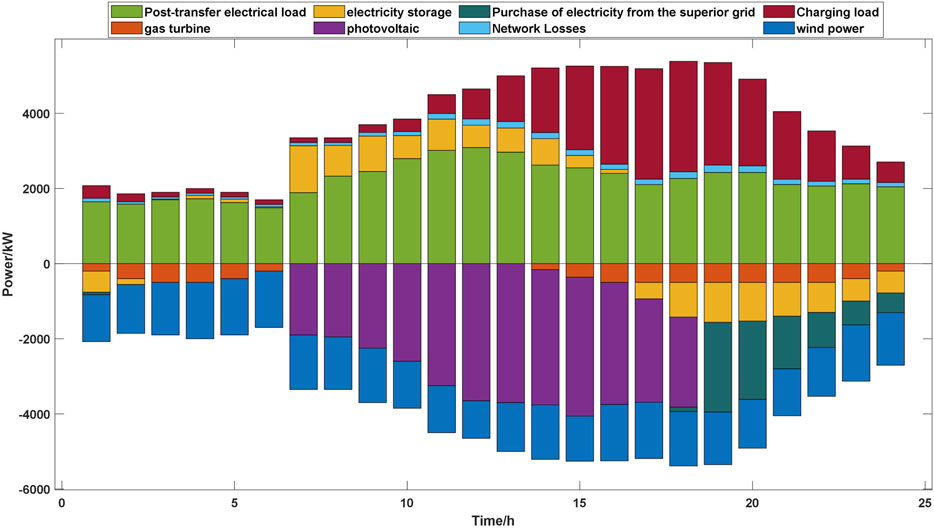
Figure 9. Power balance situation.
As shown in Figure 10, the demand response loads of high-load nodes 7, 8, 24, and 25 are no more than 30%, and the tariffs obtained according to the dynamic tariff model at the moments from 18 to 22 are high. In order to alleviate the excessive load-bearing burden on the distribution network due to the large amount of EV access charging, the demand loads are cut down more at these moments, and at the times when the tariffs are low and the charging loads are small, such as at the time periods from 7 to 8, the demand response load will be supplemented to maintain the demand response balance constraint of the system.
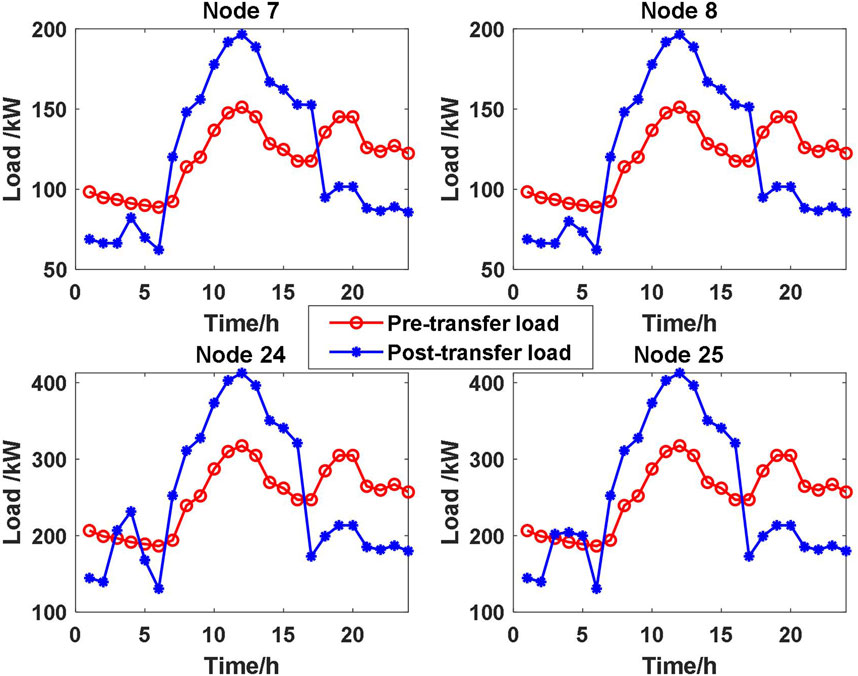
Figure 10. Demand-response load shifting.
As shown in Figure 11, energy storage is charged when the price of electricity is low and discharged at the peak load to supply power to the system to reduce the amount of power purchased from the upper level, reduce the cost of power purchase and voltage decrease, and improve the rate of new energy consumption.
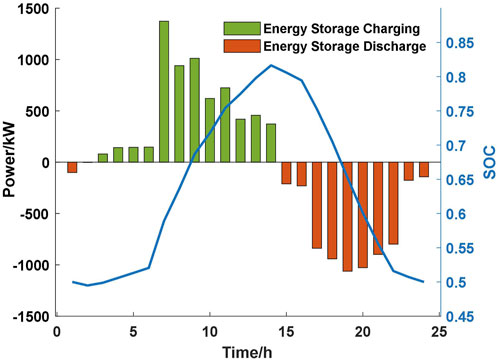
Figure 11. Energy storage charge and discharge.
In order to verify the accuracy of the second-order cone relaxation current model used in this paper, the error caused by the second-order cone relaxation inequality is calculated as follows:
where Gi,t is the error of line current at time t caused by the second-order cone relaxation at the ith node. The error at all nodes of the system is calculated according to Equation 23, and the results are shown in Figure 12. It can be found that the error at all nodes of the system is at the level of 10–6, which proves that the accuracy of the second-order cone relaxation distribution network current model adopted in this paper can meet the demand of distribution network scheduling.

Figure 12. Second-order cone relaxation error.
6 Conclusion
Aiming at the unbalanced distribution of traffic flow in the traffic road network and the spatiotemporal disorder of charging loads, the superposition of charging loads and conventional loads in the distribution network exacerbates the fluctuation of grid loads, which affects the safe and stable operation of the power grid. In this paper, a stochastic user effect-based optimization strategy for power–transportation-coupled distribution networks is proposed. First, a stochastic user equilibrium model considering EV charging is established based on the traffic flow distribution problem, and the traffic model is solved by combining the method of OD matrix estimation and Markov Monte Carlo simulation with the improvement of the successive averaging algorithm. Second, a distribution network trend optimization model under the coupled power traffic architecture is established, and the overall optimal scheduling of the distribution network model is performed by combining energy storage, demand response loads, wind power, photovoltaic, and gas turbines. Finally, an arithmetic example analysis is carried out on the improved coupled network model of distribution grid and transportation network, which realizes the mutual benefits of the grid and transportation network through the coordinated interaction of flexibility resources and the balanced allocation of traffic flows in the transportation network, effectively reduces the peak-to-valley difference of the grid load curve, reduces the operating cost of the system, and ensures the safe, reliable, and economic operation of the distribution network.
Data availability statement
The original contributions presented in the study are included in the article/Supplementary Material; further inquiries can be directed to the corresponding author.
Author contributions
XM: funding acquisition, project administration, and writing–review and editing. YY: writing–original draft and writing–review and editing. JL: writing–review and editing. WZ: writing–review and editing. RX: writing–review and editing. GC: methodology, project administration, and Writing–review and editing.
Funding
The author(s) declare that financial support was received for the research, authorship, and/or publication of this article. This study was supported by the Natural Science Foundation of Gansu Province (22JR11RA157) and the Science and Technology Project of State Grid Gansu Electric Power Company (52272223004A) (corresponding author: YanPeng YJ).
Conflict of interest
Authors XM, WZ, and RX were employed by State Grid Gansu Electric Power Company.
The remaining authors declare that the research was conducted in the absence of any commercial or financial relationships that could be construed as a potential conflict of interest.
The authors declare that this study received funding from Technology Project of State Grid Gansu Electric Power Company. The funder had the following involvement in the study: the design, collection, analysis and interpretation of data.
Publisher’s note
All claims expressed in this article are solely those of the authors and do not necessarily represent those of their affiliated organizations, or those of the publisher, the editors, and the reviewers. Any product that may be evaluated in this article, or claim that may be made by its manufacturer, is not guaranteed or endorsed by the publisher.
References
Alizadeh, M., Wai, H. T., Chowdhury, M., Goldsmith, A., Scaglione, A., and Javidi, T. (2017). Optimal pricing to manage electric vehicles in coupled power and transportation networks. IEEE Trans. Control Netw. Syst. 4 (4), 863–875. doi:10.1109/tcns.2016.2590259
Beckmann, M., McGuire, C., and Winsten, C. (1956). Studies in the economics of transportation. New Haven, CT: Yale University Press.
Du, Y. C., Yu, S. C., Meng, Q., and Jiang, S. C. (2019). Allocation of street parking facilities in a capacitated network with equilibrium constraints on drivers’ traveling and cruising for parking. Transp. Res. Part C Emerg. Technol. 101, 181–207. doi:10.1016/j.trc.2019.02.015
Feng, J., Hu, Z., and Duan, X. (2023). EV fast charging station planning considering competition based on stochastic dynamic equilibrium. IEEE Trans. Industry Appl. 59 (3), 3795–3809. doi:10.1109/TIA.2023.3235343
Geng, L. J., Lu, Z. G., He, L. C., Zhang, J., Li, X., and Guo, X. (2019). Smart charging management system for electric vehicles in coupled transportation and power distribution systems. Energy 189, 116275. doi:10.1016/j.energy.2019.116275
He, F., Y In, Y. F., and Zhou, J. (2013). Integrated pricing of roads and electricity enabled by wireless power transfer. Transp. Res. Part C Emerg. Technol. 34, 1–15. doi:10.1016/j.trc.2013.05.005
Huang, H. J., and Bell, M. G. H. (1998). A study on logit assignment which excludes all cyclic flows. Transp. Res. Part B Methodol. 32 (6), 401–412. doi:10.1016/s0191-2615(98)00008-3
Leng, R., Li, Z., and Xu, Y. (2023). Two-stage stochastic programming for coordinated operation of distributed energy resources in unbalanced active distribution networks with diverse correlated uncertainties. J. Mod. Power Syst. Clean Energy 11 (1), 120–131. doi:10.35833/MPCE.2022.000510
Li, Z., Wu, L., Xu, Y., and Zheng, X. (2022). Stochastic-weighted robust optimization based bilayer operation of a multi-energy building microgrid considering practical thermal loads and battery degradation. IEEE Trans. Sustain. Energy 13 (2), 668–682. doi:10.1109/TSTE.2021.3126776
Li, Z., Xu, Y., Feng, X., and Wu, Q. (2021). Optimal stochastic deployment of heterogeneous energy storage in a residential multienergy microgrid with demand-side management. IEEE Trans. Industrial Inf. 17 (2), 991–1004. doi:10.1109/TII.2020.2971227
Lv, S., Wei, Z. N., Chen, S., Sun, G., and Wang, D. (2021). Integrated demand response for congestion alleviation in coupled power and transportation networks. Appl. Energy 283, 116206. doi:10.1016/j.apenergy.2020.116206
Maher, M. (1998). Algorithms for logit-based stochastic user equilibrium assignment. Transp. Res. Part B Methodol. 32 (8), 539–549. doi:10.1016/s0191-2615(98)00015-0
PRC National Development and Reform Commission (2024). Building on comparative advantages to benefit the people of the world--A review of China's new energy vehicle development. Available at: https://www.ndrc.gov.cn/fggz/202405/t20240521_1386406.html.
Qiu, H. T., Dou, S. H., Shang, H. Y., and Zhang, J. (2021). Charging station planning based on the accumulation prospect theory and dynamic user equilibrium. Complex tell Syst. 9, 2521–2539. doi:10.1007/s40747-021-00414-w
Sheffi, Y. (1985). Urban transportation network: equilibrium analysis with mathematical programming methods. Upper Saddle River, NJ: Prentice-Hall.
Sheffi, Y., and Powell, W. B. (1982). An algorithm for the equilibrium assignment problem with random link times. Networks 12 (2), 191–207. doi:10.1002/net.3230120209
Shiwei, X. I. E., Chen, K., Zhang, Y., Xie, L., and Wu, Q. (2024). A two-layer game model for power-transportation coupled networks considering demand elasticity——based on quasi-variational inequalities. Proc. CSEE 44 (6), 2185–2196. doi:10.13334/j.0258-8013.pcsee.230715
Sun, Y. Y., Chen, Z. Q., Li, Z. Y., Tian, W., and Shahidehpour, M. (2019). EV charging schedule in coupled constrained networks of transportation and power system. IEEE Trans. Smart Grid 10 (5), 4706–4716. doi:10.1109/tsg.2018.2864258
Veldman, E., and Verzijlbergh, R. A. (2015). Distribution grid impacts of Smart electric vehicle charging from different perspectives. IEEE Trans. Smart Grid 6 (1), 333–342. doi:10.1109/tsg.2014.2355494
Wei, W., Wu, L., Wang, J., and Mei, S. (2018). Network equilibrium of coupled transportation and power distribution systems. IEEE Trans. Smart Grid 9 (6), 6764–6779. doi:10.1109/tsg.2017.2723016
Wei, W., Mei, S. W., Wu, L., Shahidehpour, M., and Fang, Y. (2017). Optimal traffic-power flow in urban electrified transportation networks. IEEE Trans. Smart Grid 8 (1), 84–95. doi:10.1109/tsg.2016.2612239
Xie, S., Chen, Z., Zhang, Y., Cao, S., and Chen, K. (2023a). Decentralized optimization of multi-area power-transportation coupled systems based on variational inequalities. CSEE J. Power Energy Syst. 99, 1–12. doi:10.17775/CSEEJPES.2022.05760
Xie, S. W., Wu, Q. W., Hatziargyriou, N. D., Zhang, M., Zhang, Y., and Xu, Y. (2023b). Collaborative pricing in a power-transportation coupled network: a variational inequality approach. IEEE Trans. Power Syst. 38 (1), 783–795. doi:10.1109/tpwrs.2022.3162861
Xie, S. W., Xu, Y., and Zheng, X. D. (2022). On dynamic network equilibrium of a coupled power and transportation network. IEEE Trans. Smart Grid 13 (2), 1398–1411. doi:10.1109/tsg.2021.3130384
Yan, C. U. I., Hu, Z., and Duan, X. (2022). Review on the electric vehicles operation optimization considering the spatial flexibility of electric vehicles charging demands. Power Syst. Technol. 46 (3), 981–994.
Zhang, H., Qiu, J., and Wang, Y. (2024a). A joint planning strategy for EV charging system towards net-zero transportation electrification. J. Clean. Prod. 441, 141019. 0959-6526. doi:10.1016/j.jclepro.2024.141019
Zhou, Z., Moura, S. J., Zhang, H. C., Zhang, X., Guo, Q., and Sun, H. (2021). Power-traffic network equilibrium incorporating behavioral theory:a potential game perspective. Appl. Energy 289, 116703. doi:10.1016/j.apenergy.2021.116703
Zhou, Z., Zhang, X., Guo, Q. L., and Sun, H. (2020a). Decomposition approach for the interdependency analysis of integrated power and transportation systems. IET Smart Grid 3 (6), 825–834. doi:10.1049/iet-stg.2019.0310
Keywords: electric vehicle, stochastic user equilibrium, coupled power–transportation network, demand response, distribution network
Citation: Ma X, Jin Y, Li J, Zhen W, Xu R and Cao G (2024) Optimization of the power–transportation coupled power distribution network based on stochastic user equilibrium. Front. Energy Res. 12:1444727. doi: 10.3389/fenrg.2024.1444727
Received: 06 June 2024; Accepted: 28 August 2024;
Published: 23 September 2024.
Edited by:
Zhengmao Li, Aalto University, FinlandReviewed by:
Liang Yuan, Central South University, ChinaChunyu Chen, China University of Mining and Technology, China
Junjie Zhong, Changsha University of Science and Technology, China
Yunqi Wang, Monash University, Australia
Copyright © 2024 Ma, Jin, Li, Zhen, Xu and Cao. This is an open-access article distributed under the terms of the Creative Commons Attribution License (CC BY). The use, distribution or reproduction in other forums is permitted, provided the original author(s) and the copyright owner(s) are credited and that the original publication in this journal is cited, in accordance with accepted academic practice. No use, distribution or reproduction is permitted which does not comply with these terms.
*Correspondence: Yanpeng Jin, MjIzMTkyMTA4NUBzdHUueGF1dC5lZHUuY24=