 Kuichao Ma1,2
 Shuaifeng Wang
 Heng Nian
 Juan Wei
- 1Huadian Electric Power Research Institute Co., Ltd., Hangzhou, China
- 2College of Electrical Engineering, Zhejiang University, Hangzhou, China
- 3College of Electrical and Information Engineering, Hunan University, Changsha, China
- 4Inner Mongolia Huadian Huitengxile Wind Power Co., Ltd., Hohhot, China
The wake effect reduces the wind speed at downstream wind turbines (WTs), making it necessary for the central controller to collect wind power generation data from each WT. However, wind farms (WFs) face a more complex problem in maintaining the voltage stability at the WT terminal while following the transmission system operator (TSO) instructions due to the information collection as well as the possible data loss during transmission. Therefore, this study proposes a coordinated control method for WTs and multiple power sources based on model predictive control under wake disturbance conditions, aiming to reduce the average voltage deviation in WT terminals and go close to the rated voltage and ensure effective compliance with TSO commands in large-scale WFs. Accordingly, the Jensen wake model was utilized to accurately calculate the available active and reactive power limits for each WT. Energy storage systems and static Var generators were modeled to coordinate and maintain the voltage in all WT terminals within the feasible range, providing peak shaving and valley filling support to reduce wind energy waste and shortfall, thereby enhancing the economic and operational reliability of WF. Further, the effectiveness of the proposed method was validated in MATLAB/Simulink.
1 Introduction
The development of wind farms (WFs) demonstrates a rapid growth and globalization trend (Huang et al., 2020). The continuous expansion of the installed capacity of WFs, with the consistent emergence of new projects, highlights the significant role of wind energy as a clean source (Lei et al., 2022; Li et al., 2022; Shang et al., 2022) showed the immense power generation potential of wind energy, which makes it a crucial component in future energy transition. Therefore, wind energy system technologies are continuously advancing, with WFs emerging both onshore and offshore, showcasing a trend toward diversification and sustainable development. These advancements provide important technological solutions and pathways for addressing energy security and climate change issues, thus promoting global energy industry transformation (Glasson et al., 2019).
Voltage control in WFs is crucial for the stable operation and reliability of power systems (Zhao et al., 2020). Proposed a voltage control strategy utilizing doubly fed induction generators in WF, which adjusted wind turbine (WT) parameters and control strategies to achieve stable voltage control, thereby enhancing the grid integration capability and operational reliability of WF (Li et al., 2018). Addressed voltage control and reactive power optimization issues in large-scale wind power integration scenarios, presenting voltage control strategies for various operating scenarios and achieving coordinated operation between WF and the grid through optimized reactive power allocation, thereby improving grid stability and efficiency (Huang et al., 2019). Proposed a novel coordinated voltage control strategy for WF by integrating wind speed and active power fluctuations, dynamically adjusting voltage control parameters, and optimizing control strategies to effectively reduce voltage fluctuations at grid connection points, thereby enhancing the stability of power systems. Focusing on the impact of reactive power fluctuations on WF voltage stability (Guo et al., 2017), introduced a voltage control strategy based on doubly fed induction generators, optimizing control parameters and strategies to effectively mitigate reactive power fluctuations and improve voltage control performance in WF (Ouyang et al., 2019). Proposed a novel coordinated voltage control strategy for WF using doubly fed induction generators, considering grid constraints, and dynamically adjusting voltage control parameters while accounting for network constraints, thus achieving coordinated operation between WF and the grid as well as enhancing grid stability and reliability. Although various voltage control strategies have been proposed for WFs, to the best of our knowledge, none of them have addressed schemes involving energy storage systems (ESS) (Shang et al., 2022; Liu et al., 2023; Wu et al., 2023) and static Var generators (SVG) for voltage control. However, ESS and SVG, as flexible power electronic devices, can potentially enhance voltage control in WFs.
Wake effects decrease the wind speed behind WTs, thereby reducing their power generation capacity. This affects the overall power output of WFs, especially large-scale WFs, where this impact may be more significant. The wake effect also results in an uneven distribution of wind speed among WTs in a WF, thereby affecting its operational stability. This necessitates the adoption of additional control strategies to adjust the operation of WTs and mitigate the impact of wake effects (Zhang et al., 2016). proposed a voltage control strategy based on DFIGs, considering the wake effect between WTs in WF, aimed at improving the voltage stability and responsiveness of WFs (Feijoo and Villanueva, 2017). Integrated the wake effect between WTs and characteristics of WTs, and proposed a novel voltage control method that achieved stability and power control in WF voltage through dynamic and wake models (Tian et al., 2017). Considered the wake effect and grid constraints, and proposed a comprehensive voltage control strategy that optimized the control parameters of WTs in WFs, aiming to achieve coordinated operation with the grid and voltage stability. Further, the wake also has a broader impact on wind farm power generation under time-varying wind speeds. Sensor measurement biases, including wind speed and wind direction biases, may exist in real systems. Ignoring these biases reduces the overall performance of the wind farm and may even be inferior to the tracking capability of a single radar (Ren et al., 2024). Therefore, under various wind conditions and grid interactions (Xiao et al., 2024), emphasizing the flexibility and variability of energy delivery based on different wind speeds and operating conditions, the overall output of the wind farm and the consistency of the Transmission System Operator’s (TSO) directives are needed.
Therefore, considering the wake effect, a coordinated voltage control method is proposed in this study for WTs and multiple power sources in WFs to follow the TSO command, which reduced the wind speed and increased the downstream turbulence, resulting in a loss in power generation. By utilizing model predictive control (MPC) and the Jensen wake model, the proposed method aimed to reduce voltage deviation at WT terminals and ensure compliance with TSO commands. Moreover, ESS and SVG were employed to maintain stable voltage, optimize power utilization, and enhance operational reliability. The main contributions of this study are summarized below:
1) A coordinated control method for WTs and multiple power sources, based on MPC and tailored for wake disturbance conditions, was proposed to reduce the average voltage deviation at WT terminals in large-scale WFs and ensure compliance with TSO commands. The control problem can be formulated as a quadratic programming problem based on MPC and sensitivity, which can be real-time optimization.
2) The Jensen wake model was employed to calculate the available active and reactive power limits for all WTs, enabling them to follow TSO commands without the need for local wind power sensors. Compared to existing method by measuring wind power the by local sensors, this approach can help in mitigating the adverse effects of inaccurate power data collection and data loss during information transmission.
3) Considering the impact of wake-induced losses on downstream WT electricity generation, WFs face challenges in maintaining stable turbine-end voltages while adhering to TSO commands. The ESS and SVG were modeled to coordinate and maintain voltage levels within feasible ranges for all WTs. Compared to transitional WFs without ESS and SVG, the proposed method can facilitate peak shaving and valley filling to reduce wind energy waste and shortfall, and thus enhancing the economic viability and reliability of WF.
2 Voltage control architecture for wind farm
Figure 1 displays the control framework for WF with ESS and SVG considering the significant wake effect. The core of the control strategy employs the Jensen wake model in conjunction with MPC. The Jensen model predicts how downstream turbines are affected by the wake of upstream turbines, which includes both reductions in wind speed and increases in turbulence. The MPC method utilizes this predictive capability to dynamically adjust the active and reactive power outputs of individual WTs. First, the WT controller collected voltage information from all nodes and obtained the nodal admittance matrix for calculating the voltage sensitivity matrix. Based on the Jensen wake model and MPC method, it controlled the active and reactive power outputs of WTs. This ensured optimal performance even under varying wind speed and direction conditions, thereby maximizing the energy yield of WF. Simultaneously, it coordinated ESS and SVG to minimize the average voltage deviation. By continuously optimizing these outputs based on real-time and predicted wind conditions, the system ensures that the available wind power of each WTG is captured in the face of changing wind speeds and directions. This strategic approach not only enhanced the operational stability, but also ensured adherence to the operational guidelines set forth by the TSO.
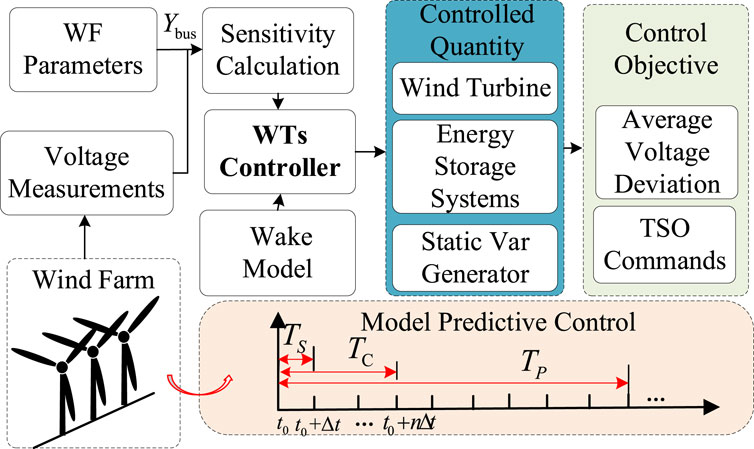
Figure 1. Coordinated voltage control framework for WF with ESS and SVG considering wake effect.
3 Wind farm model with ESS and SVG
3.1 Wake effect model
Traditional voltage control methods require the collection of wind speeds from all WTs in a WF to calculate the available wind power for each WT. However, data loss and errors frequently occur in large-scale WFs during data collection and transmission. Additionally, the wind speed across the WF is not uniform owing to the influence of wake effects. The wake effect, observed in fluid dynamics and aerodynamics, occurs when an object moving through a fluid leaves behind a disturbance characterized by altered flow patterns, pressure changes, and turbulence. This phenomenon impacts the efficiency and performance of WT systems. Therefore, this study proposed the use of wake models to calculate the power output of all WTs. In this approach, only the wind speed and direction across the entire WF need to be measured, thus eliminating the need for sensors to measure local wind speeds and transmitting local power availability information to a central controller.
The Jensen wake model is a simplified mathematical tool used to predict the wake effects of WTs in a WF. Its advantages include its simplicity and computational efficiency, making it suitable for large-scale simulations.
Equation 1 describes how to decompose a given wind direction into two predefined directions in a WF, where (X) and (Y) represent the two predefined directions in the WF, differing by 90 degrees. This decomposition aims to better understand and simulate the variations in wind speed in the WF.
Equations 2–4 can be used to calculate the area affected by wake on WT j due to WT i. Where
Equation 5 describes the influence of WT i on the wind speed experienced by WT j. Where
The issue of mutual influence among WTs is discussed in Eq. 6. Typically, downstream WTs are affected by multiple upstream WTs. To estimate the inflow wind speed of one of these WTs, denoted as (WT) [where (n >2)], the wake superposition model was proposed. In this model, i represents the set of WTs that produce wake effects on a specific WT, while v denotes the free stream wind speed. The model considered the combined impact of multiple upstream WTs on the wind conditions experienced by downstream WTs, which is crucial for optimizing the layout and efficiency of WFs.
3.2 Voltage sensitivity analysis
Sensitivity coefficients are used to estimate the changes in voltage and phase angles in the dynamic process of WF control systems. To improve the computational efficiency, an analytical computation method was developed for calculating the sensitivity coefficients. The link between bus voltages and power injections was established based on fundamental physical principles and network topology of the power system (Christakou et al., 2013). This connection enabled us to infer power injections in the grid by monitoring changes in the bus voltage, allowing dynamic adjustments and optimizations in the WF control system. Equations 7-8 are the voltage sensitivity calculation equations.
The voltage magnitude and phase angle sensitivity can be computed by analyzing the changes in these parameters relative to variations in system conditions or control inputs. The control inputs are only relative to the active and reactive outputs of power components. Equations 9-10 represent the voltage magnitude and phase angle sensitivity can be computed by analyzing the changes in these parameters relative to variations in system conditions or control inputs.
where
3.3 WT and SVG model
In the standard double-closed loop control structure of WTs, owing to the rapid dynamic behavior of the inner current loop, it can be approximated as a first-order lag function. Therefore, the incremental state-space model of WTs can be obtained by considering communication delay. Equations 11-12 represent the transfer function of WTs with a first-order lag function.
where
Then, we obtained Equations 11-12 represent the incremental state-space model of WTs with a first-order lag function.
where
We can also obtain the incremental state-space model of the SVG with a first-order lag function. Equations 11-12 represent the transfer function of SVG with a first-order lag function.
where
Then, we obtain Equations 11-12 represent the incremental state-space model of SVG with a first-order lag function.
where
3.4 ESS model
ESS plays a crucial role in WFs. Through energy storage systems, WFs can effectively smooth out wind fluctuations, provide frequency regulation services, respond to sudden load changes, and quickly meet grid demands, thereby enhancing grid stability and reliability. This increase in flexibility and controllability helps in optimizing the utilization of renewable energy sources and promotes the development of energy systems toward greater sustainability.
Constraints (17)–(21) represent the operating behavior of an ESS. Constraints (17) is the charging/discharging state constraint of ESS, which ensures that the ESS can only work at either charging or discharging condition. Constraints (18) and (19) confine the maximum power during charging or discharging. Constraints Eqs 20, 21 represents state-of-charge (SOC) operation of ESS.
where
The SOC can be defined as follows,
where
4 Coordinated voltage control optimization problem
4.1 Cost function
MPC generates control actions by predicting future system behavior over a specified prediction horizon. This predictive capability allows MPC to optimize control actions in real-time, achieving superior performance compared to traditional controllers. After the quadratic key between power and voltage based sensitivity is linearized, the wind farm voltage control optimization problem can be solved based on quadratic programming. A coordinated control method for WTs and multiple power sources based on MPC under wake disturbance conditions was proposed to reduce the average voltage deviation at WT terminals and ensure effective compliance with TSO commands. It improved the stability and reliability of WFs, optimized the wind energy utilization efficiency, and promoted the application and development of intelligent control technologies. Equation 23 represents the voltage sensitivity coefficients with respect to power.
where
Accordingly, the continuous state-space model of WF can be discretized as,
where
then, the discrete state-space model can be expressed as,
the objective function to minimize the average voltage deviation in WT terminal can be expressed as,
the terminal voltage of each WT,
4.2 Constraint
The voltage constraints at WT terminals, as well as constraints on the active and reactive power outputs of WTs are expressed below,
Equation 29 represents the voltage constraints, ensuring that the voltage at WT terminals remains within a feasible range and does not exceed the allowable upper and lower limits. Eq. 30 denotes the active power constraints, which limit the output of active power from WTs to ensure that it does not exceed the available maximum wind power. Eq. 31 signifies the reactive power constraints, restricting the output of reactive power from WTs to ensure that the power output does not surpass the capacity of WTs.
WFs dynamically adjust the power generation of WTs to ensure that their output satisfies TSO instructions. Equation 32 represent that WFs dynamically adjust the power generation of WTs to ensure that their output satisfies TSO instructions.
In summary, the aforementioned optimal control problem based on MPC can be formulated as a quadratic programming problem, which is well-suited for real-time implementation. MPC considers predictive models of the system dynamics and optimizes control actions over a finite time horizon, balancing performance objectives and constraints. Given the advancements in computational techniques, existing solvers can efficiently solve these quadratic programming problems within milliseconds. This capability ensures rapid decision-making and enables effective mitigation of voltage control issues in large-scale wind power systems.
5 Casy study
A WF model, comprising 32 5 MW DFIG-based WTs, was created in MATLAB/Simulink to validate the proposed control strategy. Each WT was linked to the feeder via a 0.9/33 kV transformer. Four feeders were connected to the medium voltage (MV) bus, with eight WTs in each feeder positioned every 4 km. All WTs were aggregated at the point of connection (POC) and transmitted to external grids through the 155/380 kV main transformer. The WF had a rated power of 160 MW, with individual WTs rated at 5 MW each. For the 33 kV cable, the resistance, inductance, and capacitance were 0.108 Ω/km, 0.3915 mH/km, and 0.13 μF/km, respectively. Similarly, for the 155 kV cable, the resistance, inductance, and capacitance were 0.158 Ω/km, 0.47 mH/km, and 0.13 μF/km, respectively. The rated capacity, resistance, and reactance of the 0.9/33 kV transformer were 6.25 MVA, 0.008 p.u., and 0.06 p. u. respectively; those of the 33/155 kV transformer were 100 MVA, 0.01 p. u., and 0.06 p. u. respectively; while those of the 155/380 kV transformer were 500 MVA, 0.01 p. u., and 0.06 p. u. respectively. The thrust coefficient of each WT
Figure 2 displays the reactive output power of SVG and active output power of WF. The output energy of the WF was 400 MW when all turbines operated at maximum capacity. However, factors such as the wake effect and fluctuating wind speeds inevitably reduced the WF output energy below the 400 MW threshold. During the initial period from 1 to 100 s, the WF output power was stabilized at approximately 230 MW, while the SVG contributed to around 16 MVar of reactive power. Subsequently, between 100 and 180 s, the available power output of WF gradually increased. Consequently, the TSO adjusted the active power command upward in tandem with this increase. Therefore, the WF output power gradually increased. To mitigate the impact of rising active power on the WT terminal voltage, the SVG incrementally ramped up its reactive power output. This adjustment ensured a smoother transition in the system’s overall operation.
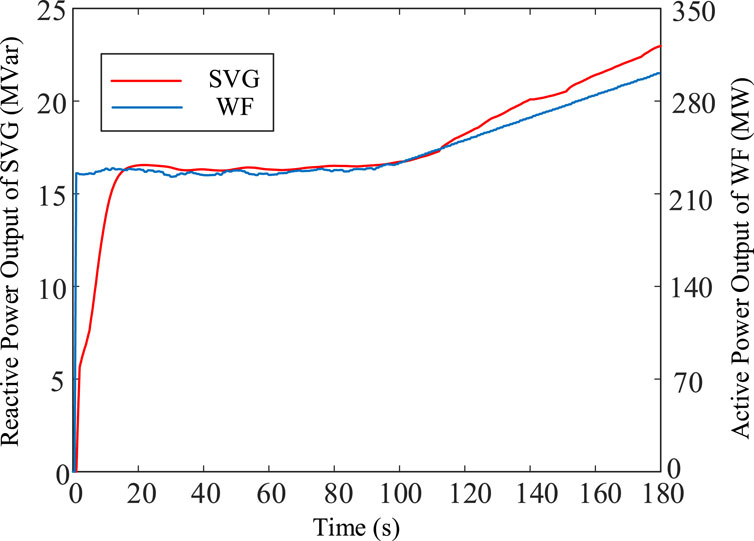
Figure 2. Power output of SVG and WF.
Figure 3 illustrates the SOC of ESS. The role of the energy storage element involved peak shaving. When the available power of the WF was larger than the TSO instruction, the energy storage element absorbed energy. Meanwhile, when the available power of the WF was smaller than the TSO instruction, the energy storage element released energy. During 1–100 s, the charging state of the storage element exhibited an increasing trend, and during 100–180 s, it demonstrated a decreasing trend. This dynamic behavior highlights the role of the ESS in maintaining grid stability by balancing fluctuations during renewable energy generation against demand.
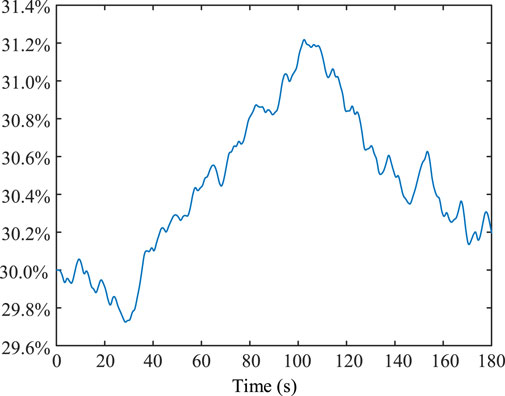
Figure 3. SOC of ESS.
Figure 4 illustrates the terminal voltage and active and reactive power output of WT1. The purpose of controlling the power output from the WT is to maintain the turbine terminal voltage and to track the TSO command. Therefore, the main role of the active power output from the turbine is to track the TSO command, and the main role of the reactive power output is to regulate the voltage fluctuation due to the fluctuation of the active power. During the period 0–100 s, the voltage at terminal 1 of the WT is basically at a constant value, and the active and reactive power output from the turbine fluctuates less. During the period 100–180 s, the active power output from the WT rises and therefore the reactive power absorbed by the WT rises.
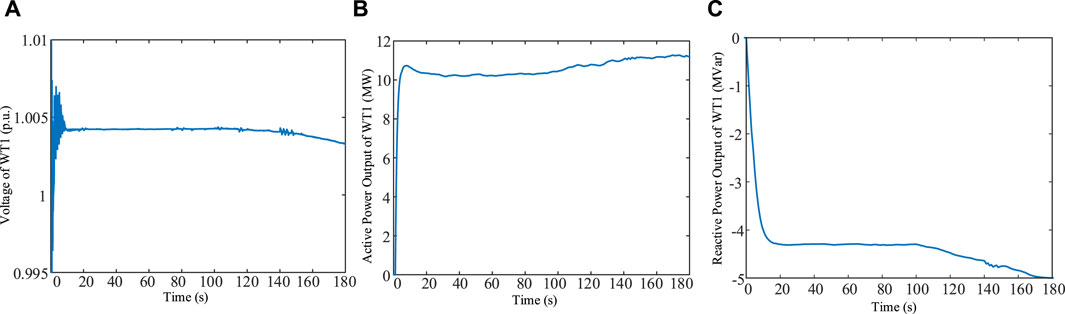
Figure 4. (A) Voltage of WT1. (B) Active power output of WT1. (C) Reactive power output of WT1.
Figure 5 illustrates the comparison of the errors of the two methods for following the TSO command. At high wind speeds, the WTs will deliver as much power as possible in order to avoid wasting energy. Meanwhile, at low wind speeds, the available power of the WTs cannot meet the power demanded by the TSO command. Therefore, WFs without ESS have errors in the tracking effect of the TSO command.
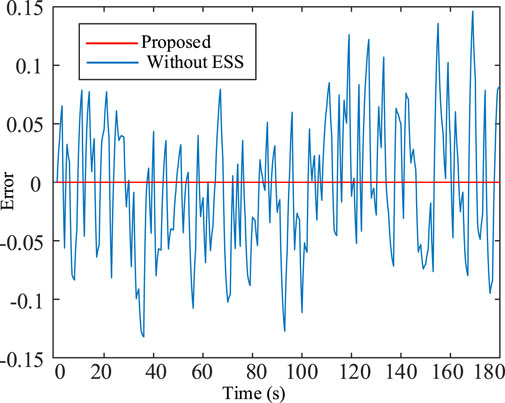
Figure 5. Comparison of the errors of the two methods for following the TSO command.
6 Conclusion
In WF operations, the wake effect not only reduces the electricity generation efficiency of downstream WTs, but also leads to an overall loss in power generation. Additionally, the inaccuracies in wind power information and data loss during transmission increase the uncertainty in WF control. With the objective to address these challenges, this study proposed a scheduling method based on MPC to optimize the stability of WT terminal voltage and ensure that WFs can effectively respond to system TSO commands. By accurately calculating the power boundaries of turbines using the Jensen wake model and introducing coordinated control through ESS and SVGs, the stability and reliability of WFs could be improved. This research outcome provides profound insights for addressing practical issues in WF operations and lays a crucial foundation for the intelligent operation of future WFs.
Data availability statement
The original contributions presented in the study are included in the article/Supplementary Material, further inquiries can be directed to the corresponding author.
Author contributions
KM: Conceptualization, Data curation, Formal Analysis, Funding acquisition, Investigation, Methodology, Project administration, Resources, Software, Supervision, Validation, Visualization, Writing–original draft, Writing–review and editing. YC: Formal Analysis, Project administration, Validation, Writing–review and editing. SW: Data curation, Formal Analysis, Methodology, Writing–original draft, Writing–review and editing. QW: Writing–original draft, Resources, Validation, Visualization. KS: Data curation, Methodology, Project administration, Validation, Writing–original draft. WF: Data curation, Methodology, Project administration, Validation, Writing–original draft. HN: Data curation, Formal Analysis, Methodology, Writing–original draft. JW: Data curation, Formal Analysis, Methodology, Project administration, Writing–original draft, Writing–review and editing.
Funding
The author(s) declare that financial support was received for the research, authorship, and/or publication of this article. This work received the funding from the Huadian Corporation Ltd. (No. CHDKJ-21-01-98) and the National Natural Science Foundation of China (52207050).
Conflict of interest
Authors KM, YC, and WF were employed by Huadian Electric Power Research Institute Co., Ltd. Authors QW and KS were employed by Inner Mongolia Huadian Huitengxile Wind Power Co., Ltd.
The remaining authors declare that the research was conducted in the absence of any commercial or financial relationships that could be construed as a potential conflict of interest.
The authors declare that this study received funding from Huadian Corporation Ltd. The funder had the following involvement in the study: Conceptualization, Data curation, Formal Analysis, Funding acquisition, Investigation, Methodology, Project administration, Resources, Software, Supervision, Validation,Visualization, Writing–original draft, Writing–review and editing.
Publisher’s note
All claims expressed in this article are solely those of the authors and do not necessarily represent those of their affiliated organizations, or those of the publisher, the editors and the reviewers. Any product that may be evaluated in this article, or claim that may be made by its manufacturer, is not guaranteed or endorsed by the publisher.
References
Christakou, K., LeBoudec, J. -Y., Paolone, M., and Tomozei, D. -C. (2013). Efficient computation of sensitivity coefficients of node voltages and line currents in unbalanced radial electrical distribution networks. IEEE Trans. Smart Grid 4 (2), 741–750. doi:10.1109/TSG.2012.2221751
Feijoo, A., and Villanueva, D. (2017). Contributions to wind farm power estimation considering wind direction-dependent wake effects. Wind Energy 20 (2), 221–231. doi:10.1002/we.2002
Glasson, J., Durning, B., Welch, K., and Olorundami, T. (2019). The local socio-economic impacts of offshore wind farms. Environ. Impact Assess. Rev. 192, 106783. doi:10.1016/j.eiar.2022.106783
Guo, Y., Gao, H., Wu, Q., Zhao, H., Østergaard, J., and Shahidehpour, M. (2017). Enhanced voltage control of VSC-HVDC-connected offshore wind farms based on model predictive control. IEEE Trans. Sustain. Energy 9 (1), 474–487. doi:10.1109/TSTE.2017.2743005
Huang, S., Wu, Q., Guo, Y., Chen, X., Zhou, B., and Li, C. (2019). Distributed voltage control based on ADMM for large-scale wind farm cluster connected to VSC-HVDC. IEEE Trans. Sustain. Energy 11 (2), 584–594. doi:10.1109/TSTE.2019.2898102
Huang, S., Wu, Q., Guo, Y., and Rong, F. (2020). Hierarchical active power control of DFIG-based wind farm with distributed energy storage systems based on ADMM. IEEE Trans. Sustain. Energy 11 (3), 1528–1538. doi:10.1109/TSTE.2019.2929820
Lei, S., Hua, Z., Liu, C., and Dong, X. (2022). Amplitude-phase-locked-loop-based power injection strategy for wind power generation under three-phase grid fault. IEEE Trans. Energy Conv. 37 (4), 2952–2961. doi:10.1109/TEC.2022.3207285
Li, M., Yang, M., Yu, Y., and Lee, W. -J. (2022). A wind speed correction method based on modified hidden markov model for enhancing wind power forecast. IEEE Trans. Ind. Appl. 58 (1), 656–666. doi:10.1109/TIA.2021.3127145
Li, Y., Xu, Z., Zhang, J., and Meng, K. (2018). Variable droop voltage control for wind farm. IEEE Trans. Sustain. Energy 9 (1), 491–493. doi:10.1109/TSTE.2017.2726355
Liu, K., Sheng, W., Li, Z., Liu, F., Liu, Q., Huang, Y., et al. (2023). An energy optimal schedule method for distribution network considering the access of distributed generation and energy storage. IET Generation, Transm. Distribution 17 (13), 2996–3015. doi:10.1049/gtd2.12855
Ouyang, J., Tang, T., Yao, J., and Li, M. (2019). Active voltage control for DFIG-based wind farm integrated power system by coordinating active and reactive powers under wind speed variations. IEEE Trans. Energy Conv. 34 (3), 1504–1511. doi:10.1109/TEC.2019.2905673
Ren, B., Jia, T., Liu, H., Wang, Y., and Yan, J. (2024). Efficient estimation for sensor biases and target states in the presence of sensor position errors. IEEE Sensors J. 24 (10), 16551–16562. doi:10.1109/JSEN.2024.3384810
Shang, L., Dong, X., Liu, C., and Gong, Z. (2022). Fast grid frequency and voltage control of battery energy storage system based on the amplitude-phase-locked-loop. IEEE Trans. Smart Grid 13 (2), 941–953. doi:10.1109/TSG.2021.3133580
Tian, J., Zhou, D., Su, C., Chen, Z., and Blaabjerg, F. (2017). Reactive power dispatch method in wind farms to improve the lifetime of power converter considering wake effect. IEEE Trans. Sustain. Energy 8 (2), 477–487. doi:10.1109/TSTE.2016.2607146
Wu, S., Ma, H., Alharbi, A. M., Wang, B., Xiong, L., Zhu, S., et al. (2023). Integrated energy system based on isolation forest and dynamic orbit multivariate load forecasting. Sustainability 15 (20), 15029. doi:10.3390/su152015029
Xiao, D., Lin, Z., Chen, H., Hua, W., and Yan, J. (2024). Windfall profit-aware stochastic scheduling strategy for industrial virtual power plant with integrated risk-seeking/averse preferences. Appl. Energy 357, 122460. doi:10.1016/j.apenergy.2023.122460
Zhang, B., Hou, P., Hu, W., Soltani, M., Chen, C., and Chen, Z. (2016). A reactive power dispatch strategy with loss minimization for a DFIG-based wind farm. IEEE Trans. Sustain. Energy 7 (3), 914–923. doi:10.1109/TSTE.2015.2509647
Keywords: wind farm, voltage control, energy storage system (ESS), static var generator (SVG), model predictive control (MPC), wake effect
Citation: Ma K, Chen Y, Wang S, Wang Q, Sun K, Fan W, Nian H and Wei J (2024) Coordinated voltage control for large-scale wind farms with ESS and SVG based on MPC considering wake effect. Front. Energy Res. 12:1443626. doi: 10.3389/fenrg.2024.1443626
Received: 04 June 2024; Accepted: 10 July 2024;
Published: 31 July 2024.
Edited by:
Liansong Xiong, Xi’an Jiaotong University, ChinaReviewed by:
Zhenjia Lin, Hong Kong Polytechnic University, Hong Kong SAR, ChinaSheng Cai, Nanjing University of Science and Technology, China
Fuqi Ma, Xi’an University of Technology, China
Chaoran Zhuo, Xi’an University of Technology, China
Copyright © 2024 Ma, Chen, Wang, Wang, Sun, Fan, Nian and Wei. This is an open-access article distributed under the terms of the Creative Commons Attribution License (CC BY). The use, distribution or reproduction in other forums is permitted, provided the original author(s) and the copyright owner(s) are credited and that the original publication in this journal is cited, in accordance with accepted academic practice. No use, distribution or reproduction is permitted which does not comply with these terms.
*Correspondence: Juan Wei, d2VpanVhbmJhQGhudS5lZHUuY24=