Abstract
Introduction: With the increasing fluctuations in the current domestic and international economic situation and the rapid iteration of macroeconomic regulation and control demands, the inadequacy of the existing economic data statistical system in terms of agility has been exposed. It has become a primary task to closely track and accurately predict the domestic and international economic situation using effective tools and measures to compensate for the inadequate economic early warning system and promote stable and orderly industrial production.
Methods: Against this background, this paper takes industrial added value as the forecasting object, uses electricity consumption to predict industrial added value, selects factors influencing industrial added value based on grounded theory, and constructs a big data forecasting model using a combination of “expert interviews + big data technology” for economic forecasting.
Results: The forecasting accuracy on four provincial companies has reached over 90%.
Discussion: The final forecast results can be submitted to government departments to provide suggestions for guiding macroeconomic development.
1 Introduction
With the intensification of fluctuations in the domestic and international economic situation, the existing economic data statistical system is insufficient in terms of agility and cannot accurately predict the economic situation. Considering the possible distortions and lack of timely updates in macroeconomic data, the reasonable prediction of macroeconomic data can effectively compensate for the deficiencies of existing macro data, which is of great significance for the country to deploy macroeconomic regulation policies in advance.
In macroeconomics, economic growth is defined as the increase in the total output of a society compared to the previous period within a certain period of time. Output growth is mainly achieved by increasing the quantity of production factors and improving the efficiency of production factors. Based on demographic factors, it is manifested as the growth of per capita output (or per capita income) level. The research focus on the connotation of economic growth has undergone a process of development from quantity to quality. Initially, macroeconomists focused on the speed and scale of economic growth, primarily using the Gross Domestic Product (GDP) indicator to measure the effectiveness of economic growth (Feldman et al., 2016). However, as the emphasis on quantity expansion as the core of economic growth, issues such as resource scarcity, environmental degradation, lack of innovation, and economic structural imbalance have increasingly emerged in practice (Qian and HuiKang, 2009). Scholars have begun to conduct research on the quality of economic growth, which reflects the judgment of the merits and demerits of economic growth (Ren, 2012). The connotation of the quality of economic growth is the basis for studying the issue of economic growth. In the academic community, research perspectives on this issue are mainly divided into narrow and broad viewpoints (Fan et al., 2020). Mei (2006) points out that in the narrow sense of economic growth quality, economic growth efficiency is referred to as economic growth quality. Total factor productivity or input-output ratio is usually used to measure economic growth efficiency, and it is believed that high-quality economic growth means that lower input brings higher output (Hu and Xing, 2018). Broad views of economic growth quality cannot be defined by a single characteristic indicator but are based on the richness of the extension of economic growth quality, defining the connotation through the establishment of a comprehensive indicator system (Shen, 2010). Shi and Ren (2018) adopted economic growth fundamentals and social outcomes as two first-level indicators to measure the quality of economic development; On this basis, Xu (2018) considered the impact of ecological development quality and added environmental protection indicators.
People often need to design future actions based on the present, especially when it comes to economic issues. Economic growth generally refers to the expansion of a nation’s productivity, reflected in the Gross Domestic Product (GDP) of a country. Economic growth forecasting has always been a focus of domestic and international scholars, and the exploration of methods for macroeconomic forecasting research has continued to deepen with the increasing application of mathematical, statistical, and even physical models. Economic forecasting is a scientific study that has developed to adapt to the large-scale production of society, objectively examining the economic development process and its changing trends. Economic forecasting, guided by relevant macro or microeconomic theories, starts from the history and current status of economic development, using investigative research and statistical data as the basis, and employing scientific qualitative analysis and rigorous quantitative calculations as means to analyze and explain the evolutionary laws of economic activities related to the forecasting object, thereby making scientific predictions about the future development and evolution of the forecasting object. It integrates methods from philosophy, sociology, economics, statistics, mathematics, engineering, and other fields, and provides an objective description of the changing trends of the economic development process and its various elements based on its own scientific logic. Forecasting involves making qualitative and quantitative descriptions of uncertain or unknown events, minimizing the uncertainty of the occurrence of a future event, and making inferences about the development of this event. Economic growth forecasting is based on economic growth theory, and the Solow model proposed in (Solow, 1956) laid the model foundation for future economic growth research. Research on various aspects of economic growth has always been rich, with the most extensive being the study of influencing factors. Levine and Renelt (1992) first used extreme boundary analysis to analyze the influencing factors of cross-border economic growth and raised the issue of model uncertainty, but almost all variables did not pass robustness tests. Subsequent studies in (Fernandez et al., 2001) refuted this negative conclusion, using the method of Bayesian model averaging to study the influencing factors, and found that variables such as human capital and degree of openness are very important for explaining economic growth. They provided a clearer explanation of the parameter estimation and forecasting results of the variables with a more systematic statistical theory, making the method more sophisticated. In addition to studying the relationships between multiple factors, there is also much research on the impact of individual factors on economic growth. Muhammad (2011) and Hunt (2011), for example, discussed the relationship between the financial market, education investment, and healthcare conditions and economic growth. In recent years, foreign scholars have been attempting to conduct in-depth analyses of known factors from a new perspective. Wongboonsin and Phiromswad (2017) studied the specific impact of population on economic growth from the perspective of population structure and age distribution. In terms of economic forecasting research, both Liu et al. (2016) and Yu et al. (2016) chose to use grey models for economic forecasting and both achieved good results. By the way, Christensen et al. (2018) and Segnon et al. (2018) also highlighted the role and impact of uncertainty in economic forecasts. The history of social and economic forecasting in our country is still very short and faces many difficulties. There is a lot of work to be done to solve problems in both forecasting theory and forecasting practice, as well as in the organization of forecasting teams.
In China, the industrial sector, as the primary sector of material production, still holds the largest share of China’s GDP and plays a crucial role in national economic activities. Xiu et al. (2015) used grey system forecasting to predict China’s industrial growth path up to 2020. Han and Xiao (2014), using monthly industrial value-added growth rate data from January 2001 to December 2012 as samples, conducted research and analysis on seasonal and trend fluctuations using the Holt-Winters model of exponential smoothing. Ref. (Fang et al., 2021), based on the Long Short-Term Memory (LSTM) model, studied how to effectively utilize electricity big data for real-time forecasting of industrial value-added. The results indicate that combining LSTM with the ARIMA model, electricity big data, and economic statistical data can yield the best forecasting results.
Data processing and application play a significant role in all aspects of electric power scientific planning and construction, economic operations, automatic control, and intensive management. The proposal of the energy internet requires the establishment of information exchange between smart grids and transportation, natural gas, buildings, and other sectors, transforming the power grid into an energy-sharing network using Internet thinking and technology, with more dispersed and extensive data sources and faster and fuller data flow. Electricity big data has unique advantages of high authenticity, strong temporality, and large data volume. Thoroughly exploring the application potential of electricity big data is an important means for grid enterprises to cope with economic downturns and improve quality and efficiency. More and more power companies are no longer positioning themselves solely as energy companies providing reliable power supply but have included providing powerful data analysis and diversified information services in their corporate strategies. However, the current application of big data in the power system is still in its infancy, and its value has not been fully tapped and utilized. The application of electricity big data should aim to achieve the goals of “market efficiency, enterprise benefit, and individual benefit,” fully enhance the value of electricity big data (Jiang, 2021), and transform the data advantage of enterprises into a stable competitive advantage (Sun and Fang, 2020). In recent years, the value of electricity big data has been increasingly emphasized, with massive electricity big data being used in grid detection, grid maintenance, grid load trend forecasting, and other aspects, greatly improving operational efficiency and enhancing the experience of grid users.
Economic forecasts can be divided into long-term, medium-term, and short-term (recent) economic forecasts based on the time span. Long-term economic forecasting refers to predicting the economic development prospects for over 5 years (not including 5 years). It serves as the basis for formulating 10-year economic development plans, long-term visions, and defining long-term economic development tasks. Medium-term economic forecasting refers to predicting the economic development prospects for over 1 year (not including 1 year) but less than 5 years. It serves as the basis for formulating 5-year economic development plans and defining economic development tasks for the next 5 years. Short-term economic forecasting refers to predicting the economic development prospects for over 3 months (including 3 months) but less than 1 year. It serves as the basis for formulating annual economic development plans, quarterly plans, and specifying specific tasks for recent economic development. Economic forecasts with a shorter time span than recent forecasts are also known as short-term economic forecasts. Short-term economic forecasts typically predict the economic development prospects for under 3 months, with forecast intervals of days, weeks, tens of days, or months. They serve as the basis for formulating monthly and 10-day plans and specifying tasks for economic activities. Currently, there are two main technical routes for forecasting the macroeconomic situation in the medium to short term: business modeling forecasting methods, represented by indicators such as electricity elasticity coefficient, Keqiang Index, PMI Index, and excavator index; and data modeling forecasting methods, which can be further divided into single-variable and multivariable forecasting analysis methods. Single-variable forecasting analysis methods include single econometric analysis methods represented by stepwise regression and ARMA models. Multivariable forecasting analysis methods include big data forecasting methods represented by dynamic Bayesian network forecasting models, mixed-frequency data sampling models, dynamic factor models, and LSTM models. Due to the late start of economic forecasting in China and facing many difficulties, the economic data statistical system lacks agility. Therefore, there is an urgent need for an accurate big data forecasting model. This paper takes industrial value added as the forecasting object, predicts industrial value added using electricity data, selects factors influencing industrial value added based on grounded theory, and constructs a big data forecasting model using a combination of “expert interviews + big data technology” as an economic forecasting method to provide recommendations for government departments to guide macroeconomic development.
In the first section, this paper summarizes the previous research results, in the second section, the grounded theory is used to identify the factors affecting the monthly industrial added value, in the third section, several monitoring models are constructed, and in the fourth section, conclusions and suggestions are given.
2 Methodology
2.1 Identification of factors affecting monthly industrial added value
2.1.1 Introduction to grounded theory
Glaser and Strauss discovered Grounded Theory in the 1960s, proposing the development of theory in research based on data in their book “Discovery of Grounded Theory.” Corbin and Strauss further improved this theory, suggesting that the main purpose of Grounded Theory is to establish theory based on empirical data. The Grounded Theory method includes systematic and flexible guidelines that allow researchers to collect and analyze qualitative data and construct theories grounded in the data. Subsequent scholars have argued that “everything is data,” including interviews, texts, observations, etc., which can serve as original data for Grounded Theory. Constant comparison and continuous abstraction are the most fundamental methods in data analysis within Grounded Theory. This article adopts Grounded Theory to identify key influencing factors for predicting industrial value added, providing a basis for subsequent forecasting research.
Grounded Theory is fundamentally a qualitative research method (Calvert et al., 2017). By collecting, organizing, extracting, and summarizing empirical data, categories are formed, intrinsic connections between them are found, the internal logic of phenomena is discovered, and a theory reflecting real-world issues is ultimately developed. Grounded Theory is a systematic and inductive research method that starts from the bottom up, without preconceived theoretical assumptions, primarily using data collection and analysis to present theories, emphasizing ongoing comparisons in data analysis. In the process of data collection and analysis, a new theory is established. In the process of forming a new theory, scholars continue to collect, analyze and interpret data, and then promote the collection of further data, so as to constantly improve the theory.
The general process of Grounded Theory revolves around encoding collected data as the core (Niu et al., 2020), with the induction of relevant theories as the main focus and deduction as secondary. Following this, textual information or data is broken down, analyzed, and conceptualized, abstracted appropriately, and a theory model is constructed using methods such as open coding, axial coding, and selective coding after theoretical sampling, which involves extracting data that provides the most information for the research problem. Open coding involves researchers initially organizing and analyzing collected raw data, assigning various conceptual categories, also known as first-level coding. This analysis and organization stage requires thorough and detailed work, using statements from collected data as the basis for categorization. The original hierarchical data should be broken down word by word, coded, and finally logged. Through continuous comparison and abstraction, initial concepts are generated, and conceptual categories are discovered. Due to individual differences in experiences and cultural backgrounds, coding results may vary. If the summarized concepts are not sufficient to form clear clues, they can be further generalized to form “initial categories.” Axial coding connects concepts from open coding, also known as second-level coding. The purpose of selective coding is to present the relationships between various categories more effectively, using a storytelling approach to clearly present the collected data, also known as third-level coding.
In the process of applying Grounded Theory to research problems, there are three main stages: first-level coding, also known as open coding, involves conceptualizing and refining raw data and textual material (Feltrin et al., 2019); second-level coding, axial coding, categorizes the concepts refined in the previous step, categorizes them, and establishes interrelated main categories; third-level coding, based on the results of the first two levels, establishes related relationship models and forms corresponding theories. Using third-level coding, real raw data and textual material are systematically analyzed to form a theoretical relationship model that explains the phenomenon. Encoding is a crucial stage in Grounded Theory research, requiring researchers to be sensitive to theory and to construct theories correctly. The research approach of this paper is shown in Figure 1.
FIGURE 1

Research approach diagram.
Based on existing literature on Grounded Theory and considering the influence of the current objective environmental background, industrial value added is influenced by multiple dimensions and factors. The level of industrial electricity consumption not only reflects the industrial production status but also exhibits a short-term decoupling phenomenon with industrial value added. Therefore, using only industrial electricity consumption levels to predict total industrial value added may lead to significant bias. To reduce bias and improve prediction accuracy, this article considers incorporating external data to effectively complement the shortcomings of electricity data. Grounded in Grounded Theory, this study uses a bottom-up approach to encode collected data, forming the basis for analysis in the subsequent recommendation section.
2.1.2 Coding and refining the main category
In the stage of open coding, it is necessary to explore concepts and determine categories. Through interviews with 11 authoritative experts in the field of economics from the Chinese Academy of Macroeconomics, the China National Research Center, the Chinese Academy of Sciences, and well-known universities in China (such as Academician Wang Shouyang and Professor Yang Cuihong of the Chinese Academy of Sciences, Researcher Hong Qunlian of the Chinese Academy of Macroeconomics, Researcher Zhao Zheng of the China National Research Center, and Professor Wang Yiming of Peking University), relevant sentences reflecting potential influencing factors in predicting industrial value added were identified and coded word by word to extract more accurate concepts. Ten categories were identified and four main categories were extracted.
The first category is the Consumer Price Index (CPI), which measures industrial value added as a measure of value. Its changes are highly correlated with product prices. The CPI represents the impact of changes in retail prices and service prices of consumer goods on the actual living expenses of urban and rural residents. From the perspective of consumers, it compensates for the lack of value information in electricity consumption. The second one is believed to be the real effective exchange rate index. In an open economy, the international competitiveness of a country’s commodity trade is closely related to changes in industrial added value. Electricity consumption measures domestic economic activity more, so the real effective exchange rate of the RMB is introduced. The third one is the Producer Price Index (PPI), which corresponds to the Consumer Price Index. PPI reflects market price changes from the perspective of enterprise production costs and compensates for the lack of value information in electricity consumption from the producer’s perspective. The increase in PPI may indicate that the production cost of the enterprise is relatively high. The rise in PPI also has a positive driving effect on industrial production.
The fourth is the production output of key industries: The consumption of electricity reflects the production input of the industry, and directly predicting the output value using input ignores the influence of the internal structure of the industry. However, the supply of key industries such as the black metal industry, non-ferrous metal industry, chemical industry, building materials industry, and strategic emerging industries has a greater impact on industrial added value. Therefore, the production output of key industry products is introduced (the specific industry selection is determined based on the development characteristics of the research area). The fifth category is industrial electricity consumption, as it is an important input factor for industrial value-added.
The sixth is the electricity consumption of other industries, as the electricity consumption of other industries is an important input factor for production in other industries. Therefore, the introduction of predictive models can capture the input-output relationship between the industrial sector and other industries. The specific industry selection should be determined based on the industrial development characteristics of the research area.
The seventh is the Business Confidence Index, which refers to the basic estimation made by enterprises on the economic situation. It is a leading indicator of macroeconomics before the release of industrial value-added, and the introduction of this indicator can achieve complementarity with electricity consumption data.
The eighth one is the macroeconomic prosperity index, which can reflect entrepreneurs’ feelings and confidence in the macroeconomic environment. Due to its earlier release than industrial value-added, it is commonly used to predict changes in economic development trends.
The ninth is the Purchasing Managers Index (PMI), which is an index compiled through monthly surveys of purchasing managers. It is a leading indicator of macroeconomics and is commonly used to predict economic trends.
Finally, through interviews, it is believed that Baidu Migration Big Data is also one of the categories, because Baidu Migration Big Data reflects the prosperity level of the regional environment, which is closely related to industrial production.
Then carry out axial coding. This Monday’s stage mainly involves defining and mining the connotations of concepts, sorting and merging similar concepts into more general categories. Reexamine the 10 categories obtained through open coding, namely, the Consumer Price Index, Real Effective Exchange Rate Index, Price Index of Production Materials (PPI), Key Industry Product Output, Industrial Electricity Consumption, Electricity Consumption in Other Industries, Business Confidence Index, Macroeconomic Prosperity Index, Purchasing Manager Index (PMI), and Baidu Migration Big Data, merge and summarize them, and finally extract 4 main categories that can cover these 10 categories, namely, price indicators, output indicators, industry external environment indicators, and regional external environment indicators.
Then proceed to the next stage of selective encoding, which is to induce the core categories. Specifically, it is necessary to excavate a core category from all the main categories through integration and condensation. After completing the axial coding, four main categories were summarized based on their characteristics, namely, moral leadership, teaching leadership, research drive, self-development, and organizational support. The Consumer Price Index, Real Effective Exchange Rate Index, and Price Index of Production Materials (PPI) can be summarized as price indicators; The output of key industry products and industrial electricity consumption can be summarized as output indicators; The electricity consumption, business confidence index, macroeconomic prosperity index, and purchasing manager index (PMI) of other industries are compiled into external environmental indicators for the industry. Baidu Migration Big Data is summarized as a regional external environmental indicator.
2.1.3 Theoretical saturation test
The theory saturation test is an important method for evaluating the quality of Grounded Theory research. When the collected data cannot generate new theoretical insights but can explain the social phenomena under study, it can be considered to have reached theoretical saturation. Theoretical saturation is relative and independent of the sample size. Some researchers confuse saturation with repetition of statements; saturation is not about repeatedly seeing the same pattern, but conceptualizing these events after contrasting them. These events produce attributes of different patterns until no new attributes appear.
In previous studies, it was found that about one-third of the literature did not undergo saturation testing. Among the literature that underwent saturation testing, most used two methods: one is to test saturation by reserving samples in the literature, and the other is to consider theoretical saturation when a certain number of samples are reached without new categories emerging. Grounded Theory requires categories to gradually saturate in their attributes and dimensions, not just the absence of new data, but also that the data fully explain the categories and their attributes and dimensions, including the relationships between changing forms and concepts. However, most studies only randomly select different cases to repeat the same pattern test, which does not meet the theoretical saturation requirements of Grounded Theory.
To ensure the saturation of the concepts and categories identified through coding induction and analysis, the remaining 1/4 of the text was selected for the same process of coding analysis, and no new concepts and categories were found. After the second round of coding, no new categories or concepts emerged. Combining the results of various data tests, it is indicated that the core coding of this study has a high level of theoretical saturation, showing a high level of internal consistency in explaining the core dimensions. This proves that the core dimensions of this study have good credibility, confirming that the theoretical model has reached saturation.
2.1.4 The importance of indicators of potential influencing factors
(1) Importance evaluation
Considering that industrial added value is influenced by multiple dimensions and factors, the level of industrial electricity consumption only reflects the state of industrial production, and there is a short-term decoupling phenomenon between industrial added value and industrial electricity consumption. Using only the level of industrial electricity consumption to predict the full range of industrial added value may have significant errors. To reduce bias and improve prediction accuracy, the research group is considering adding external data to effectively compensate for the shortcomings of power data. In view of this, based on the grounded theory, the research group has interviewed a total of 11 authoritative experts in the field of economics from the Chinese Academy of Macroeconomics, the National Research Center, the Chinese Academy of Sciences, and well-known domestic universities, and further interviewed 12 experts for theoretical saturation testing. A total of 23 experts were interviewed. The potential influencing factor indicator system of four primary indicators and more than ten secondary indicators that affect industrial growth were identified through coding, and the importance level evaluation was carried out using the Analytic Hierarchy Process (AHP).The results are shown in
Table 1.
(2) Logical relationship between each index and industrial added value
1) Consumer price index
TABLE 1
| First-level indicators | Second-level indicators | Degree of importance |
|---|---|---|
| Price Indicators | Consumer Price Index (CPI) | ★★★★ |
| Real Effective Exchange Rate Index | ★★★ | |
| Producer Price Index (PPI) | ★★★ | |
| Output Indicators | Production Volume of Key Industry Products | ★★ |
| Industrial Electricity Consumption | ★★★★★ | |
| Industry External Environment Indicators | Other Industry Electricity Consumption | ★★★★★ |
| Business Confidence Index | ★★★ | |
| Macro Economic Prosperity Index | ★★★ | |
| Purchasing Managers’ Index (PMI) | ★★★ | |
| Regional External Environment Indicators | Baidu Migration Big Data | ★★ |
Index system of potential influencing factors for forecast of industrial added value.
Note: Importance is ranked in order of ★---★★★★★, from not important to important.
Industrial value added serves as a measure of value quantity, and its changes are highly correlated with product prices. The Consumer Price Index indicates the extent to which changes in retail prices of consumer goods and service prices affect the actual living expenses of urban and rural residents, thereby compensating for the lack of value information in electricity consumption from the consumer’s perspective.
2) Real Effective Exchange Rate Index
In an open economy, the international competitiveness of a country’s commodity trade is closely related to changes in industrial value added. Electricity consumption more accurately measures the economic activity within the country, hence the introduction of the real effective exchange rate of the Renminbi.
3) Producer Price Index
Corresponding to the Consumer Price Index, the PPI reflects market price changes from the perspective of enterprise production costs, thereby compensating for the lack of value information in electricity consumption from the producer’s perspective. An increase in PPI indicates high enterprise production costs. A rise in PPI has a positive driving effect on industrial production.
4) Production Volume of Key Industry Products
Electricity consumption reflects industry production inputs. Directly predicting output based on inputs overlooks the influence of industry internal structure. The supply volume of key industries such as the ferrous metal industry, non-ferrous metal industry, chemical industry, building materials industry, and strategic emerging industries has a greater impact on industrial value added. Therefore, the production output of key industry products is introduced (specific industry selection depends on the industrial development characteristics of the research area).
5) Industrial Electricity Consumption
Industrial electricity consumption is an important input factor for industrial value added.
6) Other Industry Electricity Consumption
Electricity consumption in other industries is a significant input factor for their production. Introducing prediction models can capture the input-output relationship between the industrial sector and other industries (specific industry selection depends on the industrial development characteristics of the research area).
7) Business Confidence Index
The Business Confidence Index is the basic estimate made by enterprises regarding the economic situation. It is released earlier than industrial value added data and serves as a leading indicator of the macroeconomy. Introducing this index complements the electricity consumption data.
8) Macroeconomic Prosperity Index
This index reflects entrepreneurs’ perceptions and confidence in the macroeconomic environment. Since it is released earlier than industrial value added data, it is commonly used to predict changes in economic development trends.
9) Purchasing Managers’ Index (PMI)
The PMI is a composite index derived from monthly surveys of purchasing managers and serves as a leading indicator of the macroeconomy, commonly used to predict economic trend changes.
10) Baidu Migration Big Data
Baidu Migration Big Data reflects the level of prosperity in a region, which is closely related to industrial production in that area.
2.2 Monthly industrial added value monitoring model
This paper focuses on the prediction model system and four typical prediction models used in the model system. They are respectively ARMI-LSTM model, XGboost model, CEEMDAN model and ANN model. Considering the mixed-frequency characteristics of the data required for prediction, the presence of outliers in macroeconomic data, and the accuracy requirements of the forecast, the ARIMA-LSTM model is adopted as the main forecasting model. At the same time, in light of the data distribution characteristics of different regions, the XGboost, CEEMDAN, and ANN models are used respectively as auxiliary models. Below is an introduction to the four models respectively.
2.2.1 Main forecasting model-ARIMA-LSTM model
The predecessor of LSTM is recurrent neural networks (Tian et al., 2022). In this paper, the index of potential influencing factors is used as the input node of the LSTM model, and the relationship between each index and industrial added value can be mined in a finer granularity. At the same time, considering the timing characteristics of input node data, this paper combines LSTM method with ARIMA, and uses MATLAB software to realize ARIMA-LSTM model code.
LSTM divides events into main and sublines to selectively forget information and retain important information, thereby alleviating the problems of gradient explosion or vanishing. The forget gate (left dotted box), input gate (middle dotted box), and output gate (right dotted box) control the forget function of LSTM, as shown in Figure 2. Xt represents the input; A is the neural network module; ht represents the output; Ct is the state variable that forms the main line of the event and runs throughout the entire chain with only a small amount of linear interaction.
FIGURE 2
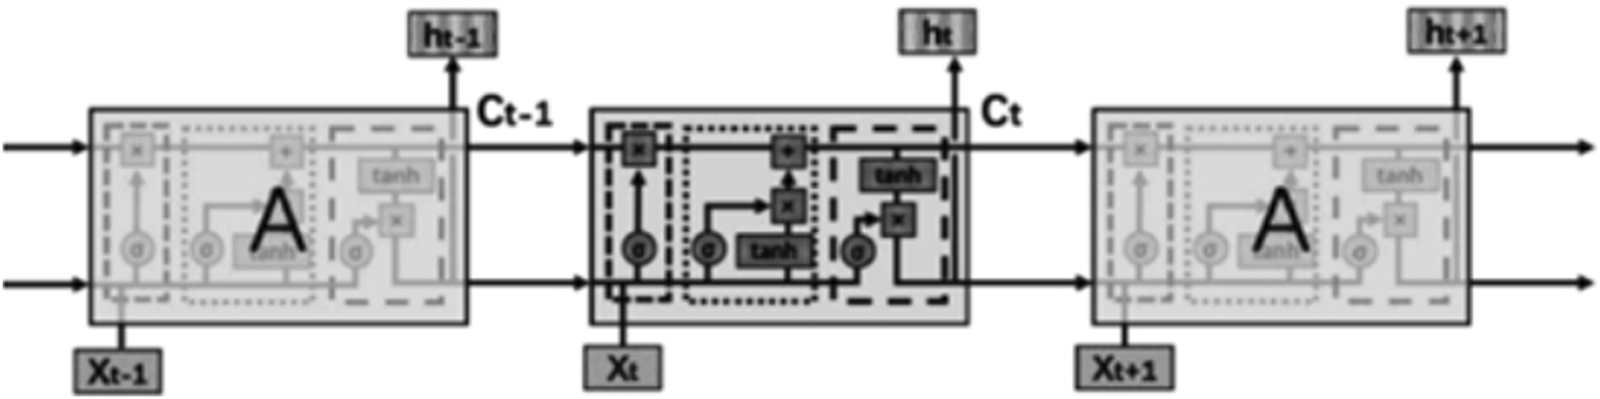
LSTM flow chart.
LSTM can be expressed by the following formula (Equations 1–3):
Where, and are the weight and intercept terms of the current input respectively; σ(·) is the activation function, and sigmoid function is generally selected; is the state variable, expressed as:
To explore the appropriate use of electricity big data in the current prediction of industrial value added, this study divides data into economic statistical data and electricity big data, and inputs them into the model in three scenarios: using only economic statistical data, using only electricity big data, and using both economic statistical data and electricity big data simultaneously. Additionally, due to the different levels of electricity big data, different levels of indicators are input when using electricity big data. Furthermore, to investigate the role of machine learning methods in current prediction, four LSTM models are constructed for each of the above data inputs.
1) Model 1
This model takes industrial added value as the predicted variable and trains the LSTM model directly (
Equation 4).
2) Model 2
This model combines the LSTM model with the ARIMA model. First, the ARIMA model is constructed with the industrial added value, and then the residual
of ARIMA is used as the predicted variable of the LSTM model to train the model (
Equations 5,
6).
3) Model 3
Based on Model 2, this model takes factors extracted from explanatory variables as input variables of the LSTM model. When the input data is economic statistics and power big data, the two types of data are not treated differently, and the two are put together to extract factors (
Equations 7–
8).
4) Model 4
Model 4 is a supplement to model 3. When the input data are economic statistics data and power big data , factors are extracted for the two respectively, and the factors of the two are taken together as input variables of the LSTM model (Equations 9, 10).
2.2.2 Auxiliary forecasting models
1) XGboost model
Xtreme Gradient Boosting (XGBoost), also known as extreme gradient boosting (Huber et al., 2022), is more than 10 times faster than similar algorithms in the same environment and conditions. XGBoost is an ensemble model that consists of an efficient implementation of decision trees to create a composite model with predictive performance superior to that of using a single technique alone. This model is suitable for situations where the annual data has a small fluctuation range and a relatively stable trend.
The predicted value can be expressed as follows (Equation 11):
The objective function in this model is expressed as (Equation 12):
Where l is the loss function, representing the error between the predicted value of industrial added value and the real value; Ω is a regularization function to prevent overfitting of the model.
Normalizing function (Equation 13):
T represents the number of leaf nodes per tree; W represents the weight of each tree leaf; In order to inhibit tree growth and prevent overfitting of the model, λ and γ are added, where λ is L2 regularization coefficient and γ is the splitting threshold.
According to the objective function, the optimal scoring function is obtained, and the smaller the output value of the function, the better the tree model is, as follows (Equations 14–15):
Among them, G
Land G
Rwere the first step degree statistics of left and right leaves at the time of splitting, respectively. H
Land H
Rare the information gain of the second-order gradient statistical sum of left and right leaf nodes.
(2) CEEMDAN model
The Complete EEMD with Adaptive Noise (CEEMDAN) algorithm is based on the EEMD algorithm but incorporates a method of adding adaptive white noise a finite number of times (
Peng et al., 2023). This overcomes the drawback of EEMD, which tends to have larger reconstruction errors when the number of added white noise instances is limited. This approach not only reduces computation time but also minimizes reconstruction errors (
Yi et al., 2023). This model is suitable for situations where the annual data exhibits clear inflection points and distinct cyclical variations.
1) Step 1
Let S(n) represent the original data sequence, νi(n) be the white noise sequence added for the ith time following a standard normal distribution, and εk be the signal-to-noise ratio for the kth instance. Define Ek(∙) as the operator that generates the kth Intrinsic Mode Function (IMF) through the Empirical Mode Decomposition (EMD) algorithm (Equation 16).
Where
Iis the number of experiments and
Si(n)represents the data series with noise added for the
itime.
2) Step 2
Professional translation
Perform Empirical Mode Decomposition on all
si(n)separately, then sum up all the intrinsic mode functions and take the average to obtain the first mode component
IMF1(n)and the residual
.
3) Step 3
In order to obtain the second modal component,
is decomposed for
Itimes to obtain the first IMF, and finally the second IMF of CEEMDAN (
Equation 17).
4) Step 4
The calculation method of the
kth margin signal is the same as that of step 3,
k= 2, … ,
K, and the
k+1 IMF can be expressed as (
Equations 18–
19):
(5) Step 5
Continue with step 4 until all residual sequences can no longer be decomposed, meaning the number of extreme points in the residual sequence should be less than or equal to two.
The final residual sequence obtained is (Equation 20):
Artificial Neural Network (ANN) is a network model constructed artificially based on the cognitive understanding of the brain’s neural network, consisting of a large number of artificial neurons connected to enable large-scale computation. Overall, artificial neural networks have the following advantages: firstly, they exhibit good fault tolerance; secondly, they possess various adaptive capabilities such as self-organization, self-learning, and reasoning; thirdly, they have nonlinear connections to ensure higher system performance. This model is suitable for situations where the annual data has large fluctuations and shows a clear oscillatory trend. The typical working mechanism of an ANN neuron is illustrated in Figure 3.
FIGURE 3
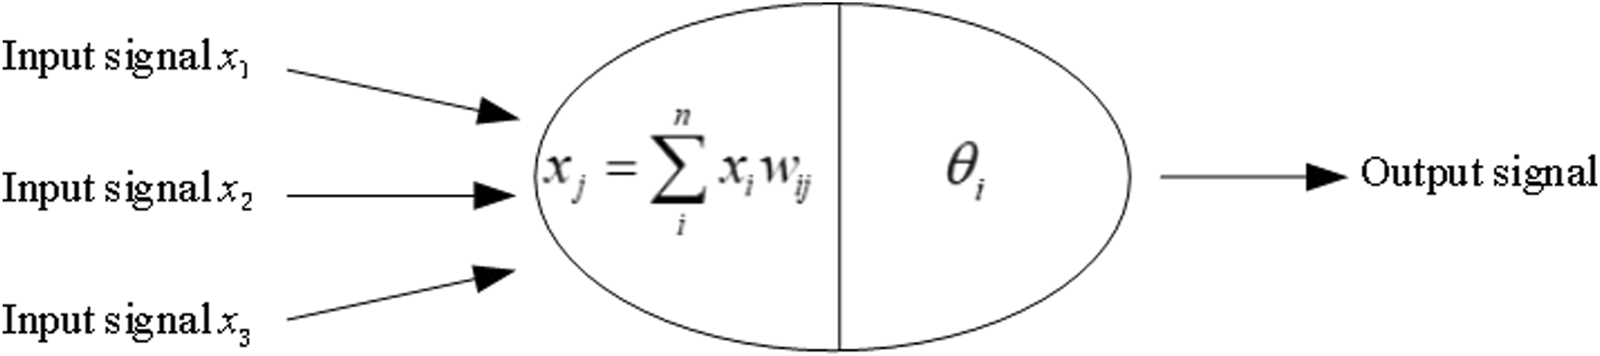
Working mechanism of ANN neurons.
3 Results
Based on historical data, the comparison of the industrial value-added growth in the past 3 years with the national average is shown in Figure 4. The industrial value-added growth rate in Province X has fluctuated significantly over the past 3 years, with large discrepancies between each month and the national average. The region experienced two growth peaks; in addition to the peak in growth rate that all provinces saw at the beginning of 2021, Province X achieved a growth rate of 16.3% in industrial value-added in the second half of 2021, when the national growth rate was slowing down. Since 2022, the growth rate has generally been maintained between 0% and 10%. However, after the second half of 2022, the growth rate has changed rapidly each month, showing less correlation with the national trend.
FIGURE 4
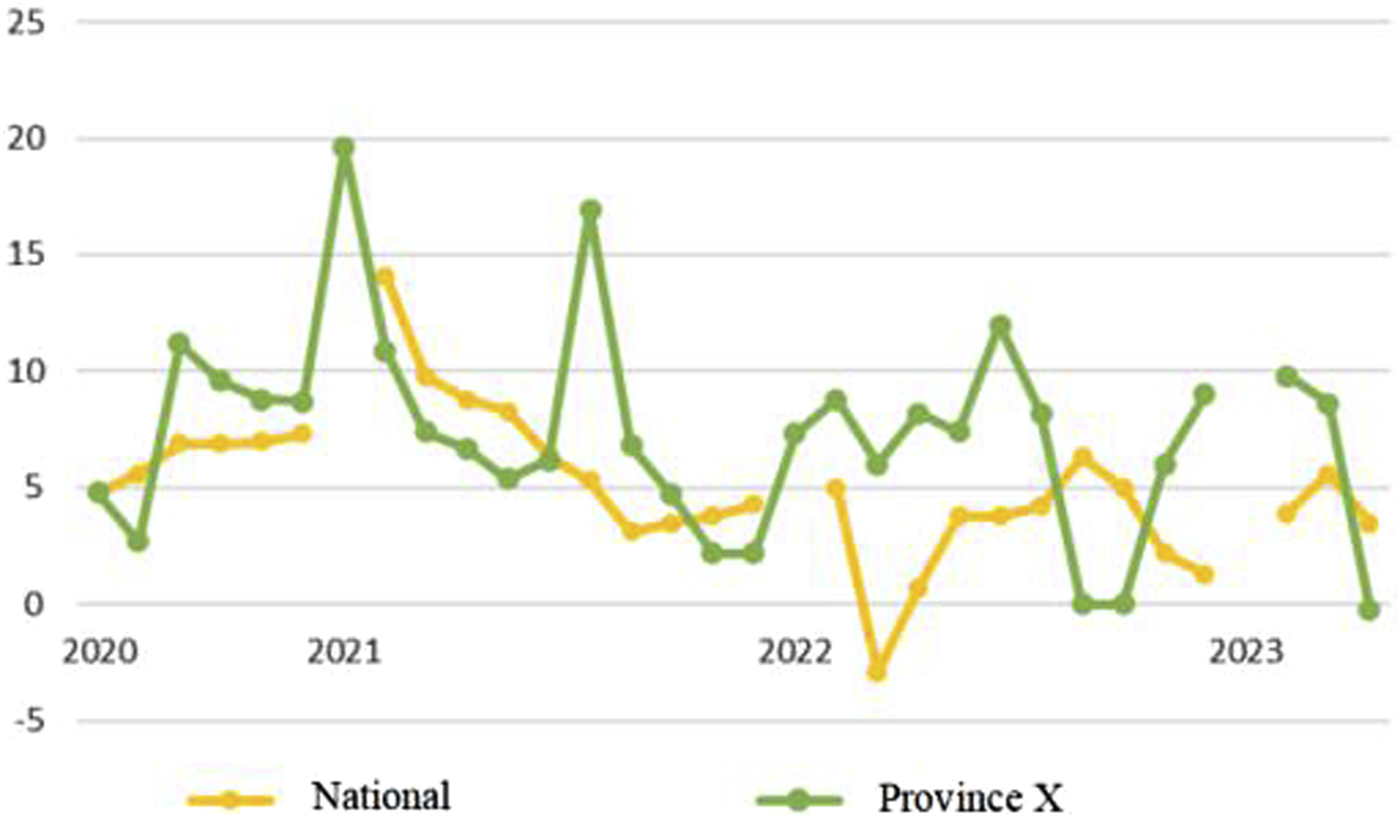
The industrial value-added growth rate of Province X compared with the national average over the past 3 years.
Utilizing the ARIMA-LSTM model, a case study analysis is conducted with Province X as an example (Figure 5). Given the small fluctuation range and relatively stable trend of the data in Province X, the XGboost model is employed as a supplementary approach.From the forecast results of February 2022 to February 2023, the overall prediction accuracy exceeds 96%.
FIGURE 5
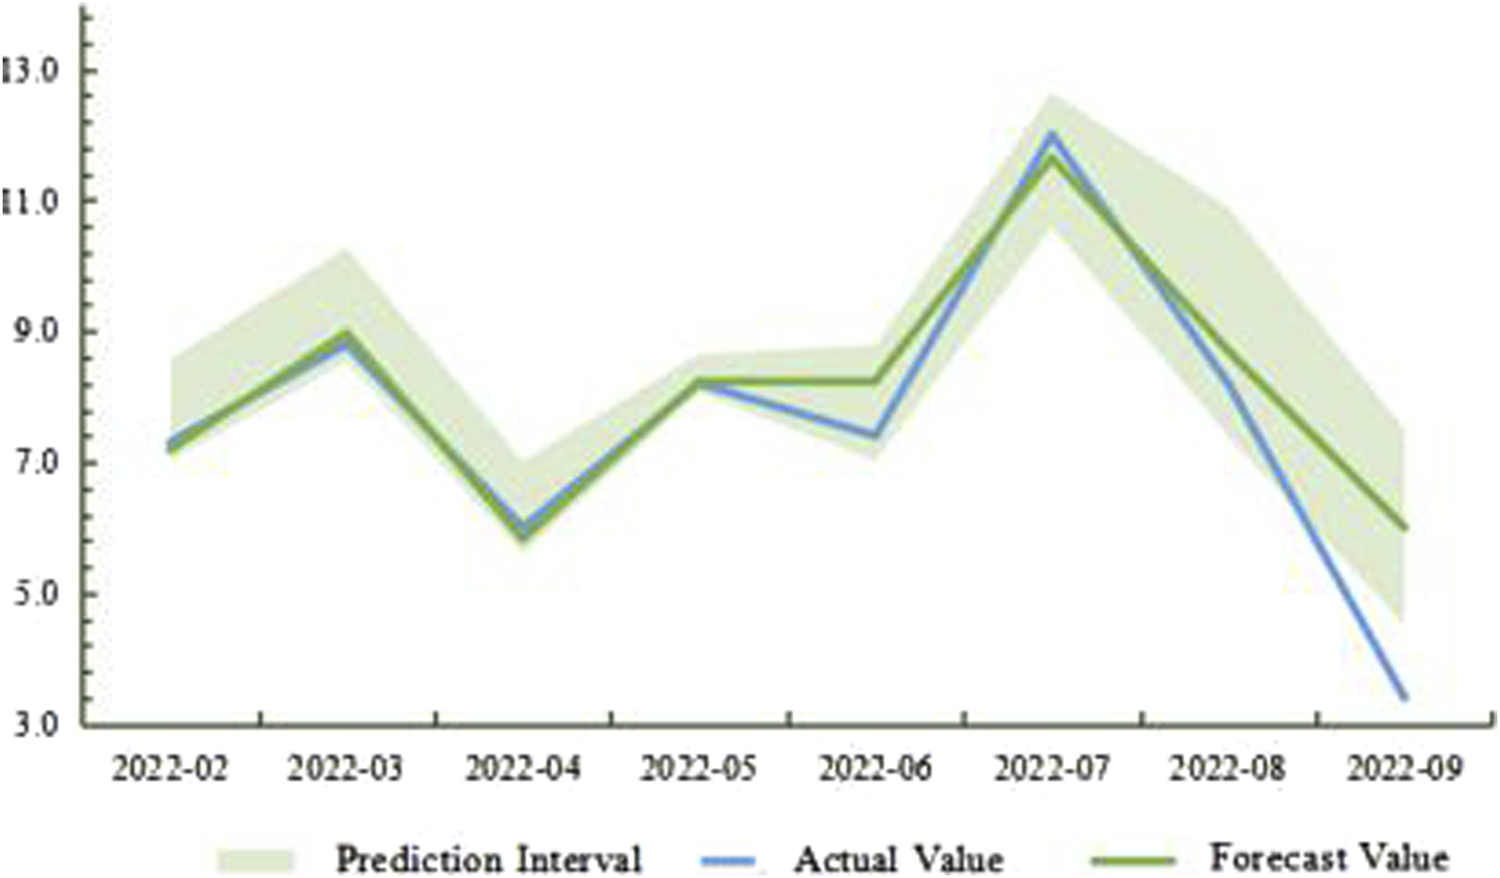
Comparison of forecast and actual values for Province X from February 2022 to February 2023.
4 Conclusion and suggestion
4.1 Conclusion
Currently, the intensifying fluctuations in the domestic and international economic situation, coupled with the rapid iteration of macroeconomic regulation demands, have exposed the inadequacies of the existing economic data statistical system in terms of agility. Utilizing effective tools and measures to closely monitor and accurately predict the domestic and international economic situation has become a primary task to compensate for the deficiencies in the economic early warning system and promote stable and orderly industrial production. This article employs a combination economic forecasting method of “expert interviews + big data technology”. In the expert interview method, based on the Grounded Theory, ten indicators were selected, including the Consumer Price Index, Real Effective Exchange Rate Index, Producer Price Index (PPI), output of key industry products, industrial electricity consumption, electricity consumption in other industries, Business Confidence Index, Macroeconomic Prosperity Index, Purchasing Managers’ Index (PMI), and Baidu Migration Big Data. These ten indicators were summarized into four main categories: price indicators, output indicators, industry external environment indicators, and regional external environment indicators.
In the application of big data technology, by comparing the advantages and disadvantages of business modeling prediction methods and data modeling prediction methods, the ARIMA-LSTM method was chosen as the core, supplemented by XGBoost, CEEMDAN, and ANN models to predict the monthly and cumulative industrial value-added values of four provincial companies. Compared with historical data, the “expert interviews + big data technology” forecasting accuracy reached over 90%.
4.2 Suggestions
The study of the industrial economic level in a region is a systematic and practical research endeavor. In the research process, there are many issues and factors that need to be considered. Therefore, this article puts forward the following suggestions.
(1) Consider Influencing Factors More Comprehensive
The influencing factors of the industrial economic level not only include the factors selected in this article but are also affected by other uncontrollable and unquantifiable factors such as national policy regulations, environmental regulations, various emergencies, natural disasters, etc. Although these factors are not within the scope of this study, they clearly have a significant impact on the regional industrial economic level. Therefore, it is recommended to more comprehensively consider influencing factors in subsequent research and conduct reasonable analysis and predictions.
(2) Enhance Accuracy
While the four models proposed in this article have achieved high accuracy, there is still room for improvement. It is recommended to take multiple approaches, such as adding more data and features, improving model algorithms and parameters, to further enhance accuracy. In current forecasting, combining emerging data with traditional economic data can yield better predictive results. It is suggested to combine a wider range of emerging data categories for current macro variable forecasting. In data processing, strengthening data analysis and visualization is crucial. In research, it is not only essential to collect and process data but also to analyze and visualize it. Data analysis and visualization can help us understand the characteristics and patterns of data more intuitively, identify outliers and trends in the data, and optimize model parameters and algorithms. Additionally, data analysis and visualization can provide decision-makers with intuitive data support for better policy formulation and measures. Therefore, in subsequent research and applications, there is a need to strengthen data analysis and visualization capabilities to maximize the value of data.
(3) Implementation and Improving Local Development Efficiency
The new monthly industrial value-added forecasting model can help local governments better understand and predict the changing trends of industrial value-added, thereby formulating more effective policies and measures to promote local economic development. It is recommended to fully consider practical factors such as data availability and quality, policy feasibility, and implementation strength during the application process to enhance the efficiency of serving local development. Moreover, when monitoring (predicting) macroeconomic development, it is important to focus on indicators such as infrastructure, electricity consumption, GDP growth, industrial value-added, ASEAN import and export trade, transportation, etc. These indicators can provide a comprehensive understanding of the macroeconomic situation for the government to better formulate macroeconomic policies. Additionally, in the implementation process, attention should also be paid to various indicators of industrial enterprises to guide companies in improving asset structures, enhancing capital utilization efficiency, introducing advanced technologies, saving unnecessary energy usage, focusing on environmental protection, and reducing industrial environmental pollution.
Furthermore, in the study of the industrial economic level, the following aspects can also be considered:
(1) Regional Disparities
There may be significant differences in the industrial economic levels of different regions, stemming from factors such as different histories, cultures, natural conditions, and industrial structures. Therefore, when conducting research, it is necessary to fully understand and compare the characteristics of different regions. By comparing the industrial economic levels of different regions, we can better identify issues and strengths. For example, the relatively high industrial economic level in some regions may be closely related to their industrial structure and advanced technology, while the relatively low industrial economic level in other regions may be related to factors such as resource endowment and policy environment. Therefore, in-depth comparison and analysis of the industrial economic levels of different regions are needed.
(2) Formulation of Regional Development Strategies
The enhancement of the industrial economic level requires a comprehensive perspective and long-term vision, necessitating the formulation of rational regional development strategies. Regional development strategies involve analyzing the internal and external environments of the region, its own conditions, and resources to determine the direction and goals of regional future development and formulate corresponding policies and measures. The formulation of regional development strategies needs to consider the characteristics and differences of different regions while aligning with national development strategies. When formulating regional development strategies, it is essential to consider the improvement of the industrial economic level, adopt policies and measures conducive to industrial economic development, and lay a solid foundation for the long-term development of the local economy.
(3) Promotion of Technological Innovation
Technological innovation is one of the key factors in enhancing the industrial economic level. In the current economic development environment, technological innovation can improve industrial production efficiency, enhance product quality, and reduce production costs. Therefore, in the study of the industrial economic level, it is necessary to strengthen the promotion of technological innovation. Specifically, increased investment in technology research and development, talent introduction, technology transfer, etc., can promote the transformation and application of technological achievements.
In conclusion, the study of the industrial economic level requires consideration of various factors and issues. Through continuous exploration and practice, more positive contributions can be made to promote the development of the local economy.
Statements
Data availability statement
The datasets presented in this article are not readily available because Confidentiality and Sensitivity Requirements. Requests to access the datasets should be directed to 452601331@qq.com.
Author contributions
ZL: Writing–review and editing, Data curation. SF: Resources, Writing–review and editing, Formal Analysis, JY: Data curation, Methodology, Writing–original draft, Writing–review and editing. BY: Methodology, Writing–review and editing, Formal Analysis. HT: Writing–original draft, Writing–review and editing, Formal Analysis.
Funding
The author(s) declare that financial support was received for the research, authorship, and/or publication of this article. This study was funded by the Data Application—2022 Company Power Big Data Expansion Application (Electric Power Sees the Economy—Economic Special Research) project funds.
Conflict of interest
Authors ZL, Jy, and BY were employed by State Grid Energy Research Institute Co., Ltd. Author SF was employed by State Grid Corporation of China.
The remaining authors declare that the research was conducted in the absence of any commercial or financial relationships that could be construed as a potential conflict of interest.
The authors declare that this study received funding from the Data Application—2022 Company Power Big Data Expansion Application. The funder had the following involvement in the study: collection and interpretation of data.
Publisher’s note
All claims expressed in this article are solely those of the authors and do not necessarily represent those of their affiliated organizations, or those of the publisher, the editors and the reviewers. Any product that may be evaluated in this article, or claim that may be made by its manufacturer, is not guaranteed or endorsed by the publisher.
Supplementary material
The Supplementary Material for this article can be found online at: https://www.frontiersin.org/articles/10.3389/fenrg.2024.1443597/full#supplementary-material
References
1
Calvert S. Smythe E. McKenzie-Green B. (2017). Working towards being ready": a grounded theory study of how practising midwives maintain their ongoing competence to practise their profession. Midwifery50, 9–15. 10.1016/j.midw.2017.03.006
2
Christensen P. Gillingham K. Nordhaus W. (2018). Uncertainty in forecasts of long-run economic growth. Proc. Natl. Acad. Sci.115 (21), 5409–5414. 10.1073/pnas.1713628115
3
Fan Z. Zhou H. Liu Z. (2020). Visual analysis of research hotspots and evolution path of domestic economic growth quality. Res. Finance Educ.33 (03), 42–53.
4
Fang P. Qi Y. Junda R. Huolan C. (2021). Current forecasting of industrial added value based on power big data -- analysis based on LSTM. Price:Theory Pract.445 (07), 110–114. 10.19851/j.cnki.cn11-1010/f.2021.07.178
5
Feldman M. Hadjimichael T. Lanahan L. Kemeny T. (2016). The logic of economic development: a definition and model for investment. Environ. Plan. C Gov. Policy34 (1), 5–21. 10.1177/0263774x15614653
6
Feltrin C. Newton J. M. Willetts G. (2019). How graduate nurses adapt to individual ward culture: a grounded theory study. J. Adv. Nurs.75 (3), 616–627. 10.1111/jan.13884
7
Fernandez C. Ley E. Steel M. F. J. (2001). Model uncertainty in cross‐country growth regressions. J. Appl. Econ.16 (5), 563–576. 10.1002/jae.623
8
Han Z. Xiao F. (2014). Fluctuation and prediction of Industrial added value in China. Statistics Decis.410 (14), 125–127.
9
Hu D. Xing Y. (2018). Decomposition and Measurement of total factor productivity from the perspective of new development Concept. Based on samples from Jiangxi Province. Res. Finance Educ.31 (06), 38–47.
10
Huber F. Yushchenko A. Stratmann B. Steinhage V. (2022). Extreme gradient boosting for yield estimation compared with deep learning approaches. Comput. Electron. Agric.202, 107346. 10.1016/j.compag.2022.107346
11
Hunt S. D. (2011). Sustainable marketing, equity, and economic growth: a resource-advantage, economic freedom approach. J. Acad. Mark. Sci.39, 7–20. 10.1007/s11747-010-0196-3
12
Jiang Q. (2021). Explore the road of marketization of data elements for value. China Internet Wkly.732 (06), 70–71.
13
Levine R. Renelt D. (1992). A sensitivity analysis of cross-country growth regressions. Am. Econ. Rev., 942–963.
14
Liu L. Wang Q. Wang J. Liu M. (2016). A rolling grey model optimized by particle swarm optimization in economic prediction. Comput. Intell.32 (3), 391–419. 10.1111/coin.12059
15
Mei K. (2006). Decomposition of economic growth factors and economic growth quality under investment growth model. J. Quantitative Technol. Econ. (02), 153–160.
16
Muhammad A. H. Q. (2011). Financial development index and economic growth: empirical evidence from India. J. Risk Finance12 (2), 98–111. 10.1108/15265941111112820
17
Niu Y. McSherry W. Partridge M. (2020). An understanding of spirituality and spiritual care among people from Chinese backgrounds: a grounded theory study. J. Adv. Nurs.76 (10), 2648–2659. 10.1111/jan.14474
18
Peng R. Dong K. Liu X. Wang J. (2023). Short-term load forecasting based on CEEMDAN and Transformer. Electr. Power Syst. Res.214, 108885. 10.1016/j.epsr.2022.108885
19
Qian X. Hui K. (2009). Measurement of the quality of China’s economic growth. J. Quantitative Technol. Econ.26 (06), 75–86.
20
Ren B. (2012). Connotation, characteristics and Measurement of economic growth quality. Soc. Sci. Heilongjiang132 (03), 50–53.
21
Segnon M. Gupta R. Bekiros S. Wohar M. E. (2018). Forecasting US GNP growth: the role of uncertainty. J. Forecast.37 (5), 541–559. 10.1002/for.2517
22
Shen K. (2010). Foreign technology transfer and the quality of domestic economic growth. An examination based on China’s regional panel data. China Ind. Econ.272 (11), 5–15.
23
Shi B. Ren B. (2018). Measurement and Analysis of high-quality inter-provincial economic development in China. Econ. Problems464 (04), 1–6. 10.16011/j.cnki.jjwt.2018.04.001
24
Solow R. M. (1956). A contribution to the theory of economic growth. Q. J. Econ.70 (1), 65–94. 10.2307/1884513
25
Sun R. Fang Y. (2020). Research on the influence mechanism of big data on enterprise competitiveness in the digital era. Price:Theory Pract.429 (03), 171–174.
26
Tian L. Feng L. Yang L. Guo Y. (2022). Stock price prediction based on LSTM and LightGBM hybrid model. J. Supercomput.78 (9), 11768–11793. 10.1007/s11227-022-04326-5
27
Wongboonsin K. Phiromswad P. (2017). Searching for empirical linkages between demographic structure and economic growth. Econ. Model.60, 364–379. 10.1016/j.econmod.2016.09.023
28
Xiu J. Liu H. Zang X. (2015). Research on industrial growth and forecast under green credit, energy conservation and emission reduction. Modem Econ. Sci.37 (03), 55–62+126.
29
Xu R. (2018). High quality development indicators and their influencing factors. J. Financial Dev. Res.442 (10), 36–45.
30
Yi J. An H. Xing Y. Li J. Zhang G. Bamisile O. et al (2023). A cyber attack detection strategy for plug-in electric vehicles during charging based on CEEMDAN and Broad Learning System. Energy Rep.9, 80–88. 10.1016/j.egyr.2022.12.094
31
Yu T. Xiang L. Wu D. (2016). Grey system and BP neural network model for industrial economic forecasting. Recent Pat. Comput. Sci.9 (1), 40–45. 10.2174/2213275908666150831194125
Summary
Keywords
industrial added value, power data, grounded theory, expert interviews, big data technology
Citation
Liu Z, Fan S, Yuan J, Yang B and Tan H (2024) Monthly industrial added value monitoring model with multi-source big data. Front. Energy Res. 12:1443597. doi: 10.3389/fenrg.2024.1443597
Received
04 June 2024
Accepted
03 July 2024
Published
14 August 2024
Volume
12 - 2024
Edited by
Zening Li, Taiyuan University of Technology, China
Reviewed by
Bożena Gajdzik, Silesian University of Technology, Poland
Guiying Wei, University of Science and Technology Beijing, China
Updates
Copyright
© 2024 Liu, Fan, Yuan, Yang and Tan.
This is an open-access article distributed under the terms of the Creative Commons Attribution License (CC BY). The use, distribution or reproduction in other forums is permitted, provided the original author(s) and the copyright owner(s) are credited and that the original publication in this journal is cited, in accordance with accepted academic practice. No use, distribution or reproduction is permitted which does not comply with these terms.
*Correspondence: Jiaqi Yuan, yuanjiaqi@sgeri.sgcc.com.cn
Disclaimer
All claims expressed in this article are solely those of the authors and do not necessarily represent those of their affiliated organizations, or those of the publisher, the editors and the reviewers. Any product that may be evaluated in this article or claim that may be made by its manufacturer is not guaranteed or endorsed by the publisher.