 Xuebao Jiang1*
 Haiou Cao
- 1State Grid Suzhou Power Supply Company, Suzhou, China
- 2State Grid Jiangsu Electric Power Company, Nanjing, China
Against the backdrop of smart grid development, the electric power system demands higher accuracy and comprehensiveness in fault analysis. Establishing a digital twin platform for multiple equipment faults represents the future direction of power system development. Presently, while many researchers employ artificial intelligence algorithms to diagnose faults in key equipment such as transmission lines and transformers, intelligent diagnostic methods for busbar faults remain insufficient. Therefore, this paper proposes a busbar fault diagnosis method based on multi-source information fusion. Initially, the diagnostic method for busbar faults is explored, conducting both time-domain and frequency-domain analyses on simulated fault data. The data of this model are optimized using Dempster-Shafer evidence theory to enhance algorithm training speed. Subsequently, BP neural network training is implemented. Finally, validation testing of fault data demonstrates a fault recognition accuracy of 99.1% for this method. Experimental results illustrate the method’s feasibility and low computational costs, thereby advancing the development of digital twin platforms for power system fault diagnosis.
1 Introduction
With the ongoing advancement of smart grids, the electric power system is placing greater emphasis on the density, variety, and accuracy of information (Kezunovic, 2011; Palensky and Kupzog, 2013). In contemporary power systems, fault diagnosis has become paramount, necessitating concurrent analysis of fault types at multiple grid locations for unified assessment and planning. In this regard, digital twin platforms have emerged as pivotal tools (Abo-Khalil, 2023; Sifat et al., 2024). By employing artificial intelligence algorithms for fault analysis, digital twin platforms help mitigate the subjectivity inherent in traditional expert analyses, enabling centralized processing of multiple fault datasets, thus enhancing both the speed and precision of fault diagnosis. Nonetheless, the establishment of an effective digital twin platform necessitates the comprehensive integration of fault information from various system components (Wagner et al., 2024).
Within the electric power system, busbars stand out as one of the most critical components (Jankovski et al., 2023), tasked with the crucial functions of power collection and distribution. Their uninterrupted operation directly influences the reliability and safety of the entire power grid. Therefore, timely detection of busbar faults and the prompt identification of fault types are imperative for maintenance. Busbar faults can stem from a multitude of causes, including short circuits, insulation degradation, equipment malfunctions, animal interference, and operational errors (Zou et al., 2018). When a busbar fault occurs, swift intervention is indispensable to uphold the security of the power system. Despite the diverse origins of busbar faults, expedited recognition of the fault type remains the primary focus in fault analysis. Utilizing intelligent algorithms to diagnose bus faults is crucial. With the development of smart grids, the intelligentization of fault diagnosis has become necessary. As a key component of the power grid, the ability to intelligently diagnose faults in buses can significantly enhance the safety factor of the grid and meet the needs of smart grid development.
Currently, the mainstream method for busbar protection is through current differential protection (Song et al., 2020), which can disconnect the faulty line when a fault occurs, maintaining the operation of the power grid under fault conditions until maintenance personnel conduct repairs. However, conventional relay protection methods alone cannot effectively determine the cause of faults, and repair personnel still need to independently identify the type and cause of the fault. The advancement of numerical techniques has provided new solutions for busbar protection, thereby improving the operational stability of the power system (Hughes and Legrand, 2001). Feser et al. (1991) introduced a numerical-based approach utilizing artificial neural networks to recover original signals from saturated CT current signals, preventing misoperations during external faults. Nevertheless, CT errors and ratio mismatches may still lead to misoperations, limiting the development of busbar protection.
To address issues with time-domain analysis, frequency-domain analysis techniques have been widely adopted in fault diagnosis due to their efficient and accurate handling of transient current and voltage analyses (Ahmed et al., 2023; Dang et al., 2023). Gafoor and Rao (2011) investigated the application of wavelet transforms in busbar fault detection, successfully distinguishing between busbar faults and external faults. Their research effectively tested various types of external and internal faults, overcoming issues like CT errors associated with traditional differential protection. However, these methods only offer improvements within either the time or frequency domain, still facing challenges in different operational scenarios. Hence, adopting a diagnostic approach combining multiple protection schemes is necessary (Jimenez-Aparicio et al., 2023), analyzing busbar operations from various perspectives to comprehensively enhance the stability of busbar protection.
On the flip side, artificial intelligence technologies such as neural networks (Xu et al., 2017; Zhu et al., 2022) and deep learning (Feng and Zhao, 2022; Ahmed I. et al., 2023) have made significant strides in the realm of fault diagnosis. Their robust data analysis capabilities enable them to effectively adapt to the intricate nature of power system faults and drive the establishment of digital twin platforms for modern power system fault analysis. For instance, Moldovan and Buzdugan (2023) applied artificial neural networks to enhance fault diagnosis efficiency in distribution systems by pinpointing fault types and locations within cables. Similarly, Li et al. (2020) leveraged BP neural networks to diagnose rolling bearing faults, conducting analyses based on both time-domain and frequency-domain data.
In light of these advancements, this paper proposes a novel busbar fault diagnosis method based on neural networks and electrical signals. This method integrates time-domain and frequency-domain analyses to extract fault waveforms efficiently. By employing DS evidence theory to assign credibility values to collected fault features, the accuracy and efficiency of diagnosis are further augmented. Subsequently, through the integration of signal data from different categories and subsequent neural network training, a robust busbar fault diagnosis model is constructed. This model effectively enhances the accuracy and stability of busbar fault diagnosis. This research addresses the deficiencies in analyzing busbar faults using intelligent algorithms in modern power systems, aligning with the evolving landscape of smart grids.
2 Principle of busbar fault diagnosis
Currently, in diagnosing busbar faults, it is imperative to establish a robust monitoring system for real-time surveillance of busbars and associated equipment within the power grid. Subsequently, the collected data undergoes analysis and processing, either manually or through algorithms. By juxtaposing characteristic parameters under normal operational conditions, anomalies are discerned to ascertain the occurrence of a busbar fault. In the identification and analysis phase, prior researchers predominantly relied on parameters such as differential currents and voltages at pivotal locations within the busbar system for fault analysis. Hence, this section aims to dissect the conventional busbar fault analysis paradigm and devise a differential protection model for a dual-busbar system, as depicted in Figure 1. By scrutinizing prevalent large and small differential protection mechanisms in contemporary power grids, we can attain a more holistic comprehension of the principles, attributes, and application scenarios of such protection schemes, thereby furnishing a more robust assurance for the secure and steadfast operation of power systems.
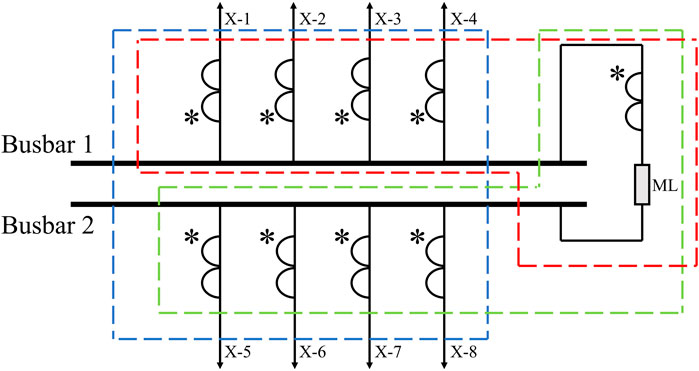
Figure 1. Dual-busbar system differential protection diagram (single-phase example).
Large differential protection involves a differential circuit that includes all branch currents except those from the busbar tie switch and the sectionalizing switch. This allows for determining whether a fault has occurred inside or outside the protected zone. As illustrated by the blue outline in Figure 1, the expression for the large differential current in busbar differential protection is Equation 1:
The function of busbar small differential protection is to determine the specific location of the busbar fault and to identify the type of busbar fault. Its main components include the sum of all branch currents of the busbar itself and the current on the busbar tie switch, as shown by the red and green outlines in Figure 1. The small differential current expressions for different busbars are Equations 2, 3:
Based on the above differential protection setup, when a ground fault occurs on Busbar 1, according to Kirchhoff’s law, we have:
and there is no fault on Busbar 2, so Id2 remains 0. Therefore, by analyzing the small busbar differential current, it is possible to detect faults on the busbar and determine the fault type. Additionally, voltage transformers are installed on Busbar 1 and Busbar 2 to collect voltage waveforms from each busbar, aiding in the analysis of busbar fault types.
Based on the differential current analysis method, real-time monitoring and analysis of voltage and current data collected from critical locations can promptly detect faults and determine their types and occurrence times.
Based on the above theoretical analysis, set parameters using MATLAB programming and establish a double-busbar system with Simulink. For ease of analysis, each busbar is equipped with two outgoing lines. The simulation model of the double-busbar fault diagnosis system is shown in Figure 2. Using this model, it is possible to obtain internal faults, such as three-phase short circuit faults and single-phase ground faults; external faults, and dead zone faults, effectively assisting in the analysis of bus fault characteristics.
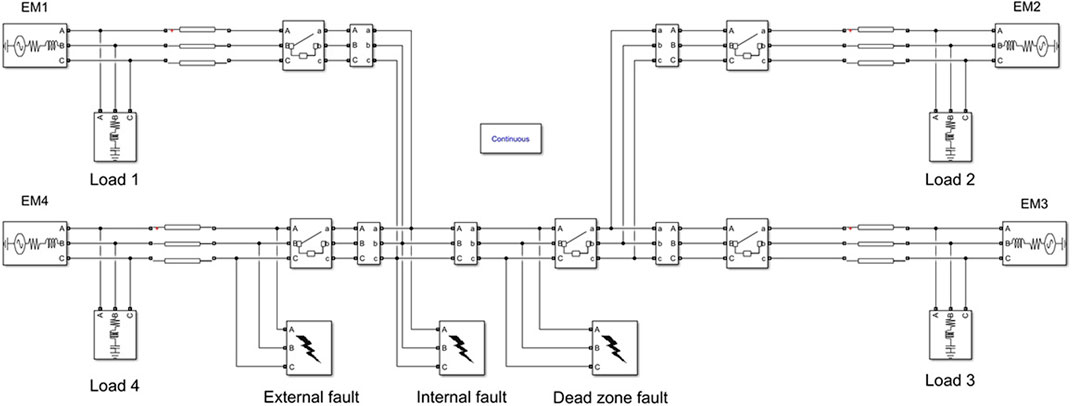
Figure 2. Simulink-established double-busbar fault waveform analysis model.
For example, in the case of a common single-phase ground fault on a busbar, when the fault occurs, the large differential current of the dual-busbar system is first calculated. The waveform, shown in Figure 3A, indicates that the busbar fault occurs within the zone, specifically on phase A of the busbar 1. Next, using Equation 2, the small differential current for Busbar 1 is calculated, revealing a differential current on phase A of Busbar 1. Simultaneously, data from the voltage transformer of Busbar 1 indicates that the voltage of phase A drops to around 0 V at 0.04 s. Consequently, it can be concluded that a ground fault occurred on phase A of Busbar 1 at 0.04 s. By analyzing the three-phase differential currents and voltage waveforms, it is possible to effectively identify the fault type and the fault time for busbar faults.
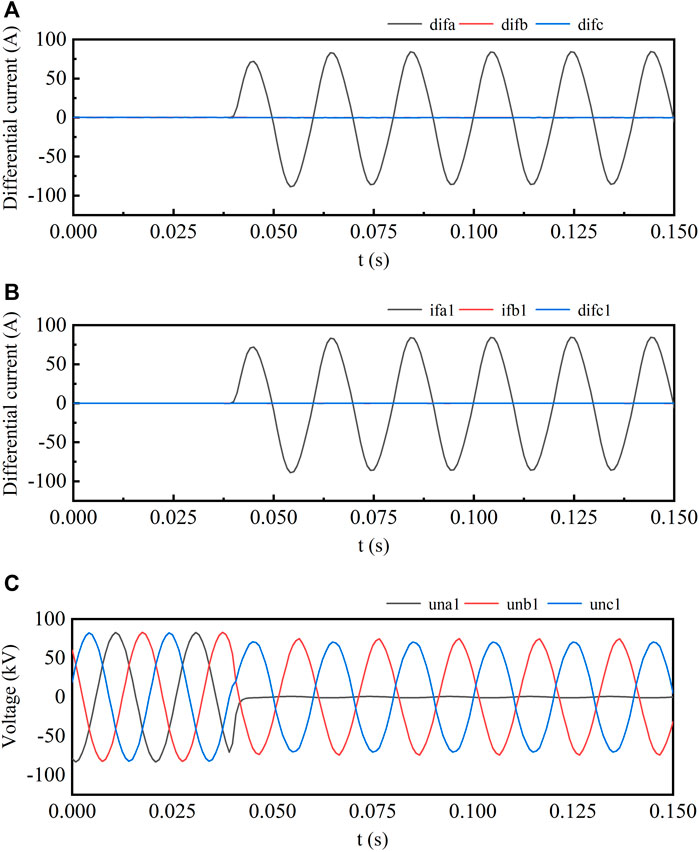
Figure 3. Busbar 1 phase a ground fault waveform. (A) BusbarThree-Phase Large Differential Current Waveform. (B) Busbar1 Three-Phase Small Differential Current Waveform. (C) Busbar1 Three-Phase Voltage Waveform.
On the other hand, in actual grid operations, faults are typically not ideal short circuits but involve a certain level of transition resistance. For instance, tree branches contacting conductors or aging insulation materials can introduce this resistance. Ignoring transition resistance may lead to false alarms or missed detections, thereby affecting the accuracy of busbar fault diagnosis. (Flores and Song, 2019; Jankovski et al., 2023). Consequently, for a more precise fault analysis, it becomes imperative to account for the impact of transition resistors on both the differential currents and voltages when scrutinizing waveforms, facilitating accurate fault detection. As depicted in Figure 4, all three-phase differential currents on Busbar 1 register at 0 A, indicative of an absence of faults on this busbar. Conversely, on Busbar 2, differential currents manifest on phases B and C, exhibiting opposite phases, suggestive of ground faults on these phases. Upon closer inspection of the three-phase voltage waveforms on Busbar 2, only a marginal voltage drop is observed on phases B and C, failing to plummet to 0 V. From this observation, it can be deduced that the fault on phases B and C of Busbar 2 involves grounding through transition resistors.
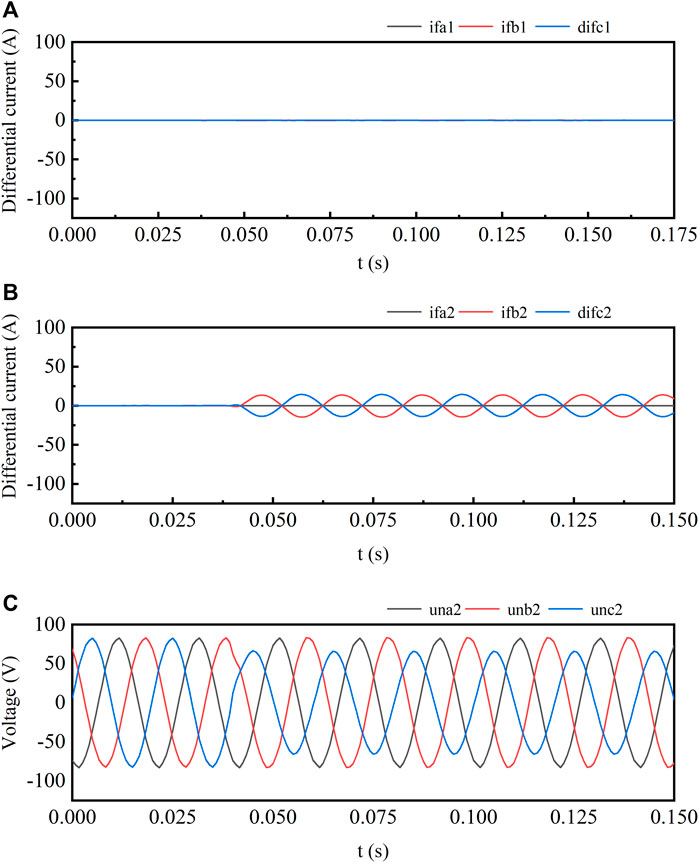
Figure 4. Busbar 2 BC phase ground fault waveform diagram with transition resistors. (A) BusbarThree-Phase Large Differential Current Waveform. (B) Busbar2 Three-Phase Small Differential Current Waveform. (C) Busbar2 Three-Phase Voltage Waveform.
From this, it can be inferred that by analyzing the three-phase differential current waveforms on Busbar 1 and Busbar 2, fault types can be effectively determined. Therefore, when the differential current on the bus exceeds the set value, a fault can be confirmed. By using differential current data collected from different positions on the dual bus, and analyzing the relationship between the three-phase currents, the fault type can be identified. This paper analyzes typical fault types such as three-phase short circuit faults, two-phase grounding faults, two-phase short circuit faults, and single-phase grounding faults on the bus. The main objective is to build a foundational bus fault diagnosis framework, contributing to the goal of intelligent grid diagnosis and filling the gap in the intelligent diagnosis of bus faults.
3 Establishment of busbar fault diagnosis model
In traditional methods, busbar fault types are typically analyzed through busbar differential current waveform analysis, with further confirmation of busbar faults using busbar three-phase voltages. Although this process often allows faults to be isolated by the differential protection system, it does not provide specific fault types through digital analysis methods or transmit fault information to the digital twin platform of the power system to assist remote fault detection and timely maintenance by operators. To adapt to the digitalization of power system fault diagnosis, it is necessary to learn the correlation between fault characteristic waveforms and faults using machine learning methods.
Currently, a large number of researchers utilize neural network technology for fault diagnosis (Xu et al., 2020; Pei and Liu, 2024), while time-domain and frequency-domain analysis are also widely applied in waveform analysis for fault diagnosis (Zhang et al., 2021; Zhang et al., 2023), effectively recording the severity and type of faults. Therefore, this paper proposes a busbar fault diagnosis method based on both time-domain and frequency-domain neural networks. Initially, feature parameters of waveforms in the time and frequency domains are obtained. Evidence fusion is then conducted to reduce the scale of sample data required for training. Finally, a BP neural network is trained to obtain a busbar fault diagnosis model that integrates multi-source data under dual-busbar conditions.
3.1 Time domain analysis
In order to digitize the busbar fault diagnosis process, it is necessary to analyze the busbar fault signals. Time-domain analysis is a crucial method in traditional fault analysis, capable of revealing the temporal variations of voltage and differential current. Through time-domain analysis, temporal characteristics of busbar faults can be obtained. When a busbar fault occurs, characteristics such as the amplitude and phase of the differential current can provide insights into the type of busbar fault (Vásquez et al., 2021). After computing the busbar differential current waveform and voltage waveform, the time-domain feature matrix is calculated through multidimensional matrix computation to obtain time-domain feature parameters. The time-domain feature values for busbar fault diagnosis are shown in Table 1.
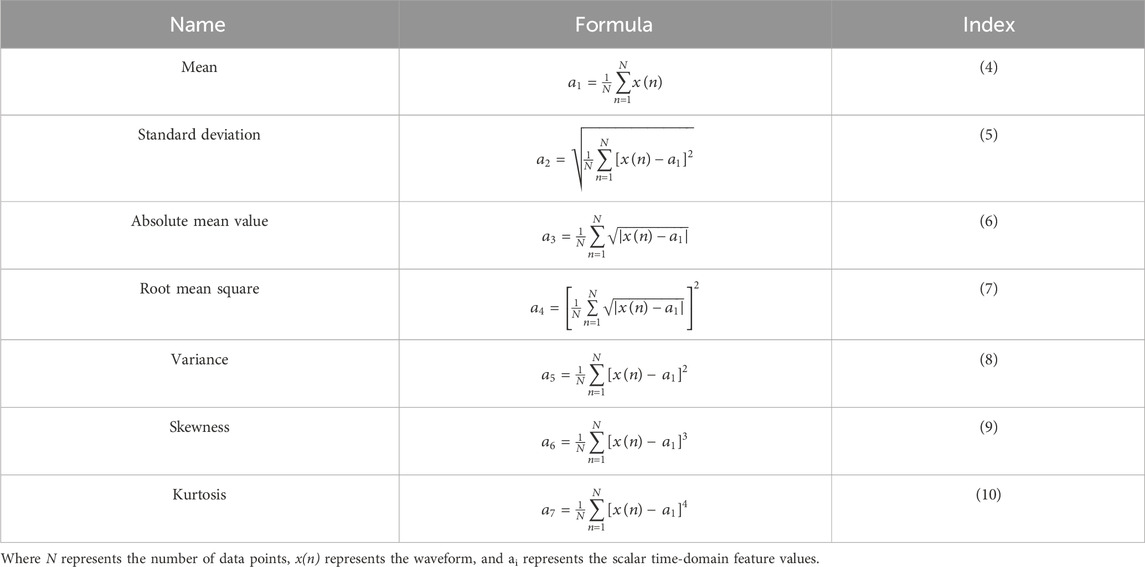
Table 1. Busbar fault time-domain feature values.
By using Equations 4–10, the time-domain basic feature values a1 to a7 of the busbar fault waveform are obtained, representing key time-domain features such as mean and standard deviation. These features can reflect the overall intensity and fluctuation of the busbar waveform, allowing for visualization of the discrete distribution of busbar fault waveforms. By comparing the features during faults with those during normal operation, faults can be effectively detected and analyzed for fault types. In addition, the maximum value, minimum value, and peak-to-peak value are also recorded, providing various aspects of information regarding the amplitude range of the busbar fault waveform as shown in Equations 11–13. This helps in documenting the busbar fault differential current and fault voltage, assisting in the analysis of fault types.
Through the above formulas, the characteristic parameters of traditional time-domain analysis have been derived. These parameters serve to represent the temporal variations of the busbar differential current waveform and voltage waveform, enabling the identification of busbar fault types. To further reflect the time-domain features of the fault waveform and enhance diagnostic accuracy, calculations have been performed on various indicators of time-domain analysis.
f1 represents the fluctuation index, which can reflect the volatility or vibration of the busbar fault signal. Its significance lies in quantifying the degree of signal variation relative to the overall signal amplitude, thus indicating the severity of the busbar fault occurrence. This parameter is helpful in analyzing fault types and fault locations. Its expression is as shown in Equation 14:
f2-f4 represent the peak value indices, which record the ratio of the fault waveform peak value to the standard deviation, absolute standard deviation, and variance amplitude, respectively. These indices quantify the peak characteristics of the signal relative to the overall strength or energy of the signal. They are helpful in quantitatively evaluating the amplitude characteristics of busbar differential current and voltage waveforms, facilitating the analysis and comparison of busbar faults under different voltage levels. Their expressions are as shown in Equations 15–17:
The skewness index f5 and kurtosis index f6 reflect the degree of skewness and sharpness of the fault data distribution relative to the degree of data dispersion. They quantify the dispersion of fault waveform signals. The expressions are as shown in Equations 18, 19:
By conducting time-domain analysis on fault waveforms, a set of time-domain feature values can be derived, and various metrics computed. These metrics aid in quantifying waveform fluctuation and dispersion along the time axis, laying the groundwork for subsequent fault diagnosis and analysis. When a fault occurs, the differential current surges, and the peak value of the waveform increases significantly. Depending on the fault type, the changes in time-domain feature values such as amplitude, mean, and kurtosis vary. These characteristics can be used to distinguish between different types of bus faults. However, incorporating numerous fault features can lead to neural network overfitting, rendering it inadequate for typical busbar fault scenarios. Hence, subsequent steps involved fault feature data fusion to mitigate this issue, consequently enhancing the reliability of fault features.
3.2 Frequency domain analysis
Using only time-domain analysis is insufficient for effectively eliminating signal noise and measurement errors when analyzing busbar faults. Therefore, it's necessary to employ various approaches for busbar fault analysis. Frequency domain analysis has been widely recognized in the field of fault diagnosis (Tian et al., 2023), playing a critical role in providing insights into system status, extracting fault features, and predicting warnings. By transforming signals into the frequency domain, frequency domain analysis can identify frequency components associated with specific fault patterns, aiding engineers in problem localization (Guo et al., 2023). Additionally, by monitoring changes in frequency domain features, frequency domain analysis can identify early signs of potential system faults, enabling fault prediction and warning to prevent system downtime or damage. Moreover, frequency domain analysis exhibits certain resistance to interference, capable of removing noise and disturbances, thereby enhancing signal clarity and accuracy. When a fault occurs, the spectrum of busbar differential current and voltage signals shows a phenomenon of energy concentration, with significant increases in amplitude at certain frequency bands. This is particularly evident at low frequencies and at integer multiples of the power frequency (harmonic frequencies). Additionally, due to the occurrence of unbalanced faults, harmonic components in the fault signals also increase. Analyzing the frequency domain characteristics of the busbar enables diagnosis of typical busbar faults. Therefore, this paper also performs frequency domain analysis on fault waveforms, utilizing multidimensional matrix calculations to obtain the following feature values, reflecting the frequency domain characteristics of fault data, as shown in Table 2.
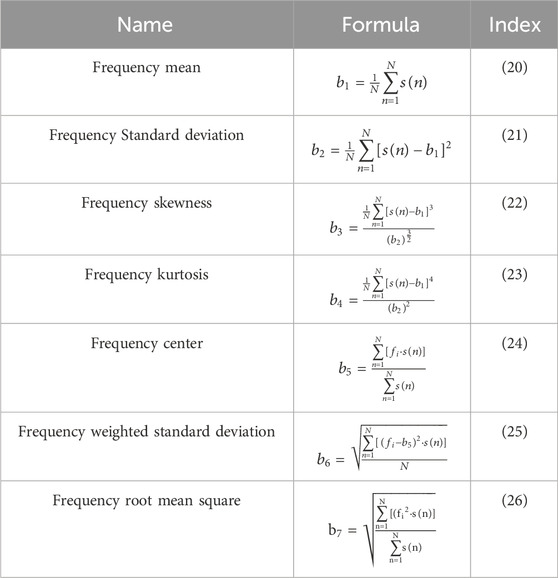
Table 2. Busbar fault frequency-domain feature values.
Through Equations 20–26, the frequency domain features b1-b7 are obtained, representing the commonly used frequency domain characteristics of the busbar differential current, such as mean, standard deviation, frequency center, etc. These features can reflect the dispersion or concentration of the frequency spectrum during busbar faults, thereby avoiding the noise and errors existing in the time domain in conventional measurements and effectively improving the accuracy of fault analysis. Additionally, Equations 27–32 are utilized to further derive the characteristics of the main frequency band of the busbar fault signal, as shown in Table 3.
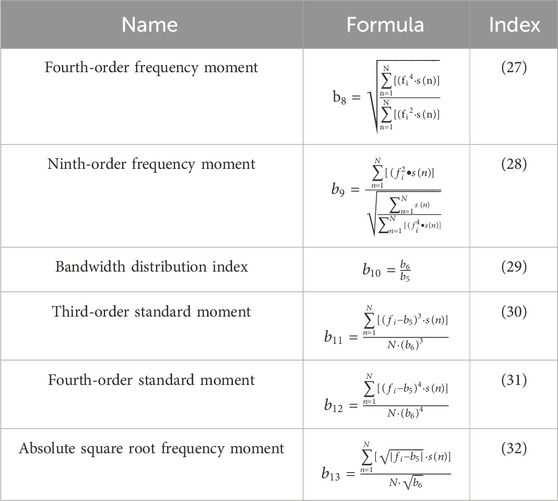
Table 3. Busbar fault waveform main frequency band characteristics.
Through frequency domain feature values b8–b13, the distribution of the main frequency band in the differential current and fault voltage during busbar faults is recorded, allowing for quantitative analysis of their dispersion and concentration. Comparing these values with those during normal operation enables fault detection, facilitating the establishment of a busbar fault diagnosis model. By separately computing the frequency domain feature values during busbar faults using multidimensional matrices, characteristics such as the dispersion of the fault signal in the frequency domain and the distribution of the main frequency band can be reflected. Detecting changes in frequency domain features allows for the early detection of busbar faults. The combined application of frequency domain analysis and time domain analysis in neural network training corroborates each other, enhancing training accuracy.
3.3 Neural network construction
To establish the relationship between the fault waveform and the fault type during busbar fault occurrence, it is necessary to construct a neural network training model that comprehensively analyzes the influence of various parameters in both the time domain and the frequency domain. Artificial neurons are simplified abstractions of the information transmission process in biological neurons and serve as the basic units for controlling and processing information in neural networks (Fan and Xing, 2021). Multiple artificial neurons with simple functions are interconnected through specific topological structures to form a neural network. The transmission of signals between these neurons accomplishes the information processing function of the neural network, while the continuous adjustment and modification of connection weights complete the training and learning process of the neural network. The neuron has multiple inputs xj (j = 1,2,3, … ,n) and a single output y, expressed as shown in Equation 33:
By using Wj to represent the strength of connections between neurons and the transfer function F(x) to simulate the transmission characteristics of biological neurons, the information transfer of artificial neurons is achieved. After connecting several neurons, adjustments and corrections are made to Wj to train the neural network.
The backpropagation (BP) neural network is currently the most widely used neural network, with a nonlinear transfer function for its neurons (Wang et al., 2022). In the BP network, the first layer computes the output of each neuron by backward propagation using known training samples. The last layer computes the weights and thresholds by forward propagation using the established network structure, weights from the previous iteration, and thresholds. This process iterates until convergence. The main idea of the backpropagation network is to propagate signals forward and errors backward, continuously adjusting the weights and thresholds of each layer of the network (Zhang et al., 2018). Therefore, it can quickly establish the connection between the characteristics of busbar faults and fault types. Through the iterative process of establishment and correction, the relationship between fault characteristics and fault types is determined, thereby achieving busbar fault diagnosis.
At the same time, the BP network can globally approximate functions. The configuration of hidden layers allows it to quickly adapt to the requirement of establishing the relationship between the characteristics of busbar faults and the types of busbar faults. For conventional feature parameters, the training of the BP neural network adopts gradient descent to gradually minimize errors. The transfer function chosen is the continuous derivative Sigmoid function, as shown Equation 34:
For fault characteristics that vary in the positive and negative domain, the transfer function of neurons during training adopts the hyperbolic function, namely the symmetric Sigmoid function, as shown in the formula:
Therefore, for the time-domain and frequency-domain characteristic parameters of busbar faults, different transfer functions were set based on the numerical distribution range, enabling effective calculation and transmission of weights in the BP neural network neurons for busbar fault diagnosis.
3.4 Busbar fault diagnosis model
The relationship between the time-domain and frequency-domain characteristics of busbar faults and their corresponding fault types is not straightforward or easily discernible. Neural network algorithms are particularly effective in such scenarios, as they can learn and identify hidden relationships between parameters through training on sample data without prior knowledge of the input-output relationship. This enables the establishment of a mapping between the input and output of the samples. The inputs for the neural network training of the busbar fault diagnosis model include the following:
The outputs of the neural network include:
In this context, Xi represents the key parameters that need to be correlated with the fault results during a busbar fault. These parameters mainly include the busbar small differential current, large differential current, and busbar voltage, with each row representing a sample and n indicating the number of samples. For each feature waveform, a and b represent the characteristic values obtained from time-domain and frequency-domain analyses, respectively. The output yi of the network corresponds to the fault type associated with each sample. By establishing a hidden layer, the neural network system can effectively correlate the time-domain and frequency-domain characteristics of the fault waveform with the fault type, thereby achieving fault diagnosis. Therefore, a three-layer network structure was established for model training, as illustrated in Figure 5:
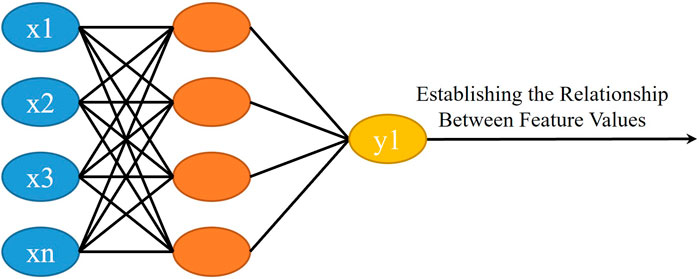
Figure 5. Fault analysis and diagnosis network model.
However, the selection of numerous characteristic parameters inevitably leads to computational complexity and uncertainty in the training process. Dempster-Shafer Evidence Theory (DS Theory), a mathematical framework for handling uncertainty and incomplete information (Fu et al., 2021), is often used in data fusion and decision support systems (Peng and Zhang, 2021). The basic representation structure of DS Theory is the belief structure (Wang and Wang, 2023). The structure is defined by Equations 38–40:
In this context, m(Y) represents the basic probability number of Y, expressing the degree of belief in the hypothesis set Y given the current environment. Bel(A) denotes the sum of the basic probabilities of all subsets of the hypothesis set X in the current environment, indicating the overall degree of belief in X. In this paper, the degrees of belief in the time-domain and frequency-domain characteristic values are assigned based on the results of specific training and literature findings (Peng and Zhang, 2021; Wang et al., 2023). Among them, analyze the results obtained from training separately in the time domain and the frequency domain. By combining the solution process of time domain and frequency domain characteristic values, the importance of key characteristic values can be enhanced. After assigning these values, different data are combined using the following formula, where K is the normalization factor of the evidence, which can handle conflicts between different pieces of evidence and improve data fusion. Using the DS Theory, the time-domain feature values a1−a16 and the frequency-domain feature values b1-b13 are fused to obtain the network input for training the busbar fault model:
Among them, m1-m10 are the feature parameters after data fusion, comprehensively reflecting the time-domain and frequency-domain characteristics of busbar fault waveforms. Using this method, the complex time domain and frequency domain characteristic values are optimized. The input samples for the BP neural network are optimized, thereby improving the efficiency and accuracy of the diagnosis. By integrating multi-source fault information, the reliability of model training is ensured, and the training time cost is reduced.
After optimizing the network input, the number of neurons in the hidden layer was optimized. This is typically determined through step-by-step experimentation using empirical formulas. If the number of hidden layer nodes chosen is too small, it will increase the network prediction error, prolong training time, and fail to accurately represent the relationship between network input and output. Conversely, if the number of hidden layer nodes is too large, it will cause overfitting, making the network overly sensitive to noise and errors in the data, thus unable to generalize to new data. Therefore, trial-and-error training was conducted in this study. To shorten training time and ensure training accuracy, the number of neurons was set to 80. For the transfer function of the neurons, it was designed according to Equations 35, 36, applying different transfer functions to different categories of fused feature values to effectively reduce training error.
When selecting the learning rate η for the network, the stability of the training process should be considered. If the chosen η value is too small, the training time will be prolonged and the convergence speed will be too slow. Conversely, if the η value is too large, the changes in network connection weights during the weight adjustment process will be excessive. Sometimes, the weights might surpass the minimum error threshold, causing the algorithm to fail to converge. Therefore, to ensure stability, a relatively small value is generally chosen as the learning rate for the fault diagnosis system, typically ranging between 0.1 and 0.7. In this study, 0.1 was selected as the learning rate for the busbar fault diagnosis model.
In this study, the maximum training time for the busbar fault neural network was set to 1,000, and the training error target was set to 0.001. Based on the fundamental fault types of the bus, label classification is conducted with five labels set: normal state, three-phase short circuit fault, two-phase grounding fault, two-phase short circuit fault, and single-phase grounding fault. Figure 6 reflects the overall framework of the intelligent diagnosis of busbar faults, which can effectively meet the requirements of the digital twin platform for power systems. By collecting data from voltage and current transformers, faults can be quickly identified and reported to the system. The input data for training the model is obtained from the simulation model established in Chapter 2. Simulate and obtain 35 sets of bus fault waveforms, including voltage and current waveforms measured by transformers at different locations in the double-bus system.
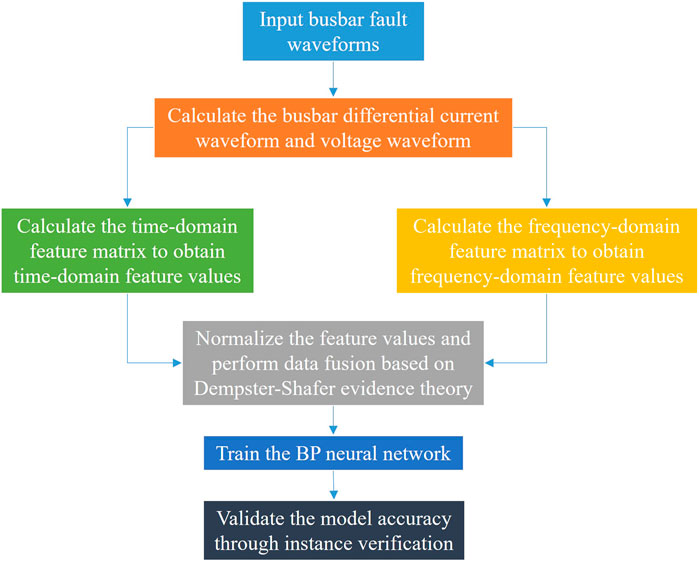
Figure 6. The process of building an intelligent diagnosis model for busbar faults.
After the model training was completed, we characterized the training results in detail using Mean Squared Error (MSE), as shown in Figure 7. MSE is a commonly used metric to evaluate the difference between the model’s predicted values and the actual observed values. A smaller MSE value indicates a smaller difference between the model’s predicted results and the true values, indicating a better fit of the model. It is clearly observed in the graph that with an increasing number of training cycles, the MSE steadily decreases, gradually approaching our designated target value. By the 80th cycle, the training error had already reached our expected requirement level, and the training was terminated prematurely.
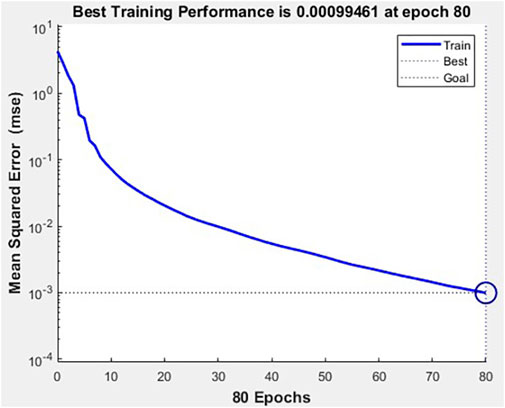
Figure 7. The change curve of MSE.
By further examining Figure 8, we can observe the changes in the training gradient and the display of training errors. It is evident that as the training epochs increase, the training gradient rapidly decreases, indicating that the model is able to converge smoothly and reach the optimal solution during the training process. Additionally, the figure shows that the training errors are essentially zero, demonstrating the model’s excellent performance and stability during the training phase.
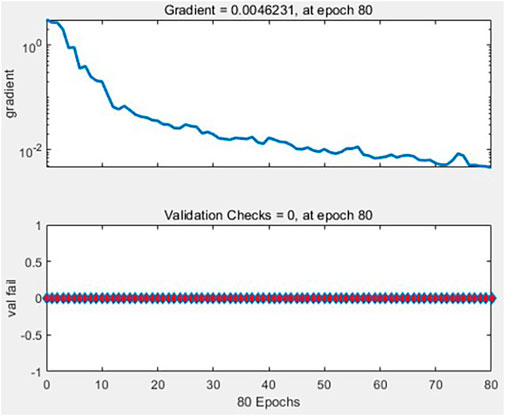
Figure 8. Training measurement trends.
Figure 9 shows the regression curve of the busbar fault model training, with an accuracy reaching 99.0%. This confirms that the model training results are good, and the accuracy is high, meeting the requirements for precise fault identification of busbar systems in the digital twin platform for power systems.
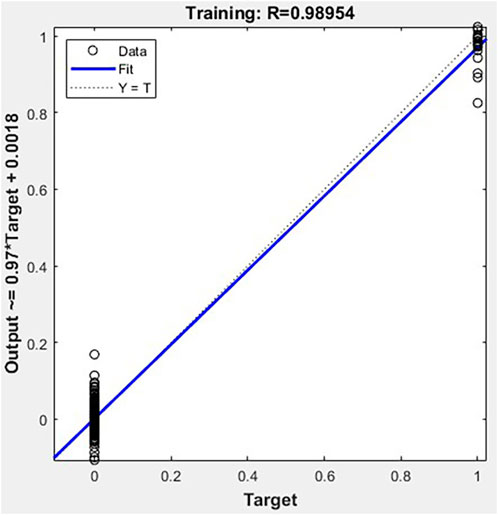
Figure 9. Training regression curve.
4 Discussion of results
Based on the fault sample data obtained from busbar dynamic simulation, an intelligent diagnostic model for busbar faults was developed. This model analyzes and predicts busbar fault waveforms. Forty sets of test data were input into the model for simulation. Each set of data consists of waveform data measured by voltage and current transformers in a double busbar system. The diagnostic model first performs time-domain and frequency-domain analysis on the fault data to obtain feature values. Then, it undergoes evidence fusion, and finally, prediction is made through the trained neural network. Figure 10 shows the comparison between the predicted results and the actual results. The accuracy is 99.1%, which effectively meets the requirements for fault diagnosis.
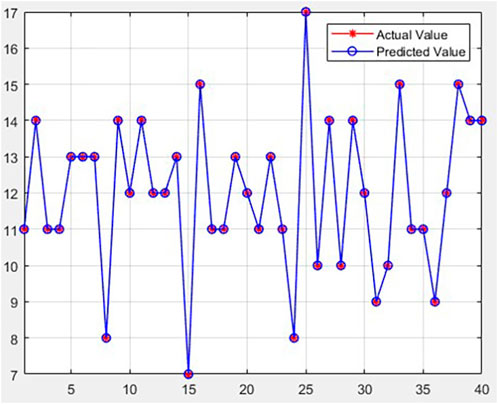
Figure 10. Comparison of test set prediction results.
In Table 4, comparison of different fault diagnosis models based on time-domain and frequency-domain characteristic values is presented. Other similar fault diagnosis methods in various fields of the power system are listed and compared with the method presented there (Palácios et al., 2016; Siegel et al., 2018; Qu et al., 2020). In this context, Palácios et al. (2016) utilized time-domain characteristic signals for fault identification in the stator windings of asynchronous motors. They optimized the input samples for the artificial neural network (ANN) using Principal Component Analysis (PCA), reducing 30 input data points to 7. In contrast, Siegel et al. used a frequency-domain diagnostic model without optimizing the inputs, resulting in a model with 607 inputs and a 5-layer network structure. Although their model achieved high accuracy, the complex sample structure made it difficult to understand and apply. By comparison, the method presented in this paper diagnoses busbar faults by integrating both time-domain and frequency-domain features and uses DS theory to optimize the input samples. This approach reduces complexity and offers greater reliability for diagnosing fundamental busbar fault types in power systems.
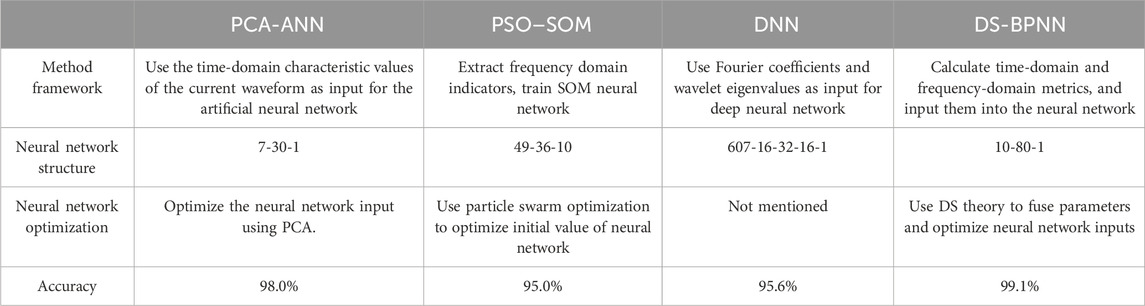
Table 4. Comparison of different fault diagnosis models based on time-domain and frequency-domain characteristic values.
This demonstrates that the multi-source data fusion busbar fault diagnostic model developed in this study is effective for diagnosing faults in diverse busbar environments. By leveraging data collected by sensors, the model can detect and identify faults, upload diagnostic results to the system, and assist maintenance personnel in troubleshooting and maintenance activities. This significantly contributes to the establishment of a comprehensive fault diagnosis platform for modern power systems.
5 Summary and prospect
To adapt to the digitalization of power systems, this paper establishes an intelligent diagnostic model for busbar faults based on the principles of traditional busbar differential protection. Initially, it analyzes the principles of traditional busbar differential protection and conducts specific analyses on faults in double busbar systems. Building upon this foundation, data from sensors on various branches and busbars in the double busbar system are collected to calculate the major differential current and minor differential current of the busbar. Time-domain and frequency-domain analyses are then conducted on the fault waveforms to obtain 16 time-domain and 13 frequency-domain characteristic values, effectively reflecting busbar fault features. To further improve training accuracy and speed, evidence fusion using DS evidence theory is performed on the time-domain and frequency-domain characteristic values, transforming 26 characteristic values into five combined characteristic values for neural network training. A BP neural network is selected for training, utilizing 35 fault samples obtained from busbar dynamic simulation. With error backpropagation, 80 hidden layers are established to establish the connection between busbar characteristic values and busbar faults. The accuracy of the model training reaches 99.0%. During the model validation process, when analyzing 40 sets of test fault data, the diagnostic accuracy is found to be 99.1%, indicating that the model can achieve precise diagnosis of busbar faults. Through this research, it supplements the diagnosis of busbar faults in intelligent diagnostic digital twin platforms for power systems, promoting the development of Informa ionization in smart grids.
Data availability statement
The original contributions presented in the study are included in the article/supplementary material, further inquiries can be directed to the corresponding author.
Author contributions
XJ: Conceptualization, Data curation, Formal Analysis, Funding acquisition, Investigation, Methodology, Software, Supervision, Writing–original draft, Writing–review and editing. HC: Conceptualization, Data curation, Formal Analysis, Investigation, Methodology, Software, Supervision, Writing–review and editing, Writing–original draft. CZ: Data curation, Investigation, Methodology, Software, Supervision, Writing–review and editing. XR: Formal Analysis, Funding acquisition, Project administration, Supervision, Validation, Writing–review and editing. JS: Formal Analysis, Funding acquisition, Methodology, Resources, Supervision, Validation, Visualization, Writing–review and editing. JY: Formal Analysis, Funding acquisition, Project administration, Resources, Supervision, Validation, Visualization, Writing–review and editing.
Funding
The author(s) declare that financial support was received for the research, authorship, and/or publication of this article. This work was supported by Science and Technology Project of State Grid Corporation of China (J2023145). The funder was not involved in the study design, collection, analysis, interpretation of data, the writing of this article, or the decision to submit it for publication.
Conflict of interest
Authors XJ, CZ, JS, and JY were employed by State Grid Suzhou Power Supply Company. Authors HC and XR were employed by State Grid Jiangsu Electric Power Company.
Publisher’s note
All claims expressed in this article are solely those of the authors and do not necessarily represent those of their affiliated organizations, or those of the publisher, the editors and the reviewers. Any product that may be evaluated in this article, or claim that may be made by its manufacturer, is not guaranteed or endorsed by the publisher.
References
Abo-Khalil, A. G. (2023). Digital twin real-time hybrid simulation platform for power system stability. Case Stud. Therm. Eng. 49, 103237. doi:10.1016/j.csite.2023.103237
Ahmed, I., Ahmad, M., Chehri, A., and Jeon, G. (2023a). A smart-anomaly-detection system for industrial machines based on feature autoencoder and deep learning. Micromachines 14 (1), 154. doi:10.3390/mi14010154
Ahmed, N., Hashmani, A. A., Khokhar, S., Tunio, M. A., and Faheem, M. (2023b). Fault detection through discrete wavelet transform in overhead power transmission lines. Energy Sci. Eng. 11 (11), 4181–4197. doi:10.1002/ese3.1573
Dang, H. L., Kim, J. C., Kwak, S., and Choi, S. (2023). Analysis and diagnosis scheme of parallel arc failure in DC power lines. J. Electr. Eng. Technol. 18 (3), 1851–1862. doi:10.1007/s42835-022-01273-2
Fan, B., and Xing, X. (2021). Intelligent prediction method of building energy consumption based on deep learning. Sci. Program 2021, 1–9. doi:10.1155/2021/3323316
Feng, C., and Zhao, Y. (2022). Fault identification and analysis of communication network based on deep learning. Mob. Inf. Syst. 2022, 1–12. doi:10.1155/2022/1456425
Feser, K., Braun, U., Engler, F., and Maier, A. (1991). Application of neural networks in numerical busbar protection systems (NBPS). IEEE, 117–121. doi:10.1109/ANN.1991.213508
Flores, B. H., and Song, H. (2019). Determining countermeasures against fault currents using a decomposition method based on fuzzy fault level constrained optimal power flow. Appl. Sci. 9 (2), 274. doi:10.3390/app9020274
Fu, B., Fang, J., Zhao, X., Chen, X., Xu, K., and He, Z. (2021). A belief Coulomb force in DS evidence theory. IEEE Access 9, 82979–82988. doi:10.1109/ACCESS.2021.3086232
Gafoor, S. A., and Rao, P. V. R. (2011). A transient current based busbar protection scheme using Wavelet Transforms. Int. J. Electr. Power Energy Syst. 33 (4), 1049–1053. doi:10.1016/j.ijepes.2011.01.022
Guo, L., Gu, X., Yu, Y., Duan, A., and Gao, H. (2023). An analysis method for interpretability of convolutional neural network in bearing fault diagnosis. IEEE Trans. Instrum. Meas. 73, 1–12. doi:10.1109/TIM.2023.3334350
Hughes, R., and Legrand, E. (2001). Numerical busbar protection benefits of numerical technology in electrical substation. IET, 463–466. doi:10.1109/TIM.2023.3334350
Jankovski, M., Popov, M., Godefrooi, J., Parabirsing, E., Wierenga, E., and Lekić, A. (2023). Novel busbar protection scheme for impedance-earthed distribution networks. Electr. Power Syst. Res. 223, 109569. doi:10.1016/j.epsr.2023.109569
Jimenez-Aparicio, M., Wilches-Bernal, F., and Reno, M. J. (2023). Local, single-ended, traveling-wave fault location on distribution systems using frequency and time-domain data. IEEE Access 11, 74201–74215. doi:10.1109/ACCESS.2023.3296737
Kezunovic, M. (2011). Smart fault location for smart grids. IEEE Trans. Smart Grid 2 (1), 11–22. doi:10.1109/TSG.2011.2118774
Li, J., Yao, X., Wang, X., Yu, Q., and Zhang, Y. (2020). Multiscale local features learning based on BP neural network for rolling bearing intelligent fault diagnosis. Measurement 153, 107419. doi:10.1016/j.measurement.2019.107419
Moldovan, A.-M., and Buzdugan, M. I. (2023). Prediction of faults location and type in electrical cables using artificial neural network. Sustainability 15 (7), 6162. doi:10.3390/su15076162
Palácios, R. H. C., Goedtel, A., Godoy, W. F., and José, A. F. (2016). Fault identification in the stator winding of induction motors using PCA with artificial neural networks. J. control, Autom. Commun. Syst. 27, 406–418. doi:10.1007/s40313-016-0248-0
Palensky, P., and Kupzog, F. (2013). Smart grids. Annu. Rev. Environ. Resour. 38, 201–226. doi:10.1146/annurev-environ-031312-102947
Pei, D., and Liu, Y. (2024). Power line fault diagnosis based on convolutional neural networks. Heliyon 8 (10), E29021. doi:10.1016/j.heliyon.2024.e29021
Peng, Y., and Zhang, Q. (2021). Feature selection for interval-valued data based on DS evidence theory. IEEE Access 9, 122754–122765. doi:10.1109/ACCESS.2021.3109013
Qu, N., Chen, J., Zuo, J., and Jinhai, L. (2020). PSO–SOM neural network algorithm for series arc fault detection. Adv. Math. Phys. 2020 (1), 1–8. doi:10.1155/2020/6721909
Siegel, J. E., Pratt, S., Sun, Y., and Sanjay, E. S. (2018). Real-time deep neural networks for internet-enabled arc-fault detection. Eng. Appl. Artif. Intell. 74, 35–42. doi:10.1016/j.engappai.2018.05.009
Sifat, M. M. H., Das, S. K., and Choudhury, S. M. (2024). Design, development, and optimization of a conceptual framework of digital twin electric grid using systems engineering approach. Electr. Power Syst. Res. 226, 109958. doi:10.1016/j.epsr.2023.109958
Song, M.-H., Kang, S.-H., Lee, N.-H., and Nam, S.-R. (2020). IEC 61850-based centralized busbar differential protection with data desynchronization compensation. Energies 13 (4), 967. doi:10.3390/en13040967
Tian, A., Zhang, Y., Ma, C., Chen, H., Sheng, W., and Zhou, S. (2023). Noise-robust machinery fault diagnosis based on self-attention mechanism in wavelet domain. Measurement 207, 112327. doi:10.1016/j.measurement.2022.112327
Vásquez, F. a. M., Ribeiro, E. P., Silva, K. M., and Lopes, F. V. (2021). A new time domain-based busbar protection algorithm. Electr. Power Syst. Res. 196, 107282. doi:10.1016/j.epsr.2021.107282
Wagner, T., Kittl, C., Jakob, J., Hiry, J., and Häger, U. (2024). Digital twins in power systems: a proposal for a definition. IEEE Power Energy Mag. 22 (1), 16–23. doi:10.1109/MPE.2023.3328581
Wang, Q., Zhang, K., and Lin, S. (2023). Fault diagnosis method of disconnector based on CNN and DS evidence theory. IEEE Trans. Ind. Appl. 59 (5), 5691–5704. doi:10.1109/tia.2023.3284780
Wang, Y. N., and Wang, S. C. (2023). Feature selection for set-valued data based on D-S evidence theory. Artif. Intell. Rev. 56 (3), 2667–2696. doi:10.1007/s10462-022-10241-1
Wang, Z., Chen, Q., Wang, Z., and Xiong, J. (2022). The investigation into the failure criteria of concrete based on the BP neural network. Eng. Fract. Mech. 275, 108835. doi:10.1016/j.engfracmech.2022.108835
Xu, W.-Z., Li, C. B., Choung, J., and Lee, J.-M. (2017). Corroded pipeline failure analysis using artificial neural network scheme. Adv. Eng. Softw. 112, 255–266. doi:10.1016/j.advengsoft.2017.05.006
Xu, X., Cao, D., Zhou, Y., and Gao, J. (2020). Application of neural network algorithm in fault diagnosis of mechanical intelligence. Mech. Syst. Sig. Process. 141, 106625. doi:10.1016/j.ymssp.2020.106625
Zhang, L., Wang, F., Sun, T., and Xu, B. (2018). A constrained optimization method based on BP neural network. Neural. comput. Appl. 29, 413–421. doi:10.1007/s00521-016-2455-9
Zhang, Q., Huo, R., Zheng, H., Huang, T., and Zhao, J. (2023). a fault diagnosis method with bitask-based time and frequency domain feature learning. IEEE Trans. Instrum. Meas. 72, 3527211–11. doi:10.1109/TIM.2023.3305652
Zhang, S., Wang, R., Si, Y., and Wang, L. (2021). An improved convolutional neural network for three-phase inverter fault diagnosis. IEEE Trans. Instrum. Meas. 71, 1–15. doi:10.1109/TIM.2021.3129198
Zhu, Y., Zhou, Y., Wei, W., and Wang, N. (2022). Cascading failure analysis based on a physics-informed graph neural network. IEEE Trans. Power Syst. 38 (4), 1–10. doi:10.1109/TPWRS.2022.3205043
Keywords: information fusion, busbar fault, time-domain analysis, frequency-domain analysis, neural network
Citation: Jiang X, Cao H, Zhou C, Ren X, Shen J and Yu J (2024) Busbar fault diagnosis method based on multi-source information fusion. Front. Energy Res. 12:1443570. doi: 10.3389/fenrg.2024.1443570
Received: 04 June 2024; Accepted: 31 July 2024;
Published: 04 September 2024.
Edited by:
Feng Liu, Nanjing Tech University, ChinaReviewed by:
Yixing Ding, Nanjing Tech University, ChinaWangyan Li, University of Shanghai for Science and Technology, China
Copyright © 2024 Jiang, Cao, Zhou, Ren, Shen and Yu. This is an open-access article distributed under the terms of the Creative Commons Attribution License (CC BY). The use, distribution or reproduction in other forums is permitted, provided the original author(s) and the copyright owner(s) are credited and that the original publication in this journal is cited, in accordance with accepted academic practice. No use, distribution or reproduction is permitted which does not comply with these terms.
*Correspondence: Xuebao Jiang, eHVlYmFvamlhbmdAMTI2LmNvbQ==