 X. A. Wang
 Ximei Liang1
 Dalin Zhang
- 1China Nuclear Power Technology Research Institute, Shenzhen, China
- 2State Key Laboratory of Multiphase Flow in Power Engineering, Shanxi Key Laboratory of Advanced Nuclear Energy and Technology, School of Nuclear Science and Technology, Xi’an Jiaotong University, Xi’an, China
A thorough understanding of the reactor core thermal hydraulic behavior is essential for the design and safety analysis of Sodium-cooled Fast Reactors (SFR). Due to the application of hexagonal subassembly, the core thermal hydraulic behavior is significantly affected by the flow field within the subassemblies, the inter-wrapper region and the hot pool. Analysis of the core thermal hydraulic behavior requires a model coupling the three regions mentioned above, which has been identified as one of the thermal hydraulic challenges in SFR. In the present study, a 3D model that covers the three regions was developed for the core of the China Experimental Fast Reactor (CEFR) with the Computational Fluid Dynamic (CFD) code, Fluent. The inter-wrapper region and the hot pool were modeled in detail, while the subassemblies were modeled with a special porous medium model. The core thermal hydraulics behavior under steady state was studied, more specifically, information for the flow field distribution at the core outlet, the inter-wrapper flow and the duct wall temperature distribution was obtained. Under steady state, liquid sodium in the inter-wrapper region is supplied by the inner region of the hot pool. And it enters the inter-wrapper region from the core outer region and returns back to the hot pool inner region from the core central region. The inter-wrapper flow is cooled by non-fuel subassemblies and heated up by fuel subassemblies. For non-fuel subassembly, the ratio of the total heat transfer rate between the inter-wrapper flow and the subassemblies to the heat generated within subassemblies could reaches 96%; for fuel subassemblies, the maximum ratio of the total heat transfer rate between the inter-wrapper flow and the subassemblies to the heat generated within subassemblies is 2.45%. Significant temperature gradients have been observed on the duct wall, with maximum values of 156.69 K/m in the vertical direction and 2,196.00 K/m in the circumferential direction. The largest temperature gradient appears on the duct of subassemblies adjacent to the transition region of fuel subassemblies and non-fuel subassemblies.
1 Introduction
In 2002, six types of reactors were selected by the Generation IV International Forum (GIF) as reference reactors, and Sodium-cooled Fast Reactor (SFR) is in the list for its high efficiency of nuclear fuel proliferation, nuclear waste transformation and high inherent safety (Zhang et al., 2018). As the most promising reactor for commercial application in the fourth generation reactors, the thermal-hydraulic phenomenon within its primary system has attracted much attention, especially for the pool-type SFR (Xu and Yang, 2016). Several special thermal-hydraulic problems have been identified that may impact SFR performance under both steady-state and the transient-state conditions, including the thermal stratification within the pool, gas entrainment at the free surface, high cycle thermal fatigue on supporting structures and the inter-wrapper flow in the decay heat removal process. These thermal-hydraulic phenomena have been well addressed in the review work done by Velusamy et al. (2010) and Tenchine (2010), Tenchine et al. (2012a), Tenchine et al. (2012b). Among all the thermal-hydraulic phenomena associated with SFR, the global core thermal hydraulic is particularly important but appears to be less studied, to the best of our knowledge. This phenomenon is highly complex, involving numerous subassemblies and being significantly affected by inter-wrapper flow and hot pool dynamics.
Besides the in-subassembly flow study, existing core thermal hydraulic experiments mainly focus on the influence of the inter-wrapper flow. And many experiments were performed with other fluids, such as water and air due to the opacity and the chemical activity of liquid sodium. In the early 1990s, several test facilities were built to study the decay heat removal capability for the European fast reactor (Hoffmann et al., 1991). And results demonstrated that the inter-wrapper flow plays an important role in decay heat removal process. To assess the performance of Decay Heat Removal (DHR) system in the Prototype Fast Breeder Reactor (PFBR), Mente set up a 1/4th scaled full sector model SAMRAT with water as the working fluid (Mente et al., 2014). Due to the smaller size in the scaled model, hexagonal shape subassemblies in the PFBR were represented by circular sleeves fixed in the bottom of the model. Comparison of different heat transport paths revealed that heat removal by the inter-wrapper flow is equally effective as primary heat transport path. Tokuhiro measured the inter-wrapper flow velocity distribution on the TRIF test facility with Particle Image Velocimetry (PIV) technique (Kimura et al., 2000). It was found that the flow velocity around the fuel subassemblies is larger than that around the reflection subassemblies. In order to investigate the heat transfer within the inter-wrapper region, a test facility was set up at the Karlsruhe Liquid Metal Laboratory (KALLA) (Pacio et al., 2019). Temperature distribution within the inter-wrapper region and the total pressure drop were measured under four typical scenarios. Test results showed that the assumption of adiabatic boundary conditions for fuel subassemblies will lead an over-predictions of the duct wall temperature under asymmetric conditions where adjacent fuel subassemblies are in different power levels. Besides the water experiments, liquid sodium experiments were also performed. In 1998, Kamide performed a steady-state sodium experiments using a three-subassembly to study the heat transfer between subassemblies wherein inter-subassembly heat transfer occurred (Kamide et al., 1998). Results showed that the transverse temperature distribution is flattened by the inter-wrapper flow.
In addition to the experimental studies, numerical study has also been performed. According to Ducros (2008), these studies could be classified into two levels according to the purpose of the calculation and the accuracy required. The first level is the 1D core modeling with system codes that model the core with several parallel 1D sub-channels to account for subassemblies with different mass flow rates and power levels. Such analysis is designed to study the performance of the whole plant under various condition. A common practice is to model the inter-wrapper flow by conduction only or through a by-pass sub-channel model. And these approaches are implemented in system codes such as SAS4A/SASSY-1, NETFLOW, and CATHARE. Considering the facts that the inter-wrapper flow is almost axisymmetric, Yue developed a two dimensional model for the inter-wrapper flow with system code THACS (Yue et al., 2018), which greatly reduces the computational cost. The second level is the 3D global core modelling with sub-channels description of each subassembly and a 3D model of the inter-wrapper space. The first attempt might have been done by Kamide, who modeled the PLANDTL-DHX test facility with 3D code AQUA in 2001 (Kamide et al., 2001). The hexagon subassemblies were modeled with square blocks and the inter-wrapper gaps was modeled as regular channels between square blocks. The simulation results showed that the cooling effect of the inter-wrapper flow is more evident in the outer subassemblies and weaker in the center subassembly. With the in-house CFD code TRIO_U, researchers in the CEA developed a sub-channel model for the subassemblies and modeled the core of Phenix by coupling the sub-channel modeled subassemblies and the CFD modeled inter-wrapper region and hot pool (Conti et al., 2015). At the same time, the research team in IGCAR also made an attempt to perform a full core simulation for the PFBR and the Phenix with CFD method (Parthasarathy et al., 2012).
While the research for the global core thermal hydraulic is ongoing, limited data from actual SFR reactors has been published. To enhance understanding of thermal hydraulics within the SFR core, a detailed 3D model of the China Experimental Fast Reactor (CEFR) was developed using the CFD code Fluent. This model includes subassemblies, the inter-wrapper region, and the hot pool. The study provided valuable insights into the flow field at the core outlet, inter-wrapper flow, and temperature distribution on the subassembly duct. The methodology and data presented in this work may be beneficial for the design and analysis of pool-type sodium-cooled fast reactors.
2 Description of CEFR
CEFR is a pool type sodium cooled fast reactor with 65 MW thermal power and 25 MW electrical power (Xu and Yang, 2016). It is the first sodium-cooled fast reactor that uses DHR system for decay heat removal under protected and unprotected accidents (Xu, 2003). Figure 1 shows the diagram of internal structure and primary coolant flow in CEFR. The reactor vessel is arranged with the reactor core, the core diagrid, the steel shielding, the central measuring column, the small rotating plug, the Graphite Shielding Rods (GSR), two main pumps, four Intermediate Heat Exchangers (IHXs), and two Decay Heat Exchangers (DHX) and so on. The pool is divided into four regions by the vertical supporting board outside the GSR and the horizontal board in the middle of the pool, namely the reactor region, the Hot Pool Inner Region (HPIR), the Hot Pool Outer Region (HPOR) and the cold pool region. There are 12 rectangular windows on the vertical supporting board in front of each IHX, arranging in 3 × 4. Hot liquid sodium can only flow through these windows from the hot pool inner region into the hot pool outer region (Yu, 2013).
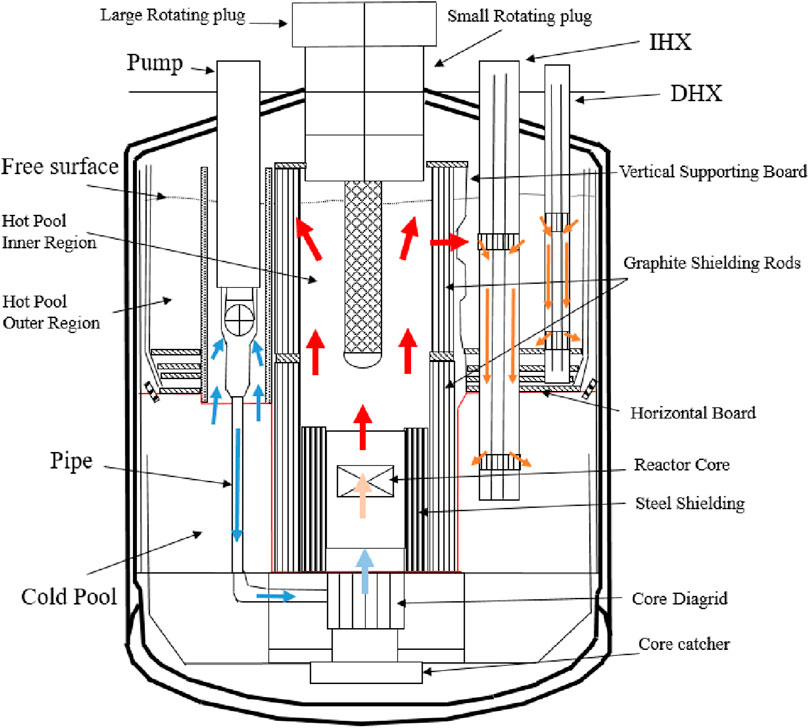
Figure 1. Diagram of the internal structure of CEFR.
Figure 2 shows the layout of subassembly arrangement in the reactor core and the flow channel numbers. The reactor core of CEFR consists of 712 subassemblies, including fuel subassembly and non-fuel subassemblies. Non-fuel subassemblies is a collection of neutron source subassembly, compensation subassembly, regulation subassembly, steel shielding subassembly boron shielding subassembly and spend fuel subassembly. Compared to non-fuel subassemblies, fuel subassemblies hold obvious higher power levels and mass flow rate. All subassemblies are surrounded by hexagon ducts with a flat to flat distance of 59 mm. The thickness for the duct is 2 mm. The fuel subassembly consists of 61 fuel rods with a diameter of 6 mm and a pitch of 7 mm. Each fuel rod is wrapped by a metal wire with a diameter of 0.95 mm. The lead pitch length of the wire is 100 mm.
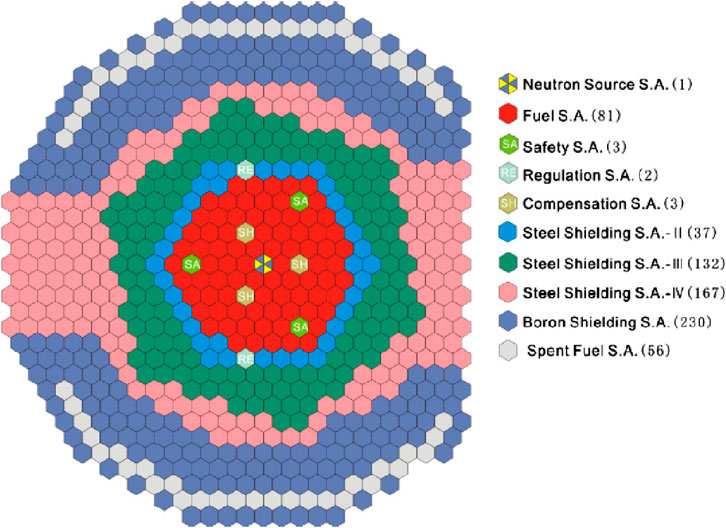
Figure 2. Subassembly layout in the reactor core of CEFR (IAEA, 2006).
Under steady state condition, cold liquid sodium is pumped from the cold pool into the core diagrid through pipes, and then is distributed into subassemblies in the core. Fuel subassemblies in the center of the core will obtain designed mass flow rates from the core diagrid. Non-fuel subassemblies get mass flow rates from leakage at the bottom of fuel subassemblies. Liquid sodium within subassemblies will flow upward and be heated up by the nuclear fission reaction within the fuel rods. Then hot liquid sodium exits the core from the head of subassemblies and enters the HPIR. Hot liquid sodium will flow along the radial direction, across the graphite shielding rods, and enter the HPOR through the windows on the vertical support board. Most of the liquid sodium will enter the IHX and flow down along the shell side of IHX, and finally reach the cold pool. Small amount of the liquid sodium in the hot out pool will enter the DHX, and be cooled by its secondary flow and flow downward to the bottom of the HPOR.
3 The numerical model
3.1 The simplified 90-degree model
Since the core thermal hydraulics are significantly influenced by the flow field above the core and around the core, a proper model should include the hot pool and the shielding. Despite the advancements in computational power in recent years, detailed modeling of the entire core remains computationally expensive. Therefore, simplifications are necessary to create a feasible computational model. The following assumption were made during the simplification process:
1, Flow fields within the core and the pool are almost symmetrical, 90-degree model is appropriate for simulation.
2, Liquid sodium will enter the non-fuel subassemblies as soon as possible after the leakage at the bottom of fuel subassemblies and its influence on the whole inter flow could be omitted. Figure 3 shows the flow field at the core inlet region. This assumption ignores the flows circled in black dashed lines.
3, The vertical thermal conduction within the subassembly ducts could be omitted, and the radial thermal conduction could be treated with thin shell model.
4, Flow velocity distribution within the IHX, DHX and the steel shielding will not cause much influence for other regions, therefore could be modeled with porous medium model.
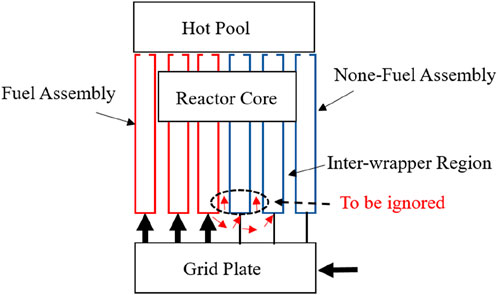
Figure 3. Flow field at the core inlet.
With the assumption made above, a simplified 90-degree model is finally obtained, which contains subassemblies, the inter-wrapper region, the steel shielding region, the HPIR, and the HPOR. Surface of the GSR is preserved but the rod body has been removed. Figure 4 shows the simplified computational model. The inlet for the model lies at the bottom of subassemblies and the outlet lies at the bottom of IHX. Except for the two cross-sections at 0° and 90°, which use symmetric boundary conditions, all other external surfaces of the model are treated as adiabatic no-slip walls.
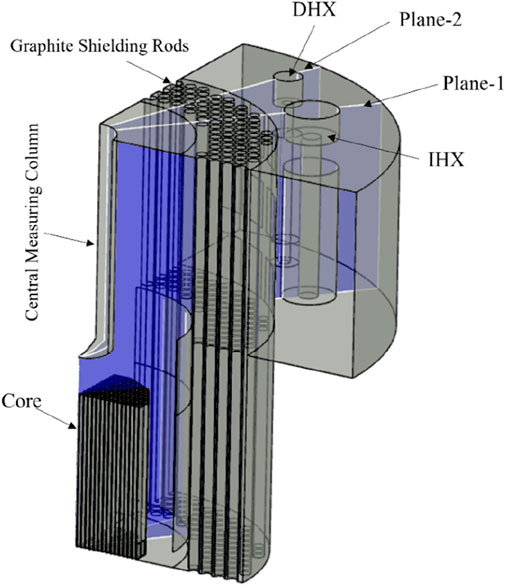
Figure 4. Simplified 90-degree sector model.
Figure 5 shows the subassembly layout in the core. Minor modifications have been made for the arrangement of subassemblies. The safety subassembly, the compensation subassembly and the regulation subassembly are moved to the vicinity of the symmetry plane present model, and each type preserves one subassembly. And some boron shielding subassembly and steel shielding-IV subassemblies are added into the core. According to the value of mass flow rate at the inlet, fuel subassemblies could be further divided into four sub-groups (Xue et al., 2008). The mass flow rate and subassemblies numbers are shown in Table 1.
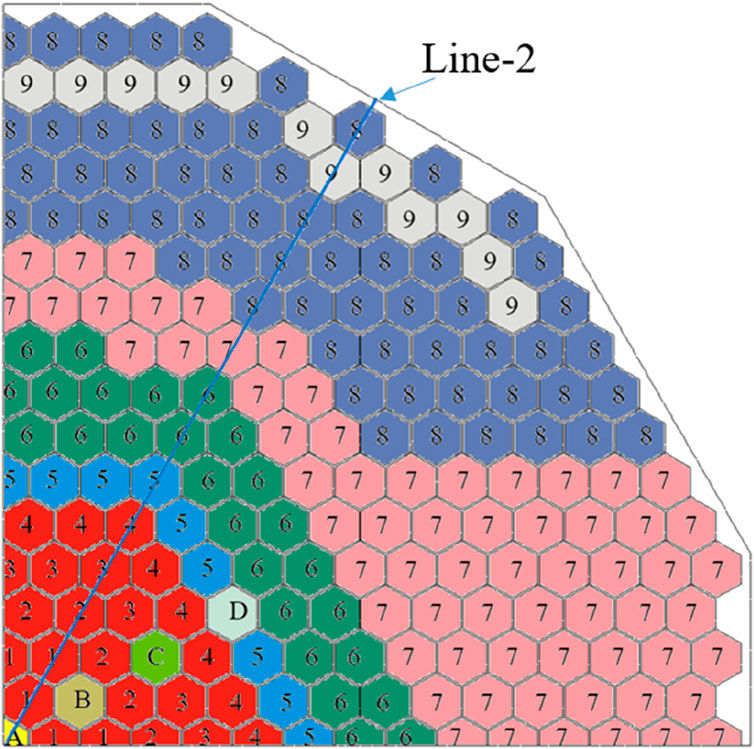
Figure 5. Subassemblies layout in the core.
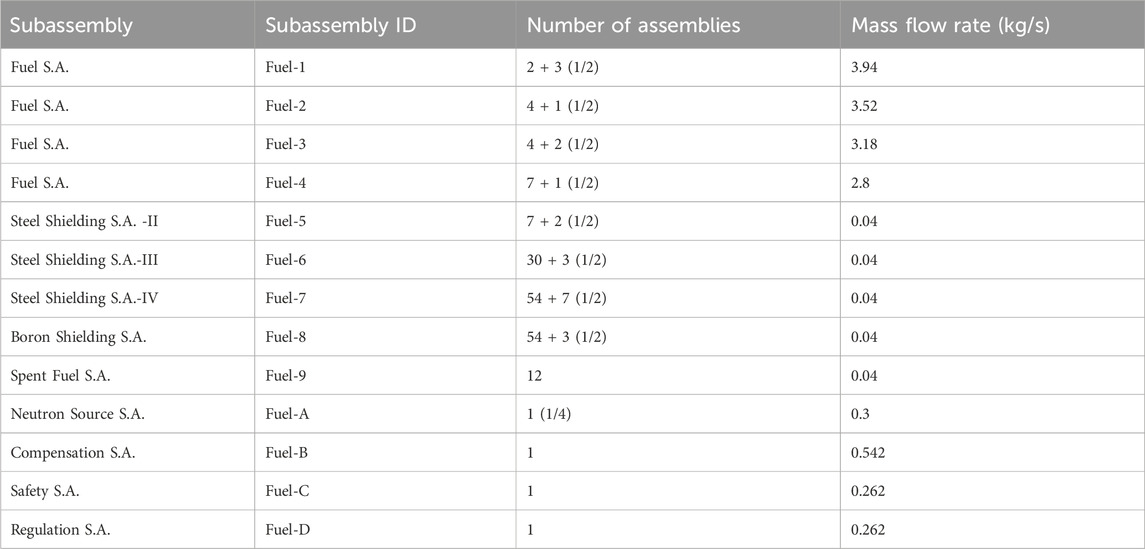
Table 1. Parameters for fuel subassemblies.
3.2 The meshing model
A hybrid mesh model was generated for the simplified geometry model with the commercial mesh generator, ANSYS meshing. Hexahedron mesh was generated for most part of the model except for the hot pool inner region, where both tetrahedron and prism meshes were generated. Although the software is highly automated, a significant amount of work is still required to obtain an appropriate mesh model. According to previous study (Wang et al., 2020), non-uniform porous medium model is used for subassemblies with hexagonal shapes. More specifically, parameters for porous medium model were different between the central region and the peripheral region within a subassembly. Accordingly, all the subassemblies were divided into two regions in radial direction by lines joining the centers of the peripheral rods, as done in the Energy model (Khan E. et al., 1975), as shown in Figure 6A. For the inter-wrapper region, two layer cells was placed, as done by the IGCAR (Parthasarathy et al., 2012), as shown in Figure 6B. The mesh model used for final calculation contains 7.07 Million cells and 8 Million nodes.
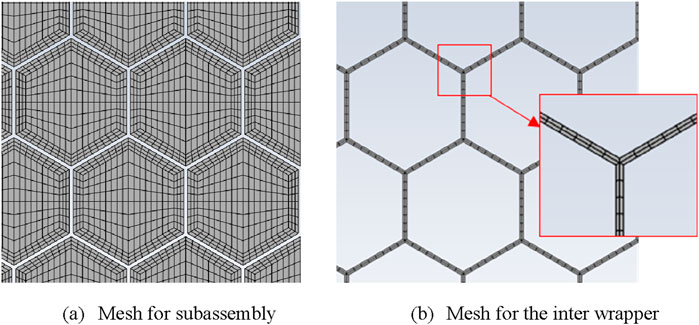
Figure 6. Mesh model for the subassembly and the inter-wrapper. (A) Mesh for subassembly. (B) Mesh for the inter wrapper.
3.3 Governing equations
The RANS model was adopt for the turbulent flow within the pool and the inter-wrapper region, more specifically, the realizable k-
According to Khan, the flow fields within subassembly could be divided into two parts in radial direction (Khan and Todreas, 1973). The interior region contain most of the fuel rods and the central sub-channels, while the peripheral region contains a few fuel rods, the edge sub-channels and the corner sub-channels. In both regions, momentum and energy are mixed through the turbulent flow exchange and sweeping flow across the gaps between fuel rods. By including an additional source term in the momentum transportation, pressure drop for the wire wrapped assembly could be modeled using Equations 1, 2:
Where
Where
Due to the existence of spacer wire, turbulence mixing and horizontal flow are quite strong within the subassembly. No turbulent heat transfer model has been proposed for porous medium filled with wire wrapped rods yet. Instead of using the Reynolds analogy as do in common CFD simulation, correlation from the ENERGY model was adopted to obtain the effective heat transfer coefficient (Khan E. U. et al., 1975). The conservation equation for energy is written in Equation 4:
Where
Due to the large temperature difference and density variation of the coolant during the core thermal hydraulic simulation, the influences of buoyancy force cannot be ignored. In order to accurately simulate this phenomenon, The temperature dependent thermos-physical properties for liquid sodium were adopted in present work (Fink and Leibowitz, 1995). Also, the influence of gravity is taken into account. The SIMPLE numerical algorithm was adopted to solve the pressure velocity coupling problem. Second Order Upwind scheme is adopt for their special discretization for convection terms in these governing equations, and the PRESTO! was adopted as pressure interpolation schemes. The convergence residuals for the continuity equation and momentum equations are set to 10–5, while the residuals for the energy equation are set to 10–8. Additionally, the outlet temperature of Fuel-1 is monitored, and its convergence criterion is 0.01 K.
4 Validation of the numerical model
To validate the numerical model, simulation was performed for the natural circulation experiment of the sodium-cooled fast reactor conducted by Rui Luo at Tsinghua University (Guo, 2020; Wang, 2022). The experiment used a multi-box, elongated test section, as shown in Figures 7A, B, to approximate the reactor core. The experimental section is divided into three zones along the transverse direction. Zone 1 utilizes 37-rod and 19-rod subassemblies to represent fuel subassemblies. Zone 2 employs 7-rod subassemblies for either fuel or shielding components. Zone 3 uses empty boxes to simulate other non-fuel subassemblies. Electric heating rods are used to simulate the nuclear fuel rods, with a truncated cosine thermal power distribution along the axial direction, where the ratio of maximum power to minimum power is 1.6. More experimental details could be found in theses of Guo (2020) and Wang (2022).
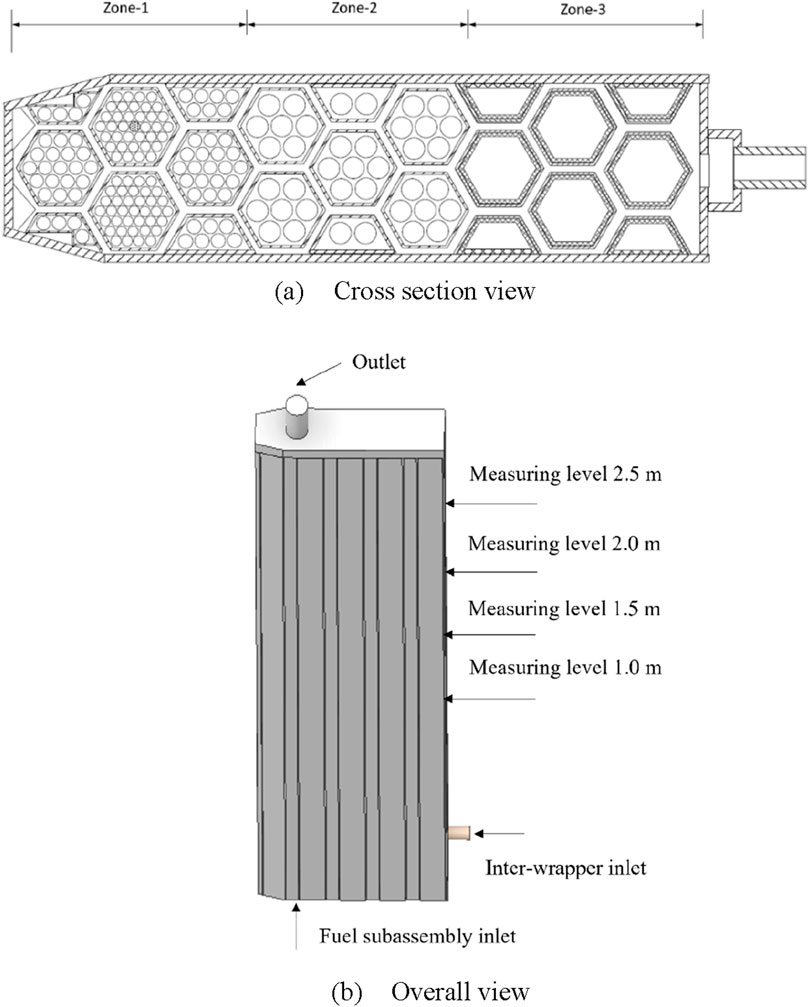
Figure 7. Structure of the experimental section. (A) Cross section view. (B) Overall view.
The numerical methods outlined in Chapter 3 were applied to the experimental conditions described by Guo (2020). During the experiment, sodium was injected and heated in Zone 1, while the other zones were neither injected with sodium nor heated. Additionally, liquid sodium was injected from the side branch of the experimental section into the inter-wrapper region. Ultimately, all the sodium flowed out through the upper vertical pipe of the experimental section. Temperature distributions were measured at four cross-sections with heights of 1.0 m, 1.5 m, 2.0 m, and 2.5 m, as shown in Figure 7B. Figure 8 showed the mesh model. To obtain a mesh independent result, three different mesh models were generated with different mesh layers (2, 4, 6) in the inter-wrapper region. Figure 9 showed the comparison of simulation results and the experimental results. In the legend, the first number in “CFD_2_2.5” represents the number of grid layers in the inter-wrapper region, while the second number indicates the measurement section location. It can be seen from the figure that the results obtained from different mesh models are similar, and the numerical simulation results are generally in good agreement with the experimental measurements. The main discrepancy between the numerical simulation results and the experimental results is observed in Zone 1(Radial-Coordinate <0.2 m), where the experimental results shows some fluctuations. This may be due to the sweep flow within the subassembly caused by the wire spacers.
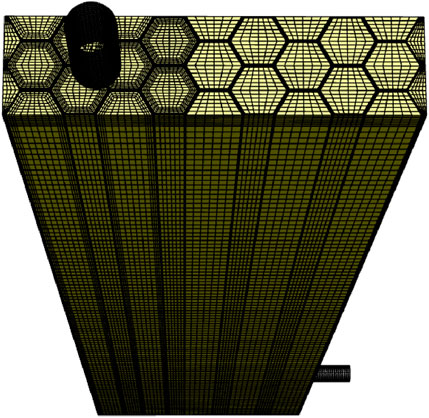
Figure 8. Mesh model for the experiment.

Figure 9. Comparison between the numerical results and the experimental results.
5 Result and discussion
In the following chapters, the flow fields within the hot pool and the core region are described, separately. The hot pool encompasses the HPIR, HPOR, and GSR, while the core region includes both the subassembly flow and the inter-wrapper flow.
5.1 Flow field within the hot pool
To show the velocity and temperature distribution, two vertical view planes were created, and each one crossed a heat exchanger (IHX/DHX). They were named plane-1 and plane-2 respectively, as shown in Figure 4.
Figures 10A, B show the flow velocity and temperature distribution on plane-1. The magnitude of the velocity is shown in color scale, with corresponding velocity vectors indicating flow direction. The maximum velocity, estimated at 1.73 m/s, occurs at the outlet of the subassemblies Fuel-1. Upon exiting the fuel subassemblies in the core center, flows rapidly towards the central measuring column, where it is deflected toward the GSR. Once reaching the GSR, the majority of the liquid sodium ascends along its surface to the pool surface. A counterclockwise vortex forms between the central measuring column and the GSR in the upper region of the HPIR. The flow direction of the vortex is different to existing simulation result reported by Xu (2003). The difference of flow pattern may be caused by the difference of the structure treatment at the core-outlet region. More detailed structures are considered in present work, including the non-fuel subassemblies, the steel shielding and the GSR. As shown in Figure 10A, a complex vortex flow forms at the outlet of non-fuel subassemblies, occupying a significant portion of the core outlet region. Consequently, liquid sodium from fuel subassemblies is confined to a narrow region with high velocity. This high velocity enables the liquid sodium to overcome buoyancy forces and enter the GSR after being deflected at the bottom of the central measuring column.
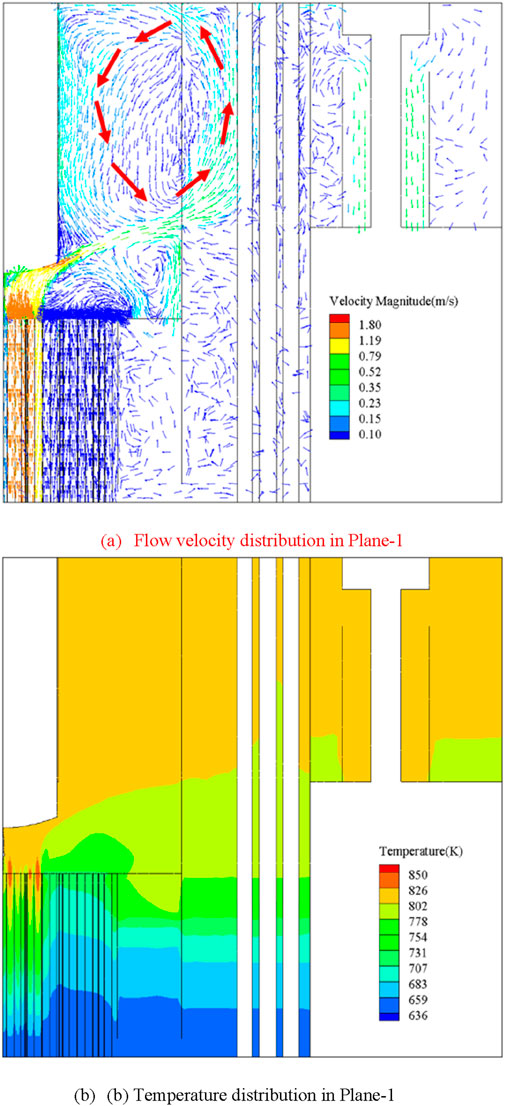
Figure 10. Flow field within the hot pool. (A) Flow velocity distribution in Plane-1. (B) Temperature distribution in Plane-1.
Figure 10B shows the temperature distributions on plane-1. The maximum temperature is 847 K, observed at the outlet of the subassemblies Fuel-1. The temperature remains nearly uniform in the upper part of the hot pool, with an average of 803 K, which is consistent with the value reported by Xu (2003). Due to the presence of a vortex in the core outlet region, significant thermal stratification occurs at the bottom of the hot pool. A weak thermal stratification is found at the bottom of the HPOR, resulting from the outflow from the DHX, where sodium is cooled by the secondary flow. The maximum temperature gradient on the reactor vessel wall is estimated to be 130 K/m, near the bottom of the hot pool out region. The introduction of the DHX introduces additional thermal stress to the reactor vessel.
5.2 Flow field within the core
5.2.1 Flow field at the core outlet
To analysis the flow field distribution at the core outlet, line-2 was created at the core outlet surface, as depicted in Figure 5. Figure 11A displays the pressure distribution at the core outlet along line-2. In the legend, “Fuel” stands for the flow within subassemblies, and “IWF” stands for the flow in the inter-wrapper region. The vertical dash lines stand for the duct walls of the subassemblies. The maximum pressure at the core outlet is 9,531 Pa, observed in Fuel-1, while the minimum pressure is 8,636 Pa, appearing in the inter-wrapper gap near Fuel-1. Contrary to the assumption of uniform pressure at the core outlet typically used in sub-channel analysis, the pressure distribution is actually non-uniform. Specifically, the pressure at the outlet of Fuel subassemblies is higher than that at the outlet of non-Fuel subassemblies, while the pressure at the outlet of the inter-wrapper flow near Fuel subassemblies is lower than that near non-Fuel subassemblies. When comparing the pressures and velocities at the outlets of different subassemblies, it appears that a higher velocity in a subassembly is associated with a higher pressure at its outlet. The pressure at the outlet of the inter-wrapper flow is consistently lower than that at the outlet of the adjacent subassemblies. Within each subassembly, the pressure distribution is almost uniform. It is because the flow within the subassembly is fully developed near the outlet of the subassembly.
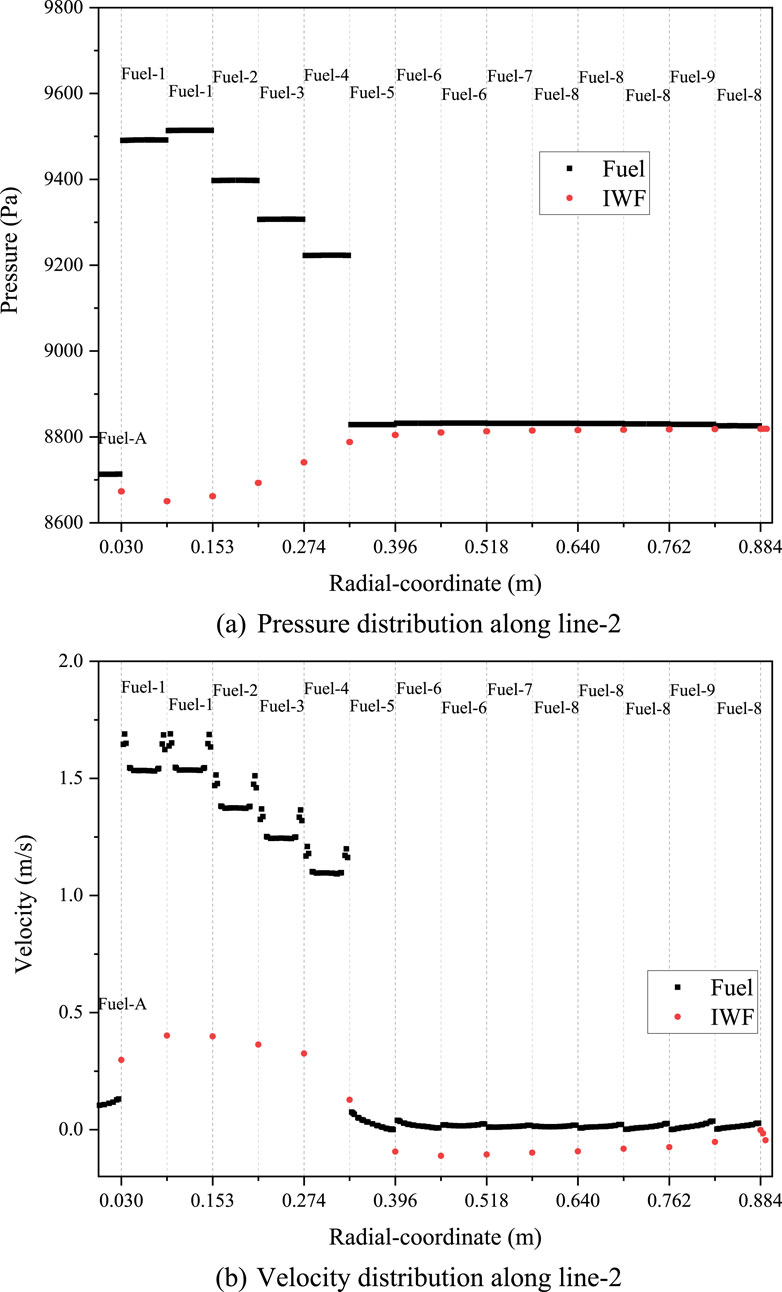
Figure 11. Pressure and velocity distributions at the core outlet. (A) Pressure distribution along line-2. (B) Velocity distribution along line-2.
Figure 11B shows the velocity distribution at the core outlet along line-2. For the flow within subassemblies, the maximum velocity within each subassembly is observed near the duct wall. Although a uniform velocity distribution is assumed for the inlet of each subassembly, liquid sodium tends to flow along the duct wall due to the larger hydraulic resistance in the interior region of caused by the denser arrangement of fuel rods. The maximum velocity in Fuel-1 is 1.73 m/s, which is 12% higher than that in the interior region. Compared to fuel subassemblies, the radial velocity distribution within non-fuel subassemblies is more uniform. For the inter-wrapper flow, the velocity is positive within the gap of fuel subassemblies and negative within the gap of non-fuel subassemblies. In other words, liquid sodium within the inter-wrapper region flows upward within the gap of fuel subassemblies and downwards within the gap of non-fuel subassemblies. The maximum positive velocity within the inter-wrapper flow is 0.58 m/s, occurring near Fuel-1, while the minimum negative velocity is 0.23 m/s, occurring near Fuel-6. Taking the inter-wrapper width (2 mm) as the characteristic length, the corresponding Reynolds number for the aforementioned velocity are 3,717 and 1,474, which means the inter-wrapper flow is dominated by laminar and transitional flow. The reason for the appearance of the minimum value for negative velocity near Fuel-6 may be the vortex flow near the core outlet, as shown in Figure 10.
Figures 12A, B show the temperature distribution at the core outlet along line-2 and the temperature distribution contour at the core outlet. The maximum temperature is 848 K, observed in Fuel-1, while the minimum temperature is 706 K, observed in Fuel-6. Within each fuel subassembly, the temperature follows a sinusoidal pattern, with the peak temperature at the center significantly higher than near the duct wall. In contrast, the temperature distribution within non-fuel subassemblies is nearly uniform in the radial direction, except for Fuel-5. The overall temperature distribution is skewed, decreasing sharply in the radial direction.
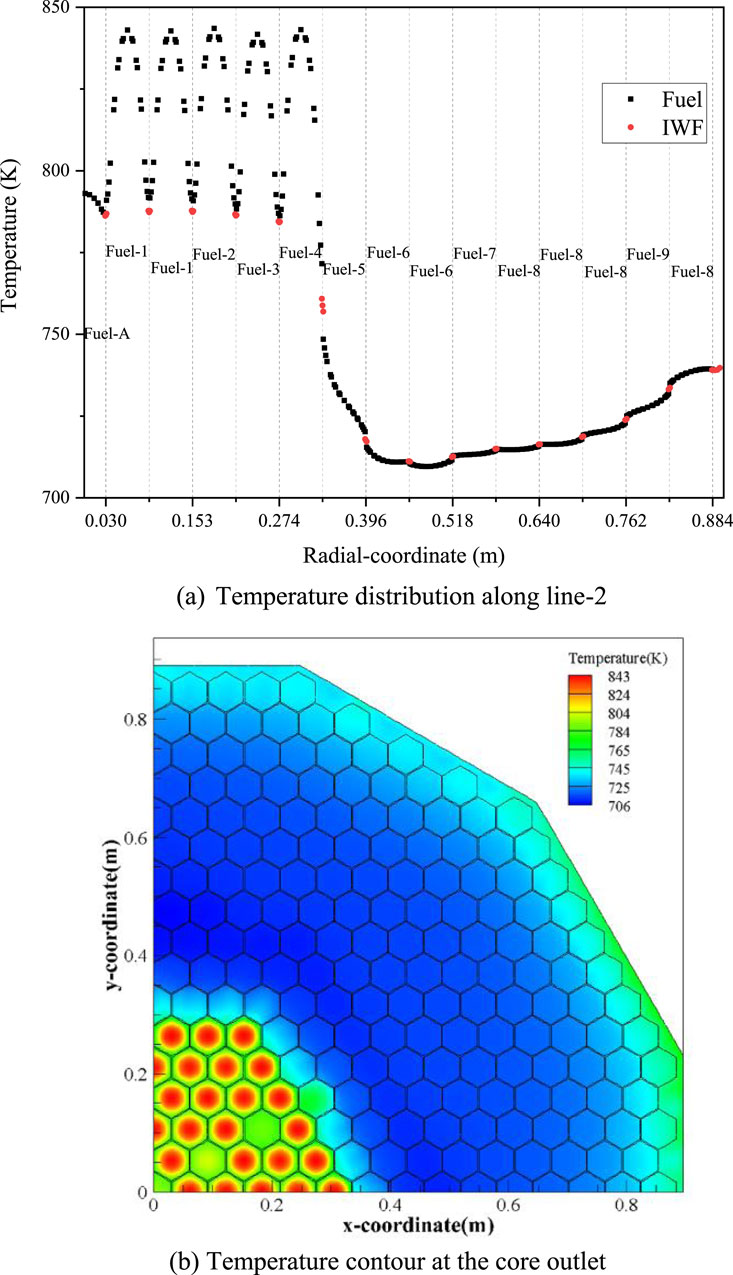
Figure 12. Temperature distribution at the core outlet. (A) Temperature distribution along line-2. (B) Temperature contour at the core outlet.
In the outer region of the core outlet, temperature shows increase. It should be caused by the backflow of hot liquid sodium from the HPIR. In the gaps near fuel subassemblies, temperature of liquid sodium is slightly lower than that minimum temperature within the adjacent subassemblies; whereas in the gap of non-fuel subassemblies, temperature of liquid sodium is slightly higher that maximum temperature within adjacent subassemblies.
5.2.2 Flow field within the inter-wrapper region
Figure 13 shows the velocity distribution within the inter-wrapper region. It could be observed that hot sodium from the HPIR enters the inter-wrapper region from the outer region of the core and flows downward to the core bottom. Some of the liquid sodium moves toward the center of the core and flows upward to the HPIR, while the rest exits the core and flows into the steel shielding. The total mass flow rate for liquid sodium entering the inter-wrapper region is measured at 2.83 kg/s, with 1.05 kg/s of that returning to the HPIR. Table 2 provides the total mass flow rate and corresponding average temperature for liquid sodium entering and exiting the inter-wrapper region. The results indicate that as the liquid sodium descends to the core bottom, it is cooled by the non-fuel subassemblies. Conversely, when it ascends towards the HPIR, it is heated by the fuel subassemblies.
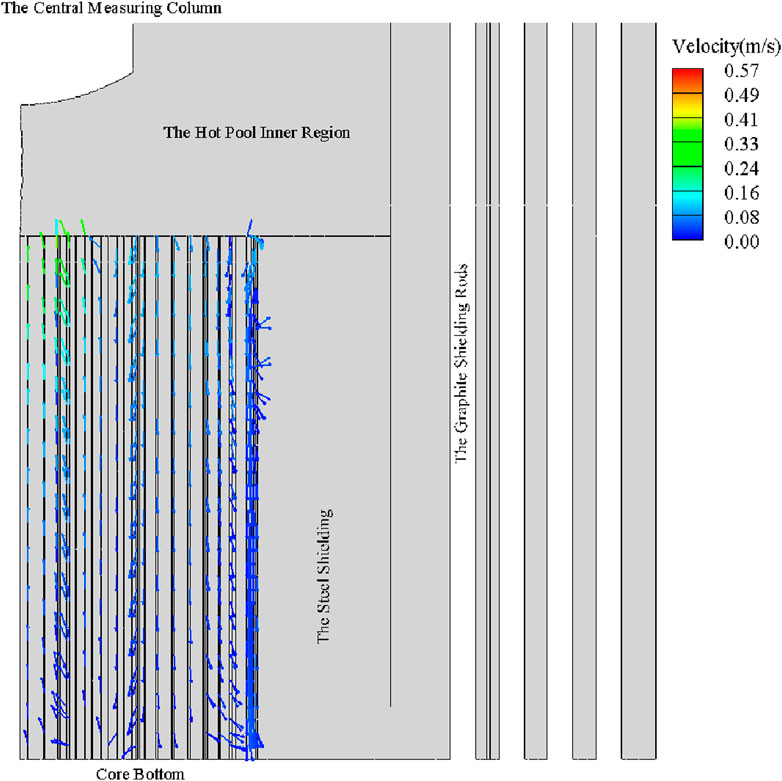
Figure 13. Velocity distribution within the inter-wrapper.
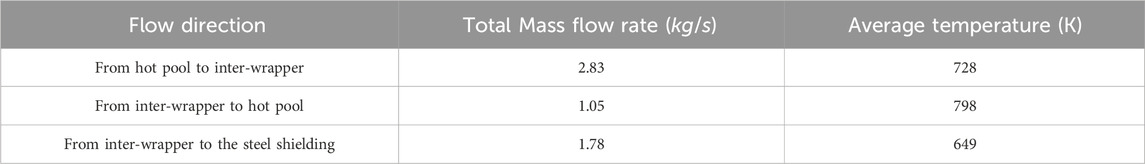
Table 2. Mass flow rate at different locations.
Table 3 shows the total heat transfer rate from the inter-wrapper region to the subassembly region, calculated by integrating the heat flux on the duct wall. A positive value means that heat is transferred from inter-wrapper region to the subassembly region. And a negative value indicates that heat is transferred in the opposite direction. It could be observed that most non-fuel subassemblies are heated by the inter-wrapper flow, particularly the Fuel-6 and Fuel-9. The ratio of the total heat transfer rate between the inter-wrapper flow and the subassemblies to the heat generated within subassemblies reaches 96% and 75%, respectively. Fuel subassemblies, while cooled by the inter-wrapper flow, are less affected, with the maximum ratio being only 2.45%.
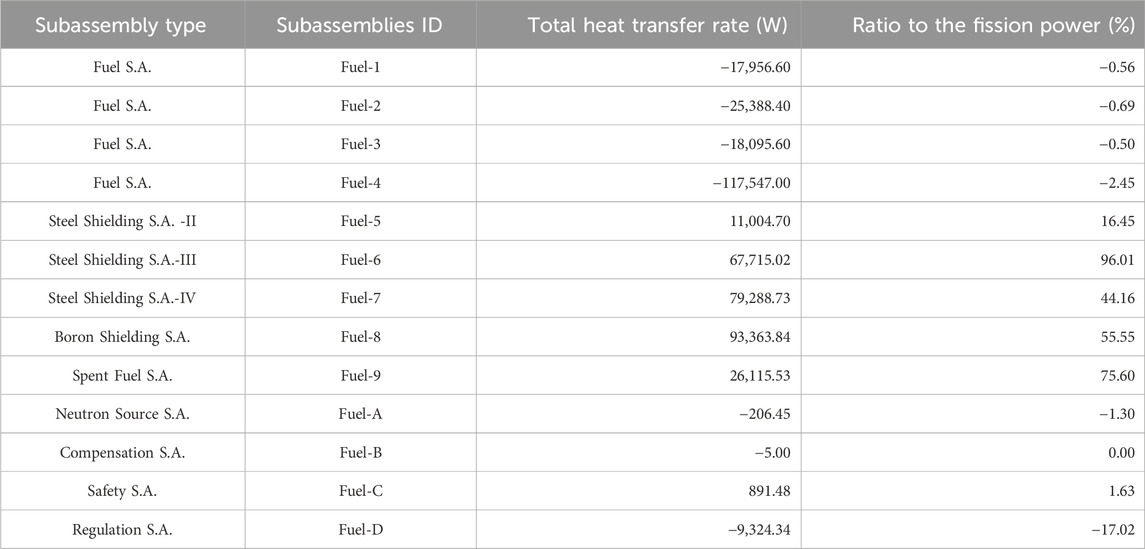
Table 3. The total heat transfer rate from the inter-wrapper region to the subassembly region.
5.2.3 Temperature distribution on the duct wall
Figure 14 shows the temperature distribution on the duct wall of Fuel-1. It could be observed that temperature gradient exists in both circumferential direction and vertical direction. Vertically, the temperature gradually increases with elevation, resulting in a significant temperature difference between the bottom and the top of the duct wall. Circumferentially, higher temperatures are observed at the center of the duct wall, while lower temperatures are present near the corners.
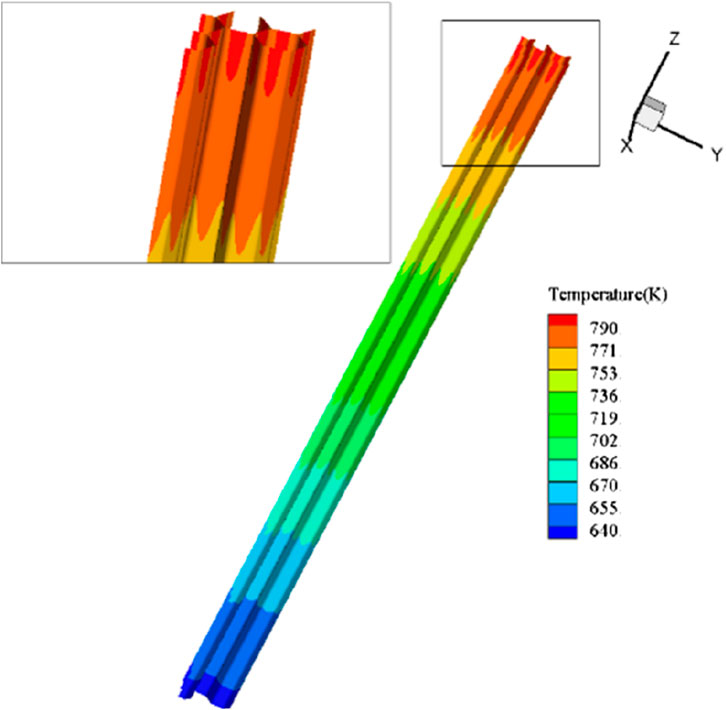
Figure 14. Temperature distribution on the duct wall of Fuel-1.
The temperature gradient on the duct wall surface is calculated in both the circumferential and vertical directions. Since the duct wall is extended along the z direction, the vertical temperature gradient is calculated as
where
Table 4 shows the maximum temperature gradient on the surface of duct wall in both circumferential direction and vertical direction. Generally, for a given subassembly, the circumferential temperature gradient is larger than the vertical gradient. When comparing vertical temperature gradients across different subassemblies, it is observed that subassemblies located in the outer region of the core tend to have higher vertical temperature gradients compared to those in the central region. Comparing the temperature gradients of Fuel-4 and Fuel-5 with other subassemblies reveals that significant temperature gradients exist in both directions near the transition region between fuel and non-fuel subassemblies.
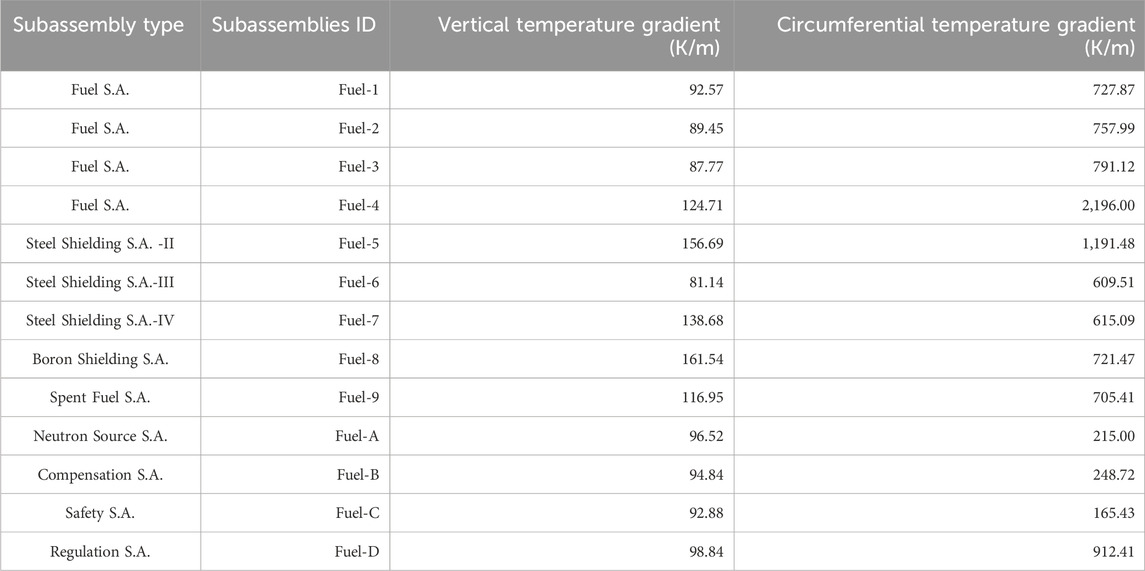
Table 4. Maximum temperature gradient along the duct wall of fuel subassemblies.
6 Conclusion
A 3D model of the CEFR reactor core coupled with the hot pool was created using the CFD method, and simulation was performed under steady-state conditions. Important information was obtained for the flow field at the core outlet, the inter-wrapper flow and temperature distribution on the subassembly duct. At the core outlet, pressure, along with temperature and velocity, exhibits a non-uniform distribution. The pressure in fuel subassemblies is higher than that in non-fuel subassemblies, while the inter-wrapper flow adjacent to fuel subassemblies experiences lower pressure than that near non-fuel subassemblies. Liquid sodium in the inter-wrapper region comes from the hot pool above the core, entering from the outer core region and returning to the hot pool inner region from the core central region. The inter-wrapper flow is cooled by non-fuel subassemblies and heated by fuel subassemblies. Significant temperature gradients are observed on the duct wall, both vertically and circumferentially, with circumferential temperature gradients generally being larger. The most pronounced temperature gradient is found on the duct of subassemblies adjacent to the transition region between fuel and non-fuel subassemblies.
Data availability statement
The raw data supporting the conclusions of this article will be made available by the authors, without undue reservation.
Author contributions
XW: Conceptualization, Investigation, Software, Writing–original draft, Writing–review and editing. XL: Data curation, Methodology, Writing–review and editing. RX: Formal Analysis, Validation, Visualization, Writing–review and editing. DH: Supervision, Writing–review and editing. TW: Project administration, Writing–review and editing. DZ: Supervision, Writing–review and editing.
Funding
The author(s) declare that no financial support was received for the research, authorship, and/or publication of this article.
Conflict of interest
The authors declare that the research was conducted in the absence of any commercial or financial relationships that could be construed as a potential conflict of interest.
Publisher’s note
All claims expressed in this article are solely those of the authors and do not necessarily represent those of their affiliated organizations, or those of the publisher, the editors and the reviewers. Any product that may be evaluated in this article, or claim that may be made by its manufacturer, is not guaranteed or endorsed by the publisher.
References
Conti, A., Gerschenfeld, A., Gorsse, Y., and Lavastre, R. (2015). “Numerical analysis of core thermal-hydraulic for sodium cooled fast reactors,” in 16th International Topical Meeting on Nuclear Thermal-Hydraulics (NURETH-16), Chicago, USA, August 30-September 4, 2015.
Ducros, F. (2008). “A proposal for a global multi-scale/multi resolution thermalhydraulic approach for Gen IV concepts,” in International Workshop on Thermal-Hydraulics of Innovative Reactor and Transmutation System (THIRS), Grenoble, France.
Fink, J., and Leibowitz, L. (1995). Thermodynamic and transport properties of sodium liquid and vapor. U.S. Department of Energy Office of Scientific and Technical Information Technical Reports. Argonne, IL: Argonne National Lab.
Guo, Y. (2020). “Numerical analysis of flow and heat transfer in the natural cycle experiment section of a sodium cold fast reactor (SFR),”. Master’s thesis (School of Energy Power and Mechanical Engineering). Beijing, China: North China Electric Power University.
Hoffmann, H., Weinberg, D., and Webster, R. (1991). Investigation on natural convection decay heat removal for the EFR: status of the program. No. IWGFR--85.
Kamide, H., Hayashi, K., Isozaki, T., and Nishimura, M. (2001). Investigation of core thermohydraulics in fast reactors—interwrapper flow during natural circulation. Nucl. Technol. 133, 77–91. doi:10.13182/nt01-a3160
Kamide, H., Hayashi, K., and Toda, S. (1998). An experimental study of inter-subassembly heat transfer during natural circulation decay heat removal in fast breeder reactors. Nucl. Eng. Des. 183, 97–106. doi:10.1016/s0029-5493(98)00169-1
Khan, E., Rohsenow, W., Sonin, A., and Todreas, N. (1975a). “Porous body model for predicting temperature distributions in wire wrapped fuel and blanket assemblies of a LMFBR,”. PhD thesis (Cambridge, USA: Massachusetts Inst. of Technology).
Khan, E., and Todreas, N. (1973). Review of recent analytical and experimental studies applicable to LMFBR fuel and blanket assembly design. Cambridge, USA: Massachusetts Inst. of Technology.
Khan, E. U., Rohsenow, W. M., Sonin, A. A., and Todreas, N. E. (1975b). A porous body model for predicting temperature distribution in wire-wrapped fuel rod assemblies. Nucl. Eng. Des. 35, 1–12. doi:10.1016/0029-5493(75)90076-x
Kimura, N., Miyake, Y., Yasuda, A., Miyakoshi, H., Nishimura, M., Tokuhiro, A., et al. (2000). “Noise reduction techniques for the Particle image velocimetry-application to an experimental study on natural convection in a fast reactor core,” in 8th International Conference on Nuclear Engineering (ICONE-8), Baltimore, Maryland, USA, April 2-6, 2000.
Mente, V. M., Pandey, G. K., Banerjee, I., Ajesh Kumar, S., Padmakumar, G., and Rajan, K. K. (2014). Experimental studies in water for safety grade decay heat removal of prototype fast breeder reactor. Ann. Nucl. Energy 65, 114–121. doi:10.1016/j.anucene.2013.10.017
Ohira, H., Xu, Y., Bieder, U., Velusamy, K., Mochizuki, H., Choi, S., et al. (2013). “Benchmark analyses of sodium natural convection in the upper plenum of the MONJU reactor vessel,” in International Conference of Fast Reactors and Related Fuel Cycles: Safe Technologies and Sustainable Scenarios, France, 4–7.
Pacio, J., Daubner, M., Fellmoser, F., and Wetzel, T. (2019). Experimental study of the influence of inter-wrapper flow on liquid-metal cooled fuel assemblies. Nucl. Eng. Des. 352, 110145. doi:10.1016/j.nucengdes.2019.06.007
Parthasarathy, U., Sundararajan, T., Balaji, C., Velusamy, K., Chellapandi, P., and Chetal, S. (2012). Decay heat removal in pool type fast reactor using passive systems. Nucl. Eng. Des. 250, 480–499. doi:10.1016/j.nucengdes.2012.05.014
Ro, T. S., and Todreas, N. E. (1988). Energy transfer mechanisms in LMR rod bundles under mixed convection conditions. Nucl. Eng. Des. 108, 343–357. doi:10.1016/0029-5493(88)90223-3
Tenchine, D. (2010). Some thermal hydraulic challenges in sodium cooled fast reactors. Nucl. Eng. Des. 240, 1195–1217. doi:10.1016/j.nucengdes.2010.01.006
Tenchine, D., Barthel, V., Bieder, U., Ducros, F., Fauchet, G., Fournier, C., et al. (2012a). Status of TRIO_U code for sodium cooled fast reactors. Nucl. Eng. Des. 242, 307–315. doi:10.1016/j.nucengdes.2011.10.026
Tenchine, D., Bavière, R., Bazin, P., Ducros, F., Geffraye, G., Kadri, D., et al. (2012b). Status of CATHARE code for sodium cooled fast reactors. Nucl. Eng. Des. 245, 140–152. doi:10.1016/j.nucengdes.2012.01.019
Velusamy, K., Chellapandi, P., Chetal, S., and Raj, B. (2010). Overview of pool hydraulic design of Indian prototype fast breeder reactor. Sadhana - Acad. Proc. Eng. Sci. 35, 97–128. doi:10.1007/s12046-010-0022-0
Wang, S. (2022). “Research on characteristics of natural circulation in primary system for pool-type sodium-cooled fast reactor during passive residual heat removal process,”. PhD thesis (Xi’an, China: Xi’an Jiaotong University).
Wang, S., Zhang, D., Ping, S., Yapei, Z., Mingjun, W., Yingwei, W., et al. (2018). Validation of a methodology for thermal stratification analysis in sodium-cooled fast reactors. Int. J. Energy Res. 42 (12), 3803–3822. doi:10.1002/er.4108
Wang, X. A., Zhang, D., Wang, M., Song, P., Wang, S., Liang, Y., et al. (2020). Hybrid medium model for conjugate heat transfer modeling in the core of sodium-cooled fast reactor. Nucl. Eng. Technol. 52, 708–720. doi:10.1016/j.net.2019.09.009
Xu, M., and Yang, H. (2016). Sodium cold fast reactor and its safety characteristics. Physics 45, 561–568. doi:10.7693/wl20160902
Xu, Y. (2003). “Three dimensional analysis for the thermal hydraulic within the sodium pool of China Experimental Fast Reactor,”. Master’s thesis (Beijing, China: China Institute of Atomic Energy).
Xue, X., Yang, H., and Yang, F. (2008). Numerical investigation for thermal hydraulic distribution at the outlet of fuel subassembly of CEFR under steady state. Nucl. Sci. Eng. (01), 75–80.
Yu, Y. (2013). “Real-time simulation model and program research of primary coolant system of pool-type sodium cooled fast reactor,”. Master’s thesis (Harbin, China: Harbin Engineering University).
Yue, N., Zhang, D., Chen, J., Song, P., Wang, X., Wang, S., et al. (2018). The development and validation of the inter-wrapper flow model in sodium-cooled fast reactors. Prog. Nucl. Energy 108, 54–65. doi:10.1016/j.pnucene.2018.05.007
Zhang, D., Liu, L., Liu, M., Xu, R., Cheng, G., Zhang, J., et al. (2018). Review of conceptual design and fundamental research of molten salt reactors in China. Int. J. Energy Res. 42 (5), 1834–1848. doi:10.1002/er.3979
Nomenclature
Greek symbol
Acronyms
CEFR China Experimental Fast Reactor
CFD Computational Fluid Dynamic
DHR Decay Heat Removal
DHX Decay Heat Exchanger
GIF Generation IV International Forum
GSR Graphite Shielding Rods
HPIR Hot Pool Inner Region
HPOR Hot Pool Outer Region
IGCAR Indira Gandhi Centre for Atomic Research
IHX Intermediate Heat Exchanger
IWF Inter-Wrapper Flow
KALLA Karlsruhe Liquid Metal Laboratory
PFBR Prototype Fast Breeder Reactor
PIV Particle Image Velocimetry
RANS Reynolds-Averaged Navier-Stokes
S.A. Subassembly
SFR Sodium-cooled Fast Reactor
SIMPLE Semi-Implicit Method for Pressure-Linked Equations
Keywords: pool-type sodium-cooled fast reactor, computational fluid dynamic, porous medium model, the inter-wrapper flow, temperature gradient
Citation: Wang XA, Liang X, Xu R, He D, Wang T and Zhang D (2024) Numerical investigation on the core thermal hydraulic behavior of pool-type sodium-cooled fast reactor (SFR). Front. Energy Res. 12:1439022. doi: 10.3389/fenrg.2024.1439022
Received: 27 May 2024; Accepted: 25 September 2024;
Published: 03 October 2024.
Edited by:
Shoaib Usman, Missouri University of Science and Technology, United StatesReviewed by:
Yuh-Ming Ferng, National Tsing Hua University, TaiwanKaruppanna Velusamy, Indira Gandhi Centre for Atomic Research (IGCAR), India
Copyright © 2024 Wang, Liang, Xu, He, Wang and Zhang. This is an open-access article distributed under the terms of the Creative Commons Attribution License (CC BY). The use, distribution or reproduction in other forums is permitted, provided the original author(s) and the copyright owner(s) are credited and that the original publication in this journal is cited, in accordance with accepted academic practice. No use, distribution or reproduction is permitted which does not comply with these terms.
*Correspondence: Dalin Zhang, ZGx6aGFuZ0BtYWlsLnhqdHUuZWR1LmNu