- College of Electrical Engineering, Shanghai University of Electric Power, Shanghai, China
The rapidly increasing proportion of renewable energy sources has led to a reduction in the relative share of synchronous units, which has resulted in a decline in the inertia of the power system and a decrease in its voltage support capacity. This has led to several issues related to the frequency and voltage stabilities of the power system. To ensure these frequency and voltage stabilities, it is necessary to maintain a number of synchronous units online in the day-ahead generation schedule. First, the dynamic frequency change process after a power system fault is discussed, and a linear expression is derived for the frequency stability constraints involving energy storage systems and wind turbines. Second, the short-circuit capacity of the bus is characterized to describe the strength of voltage support, and the minimum short-circuit capacity requirement of the bus is solved based on the transient voltage recovery problem after clearance of the short-circuit faults. The total short-circuit capacity provided by the unit to the bus is then calculated through the network reactance matrix to establish the voltage stability constraint. Subsequently, the security-constrained unit commitment model considering frequency and voltage stabilities (FVS-SCUC) is established. Finally, the effectiveness of the proposed model is demonstrated through a numerical simulation of the IEEE-39 system comprising storage and wind turbines. The model ensures the frequency and voltage securities of the system, and the renewable energy output is improved upon considering energy storage. Thus, the overall system cost was reduced by nearly 30% by considering the frequency regulation effects of the energy storage system and wind turbine as well as the voltage regulation effects of the energy storage system.
1 Introduction
Ensuring the security and economic operations of power systems over extended periods of time is a primary objective of their development (Xia et al., 2013). Given the widespread integration of energy storage systems and wind turbines, the proportion of synchronous units within the power system has decreased gradually, which has severely weakened the inertial and voltage support capabilities of the system under the same active disturbances (Lin et al., 2023a). Currently, the frequency-constrained unit commitment (FCUC) model that considers frequency stability has received widespread attention, where the inertia of the power system serves as a widely employed pivotal indicator to assess the frequency support capability. Zhang et al. (2021) defined and modeled the inertia of various resources within the power system, and their study delved into the effects of inertia on system stability and mechanisms of the power angle. Furthermore, they consolidated the evaluation methods for power system inertia. Subsequently, the FCUC model accompanied by various linearization approaches was proposed for the frequency nadir constraint. Teng et al. (2016) linearized the minimum frequency constraint post-fault by simplifying the dynamic frequency response characteristics; however, the process of deriving the minimum frequency constraint involves a logarithmic function that poses challenges for swift resolution. Badesa et al. (2019) introduced a linearization method to address this non-linear constraint, where binary variables are used to represent the primary frequency regulation power provided by the units.
Zhang et al. (2020) utilized the frequency safety margin to analyze the impact of renewable energy injection on frequency stability. Badesa et al. (2021a,2021b) evaluated the frequency characteristics of the diverse regions within the system and established a linear model depicting the variation characteristics of the inertial center frequency. Yang et al. (2022) proposed employing the time-domain integration of the frequency deviation during the primary and secondary frequency regulation processes as an indicator to assess the frequency stability and established a two-stage stochastic FCUC model. Wang et al. (2020) proposed a security-constrained unit commitment (SCUC) model by considering the dynamic frequency with post-disturbance frequency nadir as the characteristic constraint and used Benders decomposition for the two-stage solution. Li et al. (2023a) proposed a market mechanism for the inertia and primary frequency response as well as an enhanced piecewise linearization (PWL) method to establish a linear expression for the frequency nadir constraint to facilitate model solving. Tuo and Li (2023) explored the impacts of the system region oscillations on the initial maximum rate of change of frequency (RoCoF) and used the PWL technique to linearize the RoCoF constraint.
Given the significant roles of storage systems in enhancing the frequency stabilities of renewable energy systems (Wang et al., 2022) and their potential to mitigate wind turbine curtailment when integrated at the grid connection buses (Zheng et al., 2014), numerous scholars have integrated storage into the frequency stability constraints (FSCs). Among these scholars, Zhu et al. (2024) examined the influences of the synchronous units, storage inertia, and primary frequency regulation (PFR) on frequency stability within the SCUC model, while Xu et al. (2020) analyzed the low inertia characteristics of energy storage on frequency stability. These works predominantly focus on the study of SCUC with an emphasis on frequency stability. Traditional SCUC models rely on linear network security constraints based on DC power flow, whereas the voltage stability analyses typically employ non-linear AC power flow models. Consequently, constructing simple and linear voltage stability constraints (VSCs) in the SCUC models poses a significant challenge.
Presently, the prevalent approach among scholars is to construct voltage stability assessments based on indicators, such as short-circuit ratio and short-circuit capacity. Yu et al. (2022a) introduced a short-circuit ratio index to evaluate the voltage support capacity and proposed independent analyses of the frequency and voltage support strengths within the system. Similarly, Fu et al. (2024) proposed a transient overvoltage risk assessment method for multiple renewable short-circuit ratio (MRSCR) at renewable energy stations; this method analyzes the correlation between the MRSCR and transient overvoltage at the grid connection buses, in addition to identifying the key influencing factors to conduct the risk assessments accordingly. Yu et al. (2022b) considered the short-circuit ratio indexes of renewable-energy grid-connected systems and proposed a method for calculating the critical short-circuit ratio to evaluate the voltage support strength. Sun et al. (2023) considered the interplay between multiple feeding branches in renewable-energy grid-connected systems; they established a mathematical model to analyze the transient overvoltage in a single-feeding system to determine its minimum short-circuit capacity and maximum reactive power scale. Regarding the specific characteristics of wind turbines, Wu et al. (2022) assessed the applicability of the short-circuit ratio index to various issues in wind-power grid-connected systems, including static voltage stability, transient voltage stability, and sub/ultra-synchronous oscillations; they showed that enhancing the short-circuit ratio index effectively bolstered the stability of the system.
Researchers have also explored transient voltage stability considerations and proposed some assessment criteria. Xue et al. (1999) introduced some evaluation methodologies and metrics for transient voltage stability by delineating it under two categories: voltage stability and voltage drop acceptable range; they then proposed quantitative indicators to assess the transient voltage stability and voltage drop. Li et al. (2023b) studied the mechanisms of transient voltage instability within single-unit and load systems; they demonstrated the consistency between critical points in the static P-V and V-Q curves of a given system as well as proposed some calculation methods and stability criteria for the quantitative indicators of transient voltage stability.
Meanwhile, Niu et al. (2021) advocated the use of the short-circuit current weight index as a weighting factor to supply short-circuit capacity to the system; they established a quantitative relationship between the short-circuit capacities of conventional units and each of the bus bars by integrating the short-circuit capacity constraints into the SCUC model. Jiang et al. (2021) proposed a unit commitment (UC) model incorporating transient VSCs; this model delineates the linear stability cut constraints via time-domain simulation trajectory sensitivity analysis and embeds them in the UC model.
Lin et al. (2023b) proposed the necessity of meeting the short-circuit capacity requirements and transient voltage support capabilities by employing the MRSCR to construct the VSCs. Furthermore, Zhongda and Fei (2023) effectively transformed the non-linear static VSC into the second-order cone format to achieve an overall mixed-integer second-order cone form by drawing from AC power flow principles to derive the VSC. The SCUC model proposed in this study considers both frequency stability and static voltage stability by recognizing the significant influences of synchronous units and inverter-based generators. The aforementioned studies summarize the main contributions of previous scholars, and the summary of references is shown in Table 1.
Based on the above review, the severity of frequency and voltage stability challenges within renewable energy power systems should be acknowledged, and the substantial impacts of storage and renewable energy integration should be considered. Thus, the main contributions of this study are as follows:
1. The SCUC model considering frequency and voltage stabilities (FVS-SCUC) is proposed, and its effectiveness is verified through the IEEE-39 system with integrated storage and wind turbines.
2. The impacts of storage and wind turbines on frequency stability are considered along with the short-circuit capacity provided by the storage to the buses; thus, the proposed SCUC model also considers storage and wind turbines, and its effectiveness is verified.
2 FSC with multiresource participation
2.1 Equivalent single-unit and single-load system
In the single-unit and single-load system comprising the synchronous generator, energy storage, wind turbine inertia response, and primary frequency regulation, the dynamic response of the frequency can be described by the first-order ordinary differential equation:
where
2.2 Dynamic frequency response characteristics of the power system
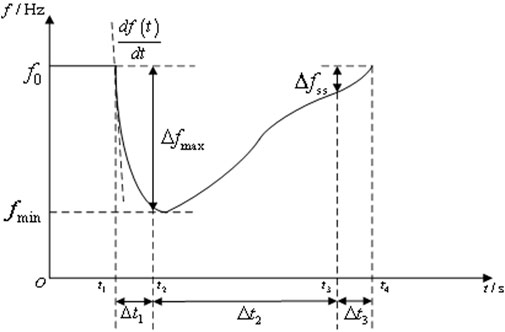
The dynamic frequency response characteristic of a power system following an active power disturbance is as shown in Figure 1; this is based on the assumption that the power disturbance in the system occurs at the initial moment
The power disturbances mainly refer to the active power deficits caused by emergency accidents, such as a sudden increase in the load and a generator outage. In the dynamic frequency response model of the PFR of the power system, the frequency modulation effects of the load are ignored, and the FSCs are derived as noted below.
2.3 RoCoF constraint with multiresource participation
The virtual inertia and primary frequency response are achieved through conservation of a portion of the capacity in the networked energy storage. In contrast to conventional units, the inertial constants of the energy storage systems are achieved through control strategies (analogous to those employed in wind and photovoltaic power systems).
The virtual mechanical time constant of storage
where
Energy storage can activate and deactivate the inertial support as needed, and Zhu et al. (2024) showed that the maximum inertial support power limit for the storage unit is given as
where
To prevent secondary oscillations caused by the absorption of active power into the system when restoring the speed of the wind turbine after providing inertial support, Liu et al. (2016) proposed a control method to delay the restoration of the speed of the wind turbine until the system’s PFR had responded fully. The active power required for wind turbine recovery is jointly borne by all PFR resources:
where
The total inertia of the system
where
Chu et al. (2020) proposed that the RoCoF is related to the active power shortage from the system disturbance and total inertia level of the system at the initial moment of power disturbance given by
where
2.4 Frequency nadir constraint with multiresource participation
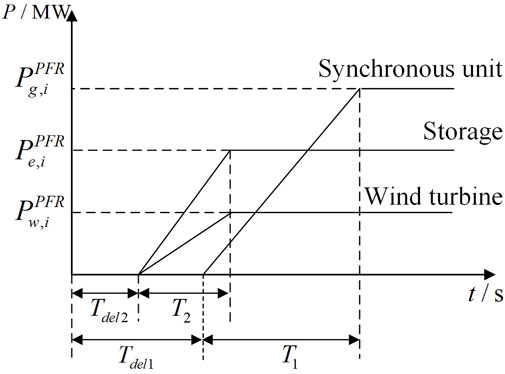
Based on the assumptions that the synchronous unit, storage unit, and wind turbine PFR increase linearly at a certain ramp rate, their frequency response process is as shown in Figure 2. Zhu et al. (2024) showed that
From Figure 2, the frequency nadir
where
By integrating both sides of Equation 1, the expression for the frequency nadir is obtained as
where
The power shortage is fully compensated by the frequency modulation resources without considering load frequency modulation. Substituting Equation 2 above, the frequency nadir constraint can be obtained as
where
2.5 Quasi-steady-state frequency constraint with multiresource participation
When the frequency drops to the nadir, power support is provided by the stored energy and synchronous PFR while ensuring that the total power from both sources exceeds the unbalanced power:
Thus, the following FSC sets are obtained:
3 Construction of VSCs in SCUC
3.1 Minimum short-circuit capacity requirement of buses
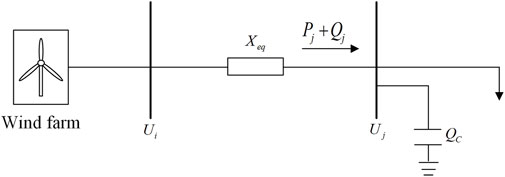
Based on the Technical Regulations for Wind Farm Connection to Power System Part 1: Onshore Wind Power (Gustavo and Gimenez, 2021), the requirement for low-voltage ride-through of wind power is proposed. When the short-circuit fault in the power grid is cut off for 1 s and voltage at the grid connection point reaches 0.9 p.u., the wind turbines are allowed to disconnect from the grid. To prevent disconnection of the wind turbines, it is necessary to maintain the minimum short-circuit capacity requirement of the renewable-energy grid-connected buses to suppress any transient voltage deviations; the smaller the short-circuit capacity, the more severe are the transient voltage deviations. The equivalent circuit of the renewable energy system is shown in Figure 3, where
In the high-voltage grid, the resistance is neglected. Therefore, according to the voltage drop formula, the following can be derived:
where
Next, we set the short-circuit capacity
Using approximate algorithms and substituting Equation 3 into Equation 4, we obtain the simplified expression for the short-circuit capacity of bus
where
With the assumption that
During the short-circuit fault, the active power provided by the unit is zero, so the reactive power margin
where
The maximum voltage deviation allowed for the buses connected to renewable energy sources during faults is 0.1 p.u. Therefore, the minimum short-circuit capacity requirement of the bus can be derived as follows:
where
3.2 VSCs based on short-circuit capacity
The short-circuit capacity of each bus in the system depends on the network structure and start–stop status of each unit. The equivalent impedances of different units to different buses vary along with the short-circuit capacities that they provide. To adapt to the algorithm and obtain linear constraints, it is necessary to quantify the short-circuit capacities provided by different units to different buses. Using the short-circuit capacity conversion coefficient, the short-circuit current provided by each synchronous unit to each bus is weighted, thereby associating the start–stop status of that unit with the short-circuit capacity of the corresponding bus.
The short-circuit capacity of a bus is the product of its rated voltage
As the unit values of the short-circuit capacity and short-circuit current are equal, only the short-circuit current
Owing to the large short-circuit currents provided by the synchronous units to the system, the electrical distance between each unit and each bus can be represented by the network reactance matrix. This matrix can be used to calculate the short-circuit current provided by each unit to each bus. To calculate the short-circuit capacity provided by the synchronous unit
where
The short-circuit capacity
To ensure that each system bus has sufficient short-circuit capacity to maintain the transient voltage stability in the event of a fault, it is necessary to ensure that the short-circuit capacity
where
The short-circuit capacity provided by storage
where
4 FVS-SCUC model with energy storage and wind turbine participation
4.1 Objective function
Considering the coal consumption costs of thermal units, startup and shutdown costs of thermal units, operation and maintenance costs of wind turbines, compensation costs for energy storage charging and discharging, compensation costs for PFR of energy storage, and compensation costs for energy storage inertial services, the objective function can be obtained as shown in Equation (7):
Here,
4.2 System-level constraints
4.2.1 Power balance constraint
The system must meet the power balance at each time period
where
4.2.2 Active reserve constraint
When addressing the power deficit and outage of the largest-capacity unit, the active power reserved by the system is given as
where
4.2.3 Network security constraint
The power flowing through line
where
4.2.4 FSC set
Based on the derivations in Section 2, the obtained FSC set is as follows:
4.2.5 VSCs
Based on VSG technology, energy storage devices provide a certain short-circuit capacity support to the fault point at the moment of failure; considering the storage, the maximum output power
If the short-circuit capacity provided by grid-type energy storage is not considered, the above expression becomes
4.3 Constraints related to thermal power units
4.3.1 Power output constraints of thermal power units
The thermal power unit
where
4.3.2 Climbing constraints for thermal power units
This work distinguishes between the climbing rate during the operating period of the thermal power unit and that during the startup and shutdown periods, whose constraints are as follows:
where
4.3.3 Time constraints for starting and stopping thermal power units
The running and shutdown times of a thermal power unit
where
4.4 Wind turbine output constraints
Based on VSG technology, the rotational inertia of a wind turbine transmission shaft system can provide certain inertial support to the system. In addition, Kuang et al. (2022) proposed that wind power needs a reserve capacity in the output to provide PFR to the power system.
The output constraints of a wind turbine are related to the capacity constraints of PFR as follows:
where
4.5 Energy-storage-related constraints
4.5.1 Energy storage charging constraint
The charging power of energy storage is limited by its maximum and minimum values, and a certain margin of this value needs to be left as a reserve for PFR and inertial support of energy storage (Zhu et al., 2024):
where
4.5.2 Energy storage discharging constraint
The discharging power of energy storage is constrained by not only the maximum and minimum discharge power limits but also a certain margin that must be left as reserve for PFR and inertial support of energy storage (Zhu et al., 2024):
where
4.5.3 State of charge (SoC) capacity constraint
A portion of the energy storage capacity is often maintained as reserve for PFR and inertial support, and the reserve capacity supported by the energy storage short-circuit capacity is neglected owing to the instantaneous character of short-circuit capacity support:
where
4.5.4 SoC operational constraint
The remaining capacity state of energy storage is limited; thus, the initial value of the electrical energy for the next period during operation is equal to the electrical energy at the end of the previous period, and the electrical energy at the initial time period is equal to that at the final time period. Since the constraints on energy storage charging and discharging consider the active power output required for inertial services and PFR, these factors are not considered again below to avoid duplication:
where
5 Example analysis
In this study, the enhanced IEEE-39 system was selected for numerical analyses. The corresponding model was established using MATLAB 2021a, and the CPLEX software is called using YALMIP. Linear programming and iterative methods were used to solve the model, and the steps for the solution are as follows:
1. Determine the UCs of the prestart units based on the conventional constraints (i.e., system and individual unit constraints).
2. In the prestartup UCs determined in step 1, calculate the inertial and short-circuit capacities provided by each unit to meet the frequency and voltage stability constraints as well as solve the startup scheme that meets the stability constraints.
3. If the final UC scheme in step 2 meets the power flow security constraints, then output the result; if not, return to step 1 for recalculation.
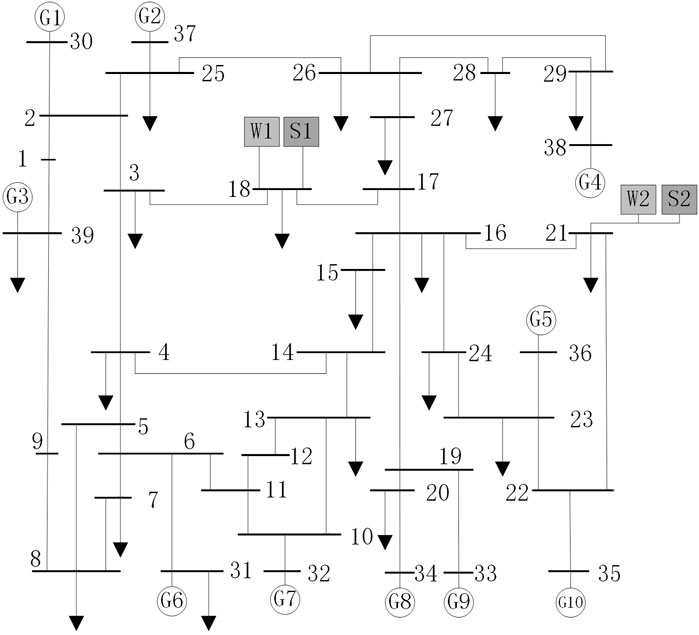
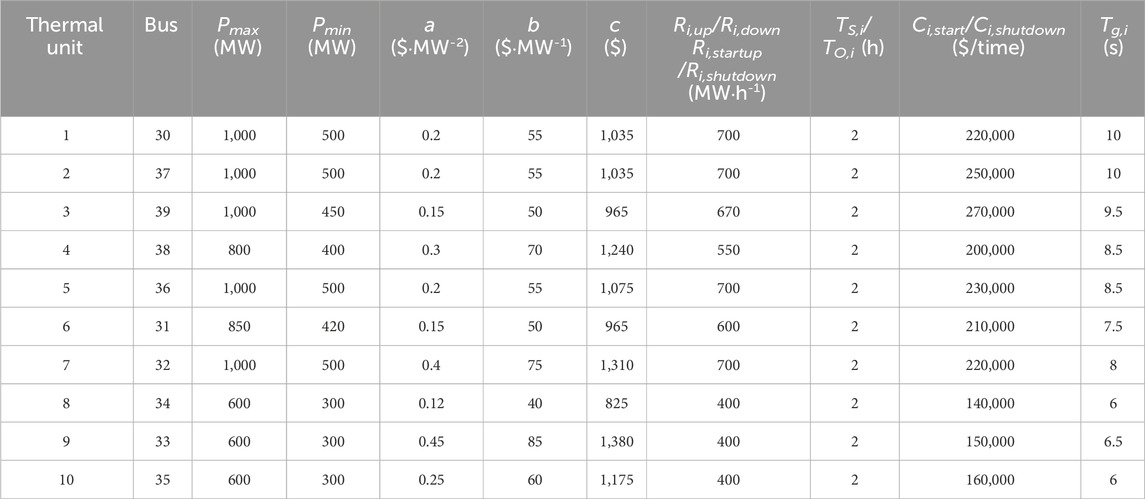
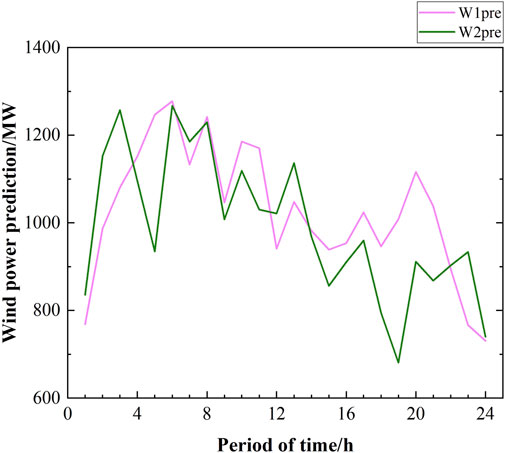
Two wind turbines and two energy storage units were installed at buses 18 and 21, respectively. The system structure is shown in Figure 4, and the parameter settings and system parameters of each unit are shown in Tables 2–4; the parameters of the thermal power unit used in this work are based on Yang et al. (2020), and the practical values of the parameters were ensured. The wind power prediction is shown in Figure 5; here,
The disturbance in each time period is set to a sudden increase of 5% of the total load in the corresponding time period, and the reserve coefficient of each thermal unit is set to 5%. The rated frequency of the system is 50 Hz, maximum RoCoF value is 1 Hz/s, and maximum frequency deviation is 1 Hz (National Energy Administration, 2021). The delay of storage PFR
Comparative analyses were then conducted for the following five scenarios:
Scenario 1: SCUC involving storages and wind turbines;
Scenario 2: FCUC without storages and wind turbines involved in frequency regulation;
Scenario 3:FVS-SCUC without storages and wind turbines involved in frequency and voltage regulations;
Scenario 4: FCUC involving storages and wind turbines;
Scenario 5: FVS-SCUC involving storages and wind turbines.
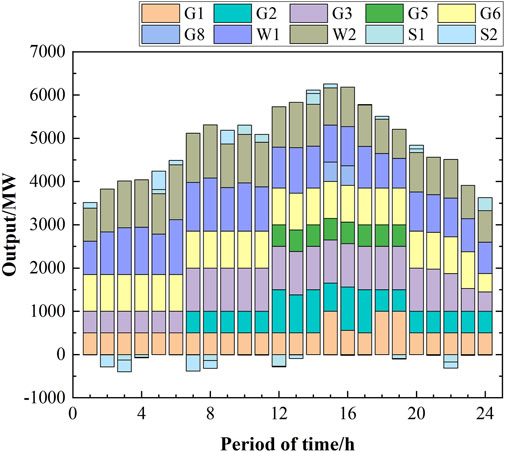
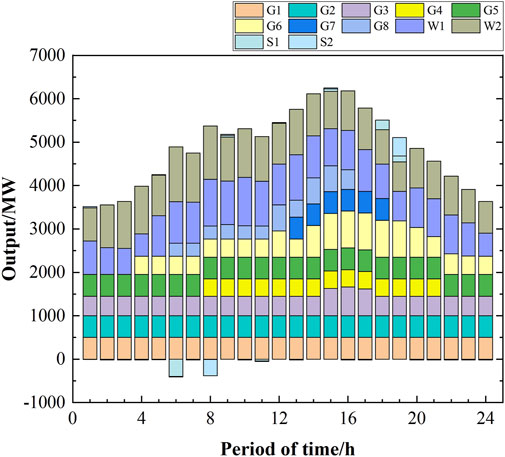
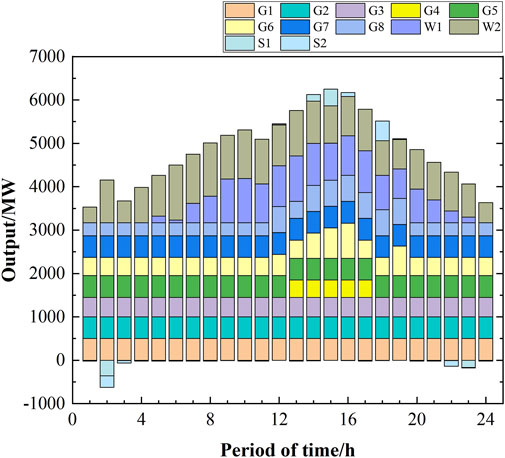
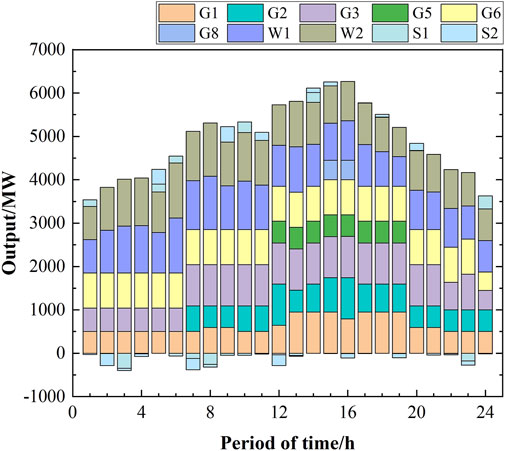
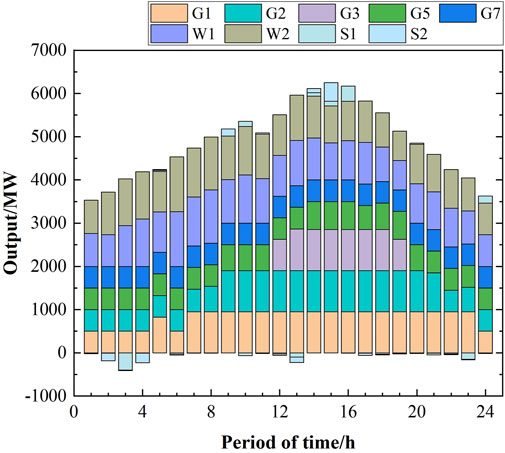
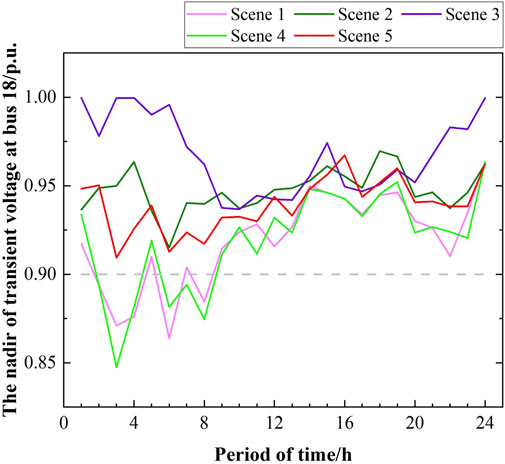
The UC planning of each unit during each time period of the system, as solved in scenarios 1 to 5 are shown in Figures 6–10, respectively. Based on the principle of prioritizing the startups of units with lower coal consumption and startup costs, units 1, 2, and 3 had the highest numbers of open times. A comparison between scenarios 1 and 3 reveals that the system must increase the number of thermal units that need to be opened to meet the minimum inertial and short-circuit capacity requirements. Thus, the system activated units 4 and 7 during the peak load periods. A comparison of scenarios 2 and 3 reveals that the minimum short-circuit capacity requirement constraint necessitated opening of units 6, 7, and 8 during periods of low loads. This resulted in significant curtailment of wind power generation during these periods. Furthermore, the high costs of charging energy storage meant that they were unable to fully absorb the wind power output.
A comparison of the UC planning of scenarios 2 and 4 reveals the impact characteristics of energy storage and wind turbines on the frequency, which reduced the frequency regulation burden of the thermal power units. Consequently, the number of thermal unit opening times in scenario 4 decreased. Similarly, comparing the UC planning of scenarios 3 and 5 by considering the impact of energy storage on the short-circuit capacity, it is seen that the voltage regulation burden of the thermal power units is reduced, resulting in a decrease in the number of startup units in scenario 5 compared to scenario 3. Conversely, the curtailed wind power in scenarios 4 and 5 decreased. A comparison of scenarios 4 and 5 reveals that when VSCs are considered, the operations shift from units 3 and 6 to units 2, 5, and 7 during periods of low loads. As shown in Table 5, the reason for this shift is that units 5 and 7 exhibit lower reactances to the renewable-energy grid-connected buses, thereby reducing the electrical distance. Moreover, these units have greater maximum capacities, enabling them to provide robust voltage support to the buses.
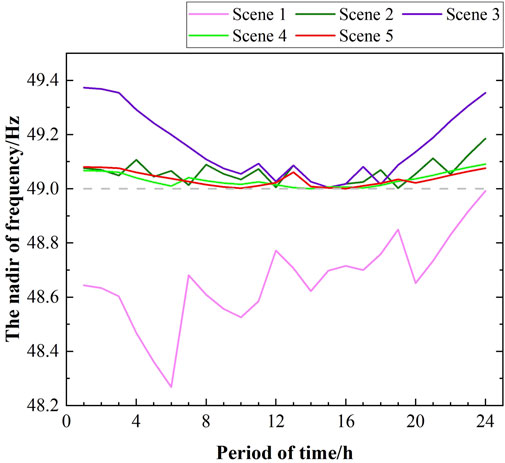
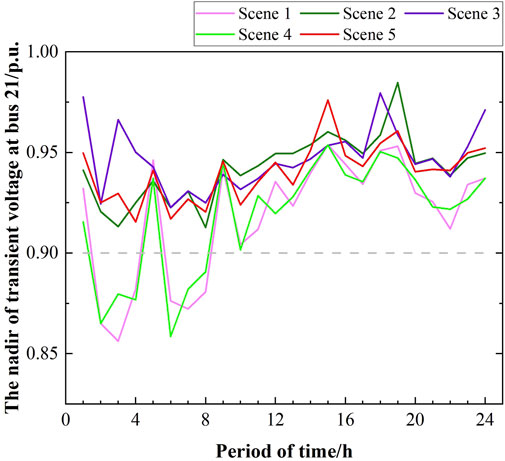
As shown in Figures 11–13, scenarios 3 and 5 demonstrate that the frequency and voltage are within the prescribed limits. Similarly, scenarios 2 and 4 satisfy the frequency constraints. In contrast, scenario 1 fails to meet both the frequency and voltage constraints. The results of scenario 2 in Figure 12 demonstrate that the generation plan is capable of meeting the minimum short-circuit demands of the buses and maintaining the transient voltage above 0.9 p.u.; this indicates that FSC is an effective constraint in this scenario. It can be observed that the transient voltage stability criterion is not met in scenario 4.
The proportion of renewable energy output in each scene is shown in Figure 14. Because of consideration of the frequency and voltage stability constraints, the number of thermal units increased, resulting in decreases in the outputs of the wind turbines. In most of the time periods, scenario 3 exhibited the lowest proportion of renewable energy output. Scenario 5 considers the frequency and voltage regulation effects of the storage and wind turbines; compared to scenario 3, the number of thermal units opened had reduced, and the proportion of renewable energy output had increased.
As shown in Table 6, in scenarios 2 and 3, owing to consideration of the frequency and voltage stability constraints, the startups of high-cost thermal units significantly increased the total cost of the system compared to scenario 1. In scenarios 4 and 5, after considering the constraints from energy storage and wind turbine participation in the frequency and voltage stabilities, the burden on the thermal units for frequency and voltage regulations reduced. Consequently, the numbers of startup and shutdown operations of these units decreased, leading to reduced startup costs compared to scenarios 2 and 3. Moreover, the total system cost decreased.
However, with the incorporation of energy storage for frequency regulation and inertial services, the PFR costs and daily charging/discharging power increase, resulting in elevated energy-storage-related costs in scenarios 4 and 5 than scenarios 2 and 3. Although wind turbine curtailment occurs in scenarios 2 and 3, resulting in reduced wind turbine costs, there is no curtailment in scenario 4. This wind curtailment, in conjunction with the consideration of energy storage and wind turbine participation in the frequency and voltage stabilities, enhances the economic efficiency of the system.
In scenarios 4 and 5, the numbers of thermal units opened increased due to the consideration of VSCs in scenario 5, resulting in wind curtailment and subsequent decrease in the storage and wind turbine costs compared to scenario 4. The reduced number of unit shutdowns in scenario 5 resulted in reduced startup and shutdown costs compared to those in scenario 4.
6 Conclusion
This study addresses the challenges of frequency and voltage instabilities in renewable energy systems due to reductions in the number of thermal power units being started after large-scale integration of renewable energy sources. Consequently, we propose an SCUC model considering frequency and voltage stabilities by taking into account the impacts of energy storage and wind turbine generators on the frequency and voltage stabilities. The following conclusions can be drawn:
(1) Based on the assumption that the PFR output of each resource in the system increases linearly over time, incorporating the derived FSCs into the SCUC can ensure frequency stability.
(2) It is necessary to include VSCs in the SCUC. Once the short-circuit faults are cleared, it is necessary to enhance the voltage support capabilities and suppress transient voltage deviations at the wind turbine buses to prevent disconnection of the wind turbines from the grid.
(3) Further consideration of the impacts of energy storage and wind turbine generators on the frequency and voltage stability constraints in the FVS-SCUC allows reduction in the total cost of the system and a decrease in wind curtailment, thereby improving the economic efficiency of the system.
(4) Compared to methods proposed by other scholars, the approach presented herein considers the short-circuit capacities provided by all units in the grid buses by incorporating energy storage considerations. This approach allows linearized VSCs; further, the proposed method is computationally straightforward and suitable for formulating day-ahead generation schedules in large-scale power grids.
Data availability statement
The original contributions presented in this study are included in the article/Supplementary Material, and any further inquiries may be directed to the corresponding author.
Author contributions
ZZ: Writing–original draft, Writing–original editing. ZJ: Conceptualization, Formal analysis, Methodology, Resources, Writing–original draft, Writing–original editing.
Funding
The author declares that no financial support was received for the research, authorship, and/or publication of this article.
Conflict of interest
The author declares that the research was conducted in the absence of any commercial or financial relationships that could be construed as a potential conflict of interest.
Publisher’s note
All claims expressed in this article are solely those of the authors and do not necessarily represent those of their affiliated organizations or those of the publisher, editors, and reviewers. Any product that may be evaluated in this article or claim that may be made by its manufacturer is not guaranteed or endorsed by the publisher.
Abbreviations
FSC, frequency stability constraint; VSC, voltage stability constraint; FVS-SCUC, security-constrained unit commitment model considering frequency and voltage stabilities; PFR, primary frequency regulation; PWL, piecewise linearization; VSG, virtual synchronous generator; RoCoF, rate of change of frequency; SoC, state of charge; UC, unit commitment.
References
Badesa, L., Teng, F., and Strbac, G. (2019). Simultaneous scheduling of multiple frequency services in stochastic unit commitment. IEEE Trans. Power Syst. 34 (5), 3858–3868. doi:10.1109/tpwrs.2019.2905037
Badesa, L., Teng, F., and Strbac, G. (2021a). Conditions for regional frequency stability in power system scheduling—part i: theory. IEEE Trans. Power Syst. 36 (6), 5558–5566. doi:10.1109/tpwrs.2021.3073083
Badesa, L., Teng, F., and Strbac, G. (2021b). Conditions for regional frequency stability in power system scheduling—part ii: application to unit commitment. IEEE Trans. Power Syst. 36 (6), 5567–5577. doi:10.1109/tpwrs.2021.3073077
Chu, Z., Markovic, U., Hug, G., and Teng, F. (2020). Towards optimal system scheduling with synthetic inertia provision from wind turbines. IEEE Trans. Power Syst. 35 (5), 4056–4066. doi:10.1109/tpwrs.2020.2985843
Fu, X., Cui, J., Wang, C., Song, X., and Sun, Y. (2024). Transient overvoltage risk assessment considering the short-circuit ratio of multiple renewable energy stations [J/OL]. J. Power Syst. Automation, 1–10. Available at: http://doi.org.shiep.vpn358.com/10.19635/j.cnki.csu-epsa.001407.
Gustavo, M., and Gimenez, J. (2021). Technical regulations for wind Farm integration into power system Part 1: onshore wind power[S]. Beijing: China Standards Press.
Jiang, M., Guo, Q., Sun, H., and Ge, H. (2021). Short-term voltage stability-constrained unit commitment for receiving-end grid with multi-infeed HVDCs. IEEE Trans. Power Syst. 36 (3), 2603–2613. doi:10.1109/tpwrs.2020.3031021
Kuang, L., Wen, Y., Lu, Y., and Lin, X. (2022). Research on frequency stability constrained optimization scheduling model for microgrids with virtual synchronous units. Proceeding CSEE 42 (01), 71–83. doi:10.13334/j.0258-8013.pcsee.210127
Li, K., Guo, H., Fang, X., Liu, S., Teng, F., and Chen, Q. (2023a). Market mechanism design of inertia and primary frequency response with consideration of energy market. IEEE Trans. Power Syst. 38 (6), 5701–5713. doi:10.1109/tpwrs.2022.3223497
Li, X., Fang, Y., Wu, X., Hou, Y., Li, Z., and Liu, F. (2023b). Quantitative indicators of transient voltage stability based on instability mechanism analysis. Electr. Power Autom. Equip. 43 (11), 195–202. doi:10.16081/j.epae.202301023
Lin, Y., Wang, B., Guo, Q., Zhao, H., and Sun, H. (2023b). Short-circuit ratio and short-term voltage security constrained unit commitment in high wind power-injected power systems. IEEE Trans. Power Syst. 34 (10), 1–13. doi:10.1109/TPWRS.2023.3347508
Lin, Y., Wang, K., Lai, Y., Chen, H., Zhao, Y., Xu, X., et al. (2023a). Analysis of frequency characteristics of power systems under low inertia and overview of battery energy storage frequency modulation control strategies. Power grid Technol. 47 (2), 447–462. doi:10.13335/j.1000-3673.pst.2022.1269
Liu, B., Yang, J., Liao, K., and He, Z. (2016). An improved frequency control scheme for doubly fed wind turbines based on rotor kinetic energy control. Power Syst. Autom. 40 (16), 17–22. doi:10.7500/AEPS20150930009
National Energy Administration (2021). Technical specifications for grid connected operation and control of electrochemical energy storage power plants Part 7 Inertia support and damping control.
Niu, S., Ke, X., Ren, C., Huo, C., Wang, Z., Zhang, G., et al. (2021). Optimization method for operation mode of large-scale renewable energy DC transmission end power grid based on quantitative evaluation of short-circuit capacity. Electr. Power Autom. Equip. 41 (12), 123–129. doi:10.16081/j.epae.202108016
Sun, H., Lin, Y., and Zhao, B. (2023). Quantitative analysis method for voltage support strength of renewable energy grid connected systems based on transient overvoltage constraints. Proceeding CSEE 43 (11), 4207–4216. doi:10.13334/j.0258-8013.pcsee.220468
Teng, F., Trovato, V., and Strbac, G. (2016). Stochastic scheduling with inertia-dependent fast frequency response requirements. IEEE Trans. Power Syst. 31 (2), 1557–1566. doi:10.1109/tpwrs.2015.2434837
Trovato, V., Bialecki, A., and Dallagi, A. (2019). Unit commitment with inertia-dependent and multispeed allocation of frequency response services. IEEE Trans. Power Syst. 34 (2), 1537–1548. doi:10.1109/tpwrs.2018.2870493
Tuo, M., and Li, X. (2023). Security-constrained unit commitment considering locational frequency stability in low-inertia power grids. IEEE Trans. Power Syst. 38 (5), 4134–4147. doi:10.1109/tpwrs.2022.3215915
Wang, B., Yang, D., and Cai, G. (2020). Unit commitment considering dynamic frequency constraints under large-scale wind power grid connection conditions. Power grid Technol. 44 (7), 2514–2519. doi:10.13335/j.1000-3673.pst.2019.2088
Wang, K., Xie, L., Qiao, Y., Lu, Z., and Yang, H. (2022). Analysis of battery energy storage improving frequency regulation performance of power systems. Power Syst. autom. 46 (1), 174–180. doi:10.7500/AEPS20210409002
Wu, L., Li, Y., Yu, S., Sun, Y., Wang, X., Yang, Y., et al. (2022). Stability analysis of wind power collection system based on short-circuit ratio index. Electr. Power Autom. Equip. 42 (8), 73–78. doi:10.16081/j.epae.202205030
Xia, Q., Zhong, H., and Kang, C. (2013). Development and prospects of security constrained unit commitment theory and application. Proceeding CSEE 33 (16), 94–103.
Xu, X., Ma, S., Huang, Y., and Chang, X. (2015). Large scale wind power integration affects the static voltage stability of the power grid research on impact mechanisms. China Electr. Power 48 (3), 139–143.
Xu, Z., Wang, C., Zheng, H., Li, Y., and Han, J. (2020). Unit commitment and economic dispatch of low inertia power grid with energy storage considering frequency constraints. Adv. Technol. Electr. Eng. Energy 39 (11), 26–32. doi:10.12067/ATEEE2006038
Xue, Y., Xu, T., Liu, B., and Li, Y. (1999). Transient voltage stability and acceptable voltage drop. Power Syst. Autom. 23 (14), 4–8.
Yang, M., Zhang, L., Lyu, J., Xue, B., and Yuan, H. (2020). Flexibility oriented electric energy and auxiliary services Market Joint Clearing Model. Electr. Power 53 (8), 182–192. doi:10.11930/j.issn.1004-9649.202006277
Yang, Y., Peng, J.C.-H., Ye, C., Ye, Z. S., and Ding, Y. (2022). A criterion and stochastic unit commitment towards frequency resilience of power systems. IEEE Trans. Power Syst. 37 (1), 640–652. doi:10.1109/tpwrs.2021.3095180
Yu, L., Sun, H., Xu, S., Zhao, B., Zhang, J., and Li, Z. (2022a). Overview of quantitative evaluation indicators for voltage support strength of power electronic equipment access. Proceeding CSEE 42 (2), 499–514. doi:10.13334/j.0258-8013.pcsee.212126
Yu, L., Sun, H., Zhao, B., Xu, S., Zhang, J., and Li, Z. (2022b). Analysis of short-circuit ratio index and critical short-circuit ratio calculation method for renewable energy grid connected systems. Proceeding CSEE 42 (3), 919–928. doi:10.13334/j.0258-8013.pcsee.212399
Zhang, W., Wen, Y., Chi, F., Wang, K., and Li, L. (2021). Research framework and prospects for inertia assessment in power systems. Proceeding CSEE 41 (20), 6842–6855. doi:10.13334/j.0258-8013.pcsee.202461
Zhang, Z., Du, E., Teng, F., and Kang, C. (2020). Modeling frequency dynamics in unit commitment with a high share of renewable energy. IEEE Trans. Power Syst. 35 (6), 4383–4395. doi:10.1109/tpwrs.2020.2996821
Zheng, L., Hu, W., Lu, Q., Min, Y., Yuan, F., and Gao, Z. (2014). A comprehensive optimization model for planning and operation of energy storage systems for improving wind power access. Proceeding CSEE 34 (16), 2533–2543. doi:10.13334/j.0258-8013.pcsee.2014.16.003
Zhongda, C., and Fei, T. (2023). Voltage stability constrained unit commitment in power systems with high penetration of inverter-based generators. IEEE Trans. Power Syst. 38 (2), 1572–1582. doi:10.1109/tpwrs.2022.3179563
Zhu, J., Zhu, X., Chen, B., Yu, L., Nie, L., Huang, W., et al. (2024b). New energy inertia time constant evaluation method based on delay compensation. Power Syst. Autom. 48 (8), 101–110. doi:10.7500/AEPS20230803006
Zhu, L., Dong, K., Tang, L., Li, Z., and Yu, J. (2024a). A joint optimization and clearing model for electrical energy, inertia, and primary frequency modulation considering the inertia of synchronous unit and virtual inertia of energy storage[J/OL]. Proceeding CSEE, 1–14. Available at: http://h-p.kns.cnki.net.shiep.vpn358.com/kcms/detail/11.2107.TM.20230608.1106.003.html.
Keywords: energy storage, frequency stability, network reactance matrix, security-constrained unit commitment, voltage stability, wind turbine
Citation: Zidong Z and Jinquan Z (2024) Security-constrained unit commitment model considering frequency and voltage stabilities with multiresource participation. Front. Energy Res. 12:1437271. doi: 10.3389/fenrg.2024.1437271
Received: 23 May 2024; Accepted: 24 July 2024;
Published: 20 August 2024.
Edited by:
Yu Huang, Nanjing University of Posts and Telecommunications, ChinaReviewed by:
Dardan Klimenta, University of Pristina, SerbiaOmid Shariati, University of Reading, United Kingdom
Copyright © 2024 Zidong and Jinquan. This is an open-access article distributed under the terms of the Creative Commons Attribution License (CC BY). The use, distribution or reproduction in other forums is permitted, provided the original author(s) and the copyright owner(s) are credited and that the original publication in this journal is cited, in accordance with accepted academic practice. No use, distribution or reproduction is permitted which does not comply with these terms.
*Correspondence: Zhou Zidong, enpkNzc0NTcwNjk5QDE2My5jb20=
 Zhou Zidong
 Zhao Jinquan
