 Yazhe Lu
 Xu Ran*
 Zonglan Wei
- Science and Technology on Reactor System Design Technology Laboratory, Nuclear Power Institute of China, Chengdu, China
This paper is an investigation of the gas mixing and depressurization effects of containment spray on hydrogen risk during a typical severe accident in a light water reactor (LWR). Two spray tests (ST3_0 and ST3_1) were simulated using the OECD/SETH-2 project frame; the tests were performed with different preconditions in two interconnected vessels of the PANDA facility by focusing on the breaking-up of the stratified helium-rich layer and helium transport between the interconnected vessels with and without heat and mass transfer. The computational fluid dynamics simulations were performed using an Eulerian–Lagrangian approach, in which the dispersed droplets were tracked with a Lagrangian framework and the heat and mass transfer model between the droplets and gas were developed through user-defined functions. The simulation results are in reasonable agreement with the test data and reproduce the main phenomena of the spray tests. Although the proposed approach is adequate for addressing similar problems, some discrepancies still exist in the simulations. Based on these discrepancies, some recommendations are suggested to improve the accuracy of the proposed approach.
1 Introduction
During a typical severe accident in a light water reactor (LWR), oxidation of the reactor fuel cladding produces a large amount of hydrogen due to long-term coolant loss. In such cases, hydrogen is released through the cladding break and spreads to the entire containment space, mixing with air and steam. This gas mixture is locally flammable or even explosive and may threaten the containment integrity. Thus, multiple phenomena occur within the containment in the event of a severe accident, including the transport of gases (air, steam, and hydrogen), stratification of gases, and condensation of steam.
The containment spray system is an important safety mechanism used in hypothetical severe accidents and has two main functions: preventing containment overpressure and removing radioactive aerosols. Moreover, sprayed water injection can enhance gas mixing; hence, spray activation causes steam condensation (depressurization), spray droplet evaporation, and gas stratification breakup. This makes the post-accident phenomena more complex; the depressurization induced by the spray reduces the partial pressure of steam and enhances the risk of a hydrogen explosion, while the gas stratification break-up suppresses hydrogen accumulation in the head space to reduce the flammability of the gas mixture. Prediction of steam and hydrogen distribution during spray activation is essential for ensuring containment integrity and optimizing the severity of accident mitigation. Numerical analyses of these phenomena caused by the spray require sophisticated analytical tools, such as advanced lumped parameter (LP) and computational fluid dynamics (CFD) codes. Therefore, spray experimental investigations conducted in large-scale facilities are necessary to study these phenomena and provide detailed data for code validation.
In the past, some experimental investigations have been conducted in several test facilities, e.g., TOSQAN (IRSN, France), MISTRA (CEA, France), PANDA (PSI, Switzerland), and SPOT (JSC, Russia). These facilities were characterized by large enclosures (TOSQAN: 7 m3, MISTRA: 100 m3, PANDA: 180 m3, SPOT: 59 m3) to simulate the typical thermal–hydraulic conditions during an accident in the containment. Furthermore, helium was used to simulate hydrogen in these experiments.
The Severe Accident Research Network (SARNET) spray benchmark (2004–2007) (Wilkening et al., 2008; Babic et al., 2009; Malet et al., 2011) was developed to understand the influences of containment sprays on atmospheric behaviors by using the TOSQAN and MISTRA facilities. The benchmark was divided into two parts as follows: the thermal–hydraulic part concerned with depressurization by the spray (TOSQAN 101 and MISTRA MASPn tests); the dynamic part concerned with light gas stratification break-up by the spray (TOSQAN 113 and MISTRA MARC2b tests) (Malet and Huang, 2015). The spray tests included in the SARNET spray benchmark have been simulated using LP and CFD codes. Comparisons between the simulations and experiments revealed discrepancies in some local domains, such as the spray region and dome above the spray nozzle, despite the good global agreement in terms of pressure, gas temperature, and gas concentration (Malet et al., 2011; Malet et al., 2014). Thus, further investigations are needed to improve the predictability of the spray-related phenomena.
SARNET-2 that was launched in 2009 (Malet et al., 2015a) was the successor to SARNET; under the SARNET-2 framework, more detailed investigations have been conducted continually to improve the predictability of the spray-related phenomena. Three benchmarks were included in this framework: 1) heat and mass transfer of a single water droplet; 2) gas entrainment by a real pressurized water reactor spray nozzle; 3) gas entrainment by two real nozzles. CFD simulations accurately predicted the droplet size and velocity below the nozzle but had significant disparities in the gas-phase velocity compared to the corresponding experimental data (Malet et al., 2015a; Malet et al., 2014). In addition, sensitivity analysis showed that the input conditions at the spray boundary, such as the size and velocity distribution of the droplets as well as gas-phase velocity distribution, significantly affected the accuracy of the simulation results.
The OECD/SETH-2 project was launched by OECD/NEA during 2007–2010 (NEA/CSNI/R, 2012); in this project, tests were performed in enclosed facilities involving various conditions like handling light gas stratification as well as erosion of stratification and spray. A series of spray tests were carried out in the MISTRA and PANDA facilities; the MISTRA facility was a multicompartment vessel, and the PANDA facility was composed of two vessels (90 m3) connected by a pipe. These spray tests differed in their initial conditions for the temperature, pressure, and gas components, and an additional spray test was performed at normal temperature for reference. Mimouni et al. (2013) used the NEPTUNE_CFD code to simulate the reference test and another spray test in which the spray was injected in a typical post-accident condition. For the reference test, the simulation results of helium concentration matched the experimental data very well; for the spray test, the simulated pressure reduction rate was too high while the light gas concentration matched the test data.
The ERCOSAM-SAMARA project was a 4-year research (2010–2014) (Dabbene et al., 2015; Malet et al., 2015b) conducted by the European Union and Russia’s nuclear energy agencies; this project investigated the formation of gas stratification under the assumed typical severe accident scenarios and the accident mitigation system steps (sprays, condensers, heaters, etc.) for breaking such gas stratification. Four different volume facilities were utilized (TOSQAN, SPOT, MISTRA, and PANDA) along with the virtual facility HYMIX (3,180 + 3,010 m3). Tests were performed at these facilities with different volumes and structures to study the impacts of mitigation system activation on gas stratification at various spatial scales to draw general conclusions as well as provide references and inspiration for corresponding research expansion to containment. The tests indicated that the facilities of different scales showed similar phenomena when activating the same mitigation system (Dabbene et al., 2015), with spray being the most effective means of depressurization and atmospheric mixing compared to other mitigation measures. Numerical studies on these tests indicated that the currently available codes have the potential to simulate the thermal–hydraulic conditions of the containment (Malet et al., 2015b); however, optimization approaches are still needed for these simulation methods.
Based on the background and research status, the process of spray-breaking gas stratification in a multicompartment enclosed space is studied, and two tests (ST3_0 and ST3_1) conducted in the framework of the OECD/SETH-2 project using the PANDA facility are analyzed in this paper. Here, ST3_0 is the reference test and ST3_1 is the spray test performed under pure hot steam conditions. ANSYS FLUENT v18.0 was chosen as the tool to implement the CFD simulations, and an Eulerian–Lagrangian method was used to simulate the spray droplets by adding models using user-defined functions (UDFs) for some key phenomena during spraying. The following sections describe the spray tests and numerical calculations; then, the simulations are compared with the experiments for the characteristics of the spray phenomena. Finally, some recommendations are provided for more accurate calculations.
2 Description of the spray tests
2.1 Experimental facility
PANDA is a large-scale facility with an overall height of 25 m and a total volume of 515 m3. It is characterized by multicompartment construction and is equipped with CFD-grade instruments that can be used to investigate various thermal–hydraulic conditions in the LWRs (NEA/CSNI/R, 2012). The spray tests were performed in the drywell compartment of the PANDA facility (Figure 1A); the drywell compartment consists of two vessels (Vessel-1 and Vessel-2), each having a height of 8 m and diameter of 4 m, which are interconnected horizontally by a bent pipe (IP) of 1 m diameter. The spray nozzle is installed in Vessel-1, and its outlet is located 1.1 m from the top of the vessel. The nozzle has an outlet diameter of 6.4 mm, which is oriented vertically downward to produce a conical solid spray with an opening angle of 30°.

Figure 1. PANDA facility: (A) drywell compartment and (B) gas concentration measurement locations.
There are 261 and 87 K-type thermocouples installed in Vessel-1 and Vessel-2, respectively, for measuring the fluid and wall temperatures. The gas molar fractions are measured using mass spectrometer capillaries located at 59 positions in Vessel-1, 34 positions in Vessel-2, and 15 positions in the IP, as shown in Figure 1B (Erkan et al., 2011).
2.2 Information on the spray tests
Two tests (ST3_0 and ST3_1) were selected for the simulations, and both of them were focused on the spray-erosion of the stratified helium-rich layer at the top of Vessel-1 under different initial conditions. The experimental layout and parameters of the two tests are shown in Figure 2 (Mimouni et al., 2013; Erkan et al., 2011). The test sequence is divided into the preconditioning and spray phases. During the preconditioning phase, a helium-rich layer is formed at the top of Vessel-1; the remaining part of Vessel-1 together with the IP and Vessel-2 was preconditioned with air or steam before being pressurized. Then, in the spray phase, the spraying proceeded at a constant spray flow rate until the end of the test.
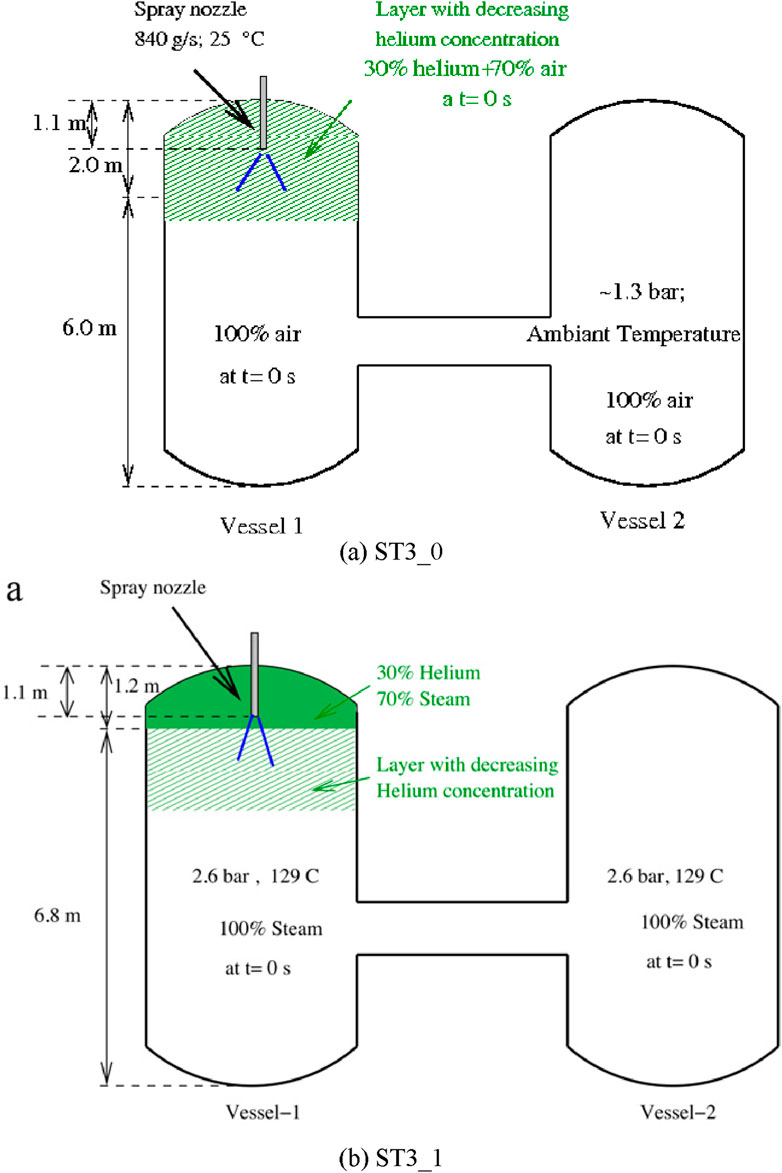
Figure 2. Schematic view of the experimental layout and parameters of the (A) ST3_0 and (B) ST3_1 tests.
For the reference test ST3_0, a helium-rich layer was produced at the top of Vessel-1 while the remaining space was filled with air at room temperature to consider only the hydrodynamic interactions between the droplets and ambient gas. The hot spray test ST3_1 was performed with steam and helium to investigate heat transfer between the spray droplets and steam during stratification breakup. Table 1 lists the parameters used for the initial conditions.
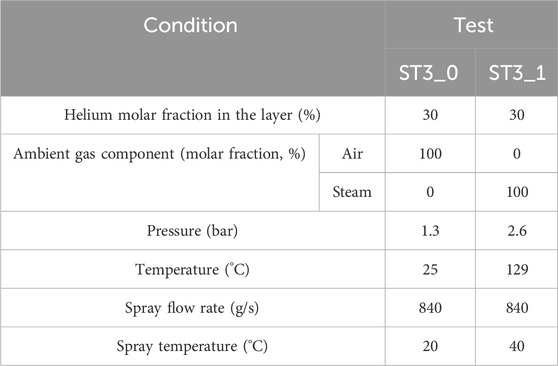
Table 1. Test parameters for ST3_0 and ST3_1.
3 Numerical calculations
Since the spray droplets occupy a much lower volume fraction than gas during the spray tests, an Eulerian–Lagrangian approach is suitable for simulating the spray process; here, the continuous gas is solved using an Eulerian approach while the dispersed droplets are tracked in a Lagrangian framework. The droplets can exchange mass, momentum, and energy with the gas.
ANSYS Fluent was used for the numerical computations in this paper, and its discrete phase model (DPM) is appropriate for the discrete droplets existing in the fluid field. In particular, the mass and heat transfer models were developed using UDFs, but the interactions between the droplets were neglected.
3.1 Governing equations and physical models
In the DPM, the gas phase was treated as a continuum and solved using the Navier–Stokes equation. Since large numbers of droplets are injected by the spray, these droplets were divided into a finite number of groups containing droplets of the same sizes, temperatures, and initial velocities to reduce the calculation cost. Then, each group was tracked as a single entity for representation. Equations 2–9 are governing equations of the physical model, which describe mass, momentum and energy conservation.
(1) Momentum equation
where
where
For the drag coefficient
where
In the Lagrangian framework, the droplet position and velocity are updated by integrating the momentum equation (Equation 1) and equation predicting the droplet trajectory:
where
(2) Energy equation
where
The convective heat transfer coefficient
where
(3) Mass equation
where
where
Given the similarity between heat and mass transfer, the Nusselt number
Here,
3.2 Computational domain
The fluid domain is the drywell space of the PANDA facility that ignores the internal structures such as the spray nozzle. Figure 3A shows the 3D computational domain; structural meshes were generated using ICEM CFD (Figure 3B) with different numbers of cells. The mesh quality is detailed in Table 2.
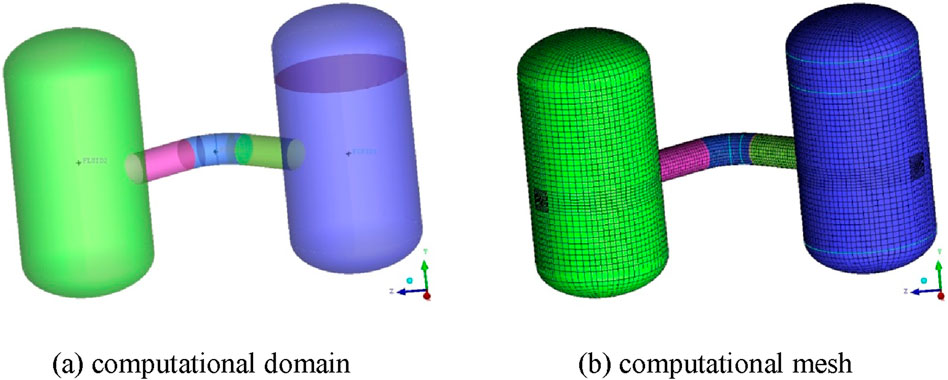
Figure 3. (A) Computational domain and (B) computational mesh of the two-vessel facility.

Table 2. Mesh quality comparisons.
3.3 Physical modeling
Using ANSYS Fluent, the turbulence was calculated by the standard k-ε model, and the buoyancy term was included for the transport equation of the rate of dissipation ε. The species transport model describes the mixing and transport of gas components by solving the standard scalar transport equations based on mass fractions. The properties of the gas mixture (steam and helium) were determined using the ideal gas mixing law, while the specific heat and thermal conductivity of each component were calculated using different polynomial laws depending on the gas temperature with the other properties set as constants. The drag force and gravity are considered in (Equation 1). In the DPM, an inert particle was chosen to simulate a droplet, and the mass and heat transfer models for the droplet were embedded in Fluent via UDFs using the Ranz and Marshall correlations in Equations (10, 11). To ensure two-way coupling between the droplets and gas, the corresponding source terms for the gas phase were added separately to the mass, momentum, and energy equations. The droplets were considered to be extracted from the domain as soon as they touched a wall. Neither droplet breakup nor collision was considered in the simulation. Moreover, for the preliminary simulations, collection and evaporation of the spray water in the lower head of Vessel-1 were neglected. For the initial conditions (Table 1), the helium-rich layer was simply set as the region that was 6 m above the bottom of Vessel-1, and the remaining space was considered to be filled with 100% air or steam. The wall condition was set to have a constant temperature that was the same as the initial atmospheric temperature.
4 Simulation results and discussion
4.1 Validation of mesh independence
Based on the ST3_0 test, two meshes (Table 2) were validated for mesh independence. At the C14 measurement point in Vessel-1 (z = 6.926 m, r = 1.430 m), the molar fraction time evolutions of helium calculated from the two meshes are as shown in Figure 4. There was no significant improvement with the mesh containing 546,738 cells; thus, the following results are all based on the mesh comprising 228,715 cells.
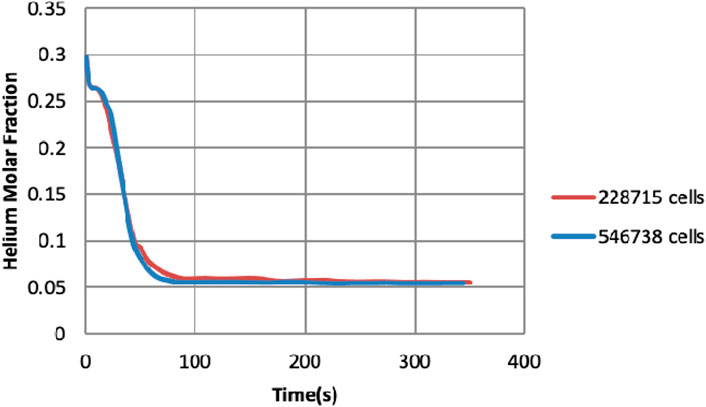
Figure 4. Mesh independence test results.
4.2 Results for the ST3_0 test
Three measurement points were selected for comparisons with the calculated results and experiment data. These positions are as noted in Table 3. Figure 5 shows the comparison for the time evolution of helium concentration; there is a difference in the comparison at point B18 in Vessel-1, while the simulation results agree well with the test data for the other two measurement points. The reason for this may be the lack of detailed initial data when simulating the ST3_0 test, especially for helium concentration distribution, as its initial conditions were simplified as stepwise changes along the height for calculations (Section 3.3). For the simulation, the initial simplified gas layer has a significant effect on the change in helium concentration.
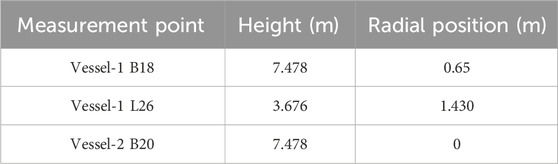
Table 3. Positions of the concentration measurement points in the PANDA drywell.
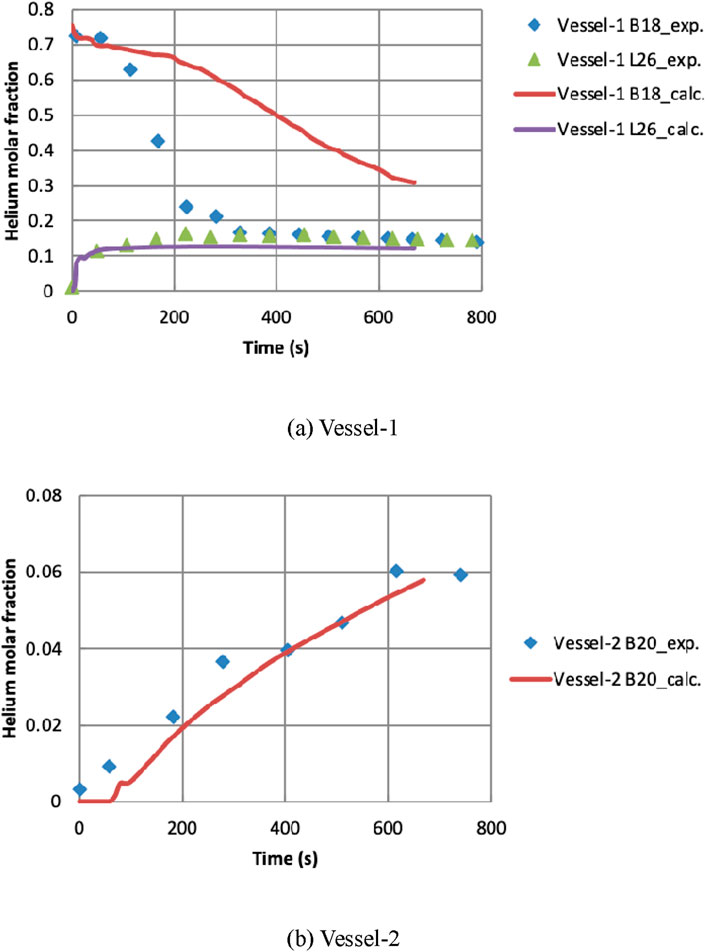
Figure 5. Helium volume fraction time evolutions (PANDA ST3_0 test) in (A) Vessel-1 and (B) Vessel-2.
Figure 6 displays the helium molar fraction distribution over time in the computational domain. As the spray activates, the helium concentration decreases at the top of Vessel-1 because of convection caused by the spray. This process thins the helium-rich layer, resulting in a more homogeneous mixture. Moreover, the difference in concentration causes helium to diffuse into Vessel-2 through the IP. The velocity vector field in Vessel-1 at different moments is shown in Figure 7. It is seen that approximately 40 s after the spray starts, the gas entrainment by the spray becomes strong and develops the flow in Vessel-1. Once the flow develops, stable global circulation is established around the spray zone but the gas is almost stagnant in the space above the nozzle.
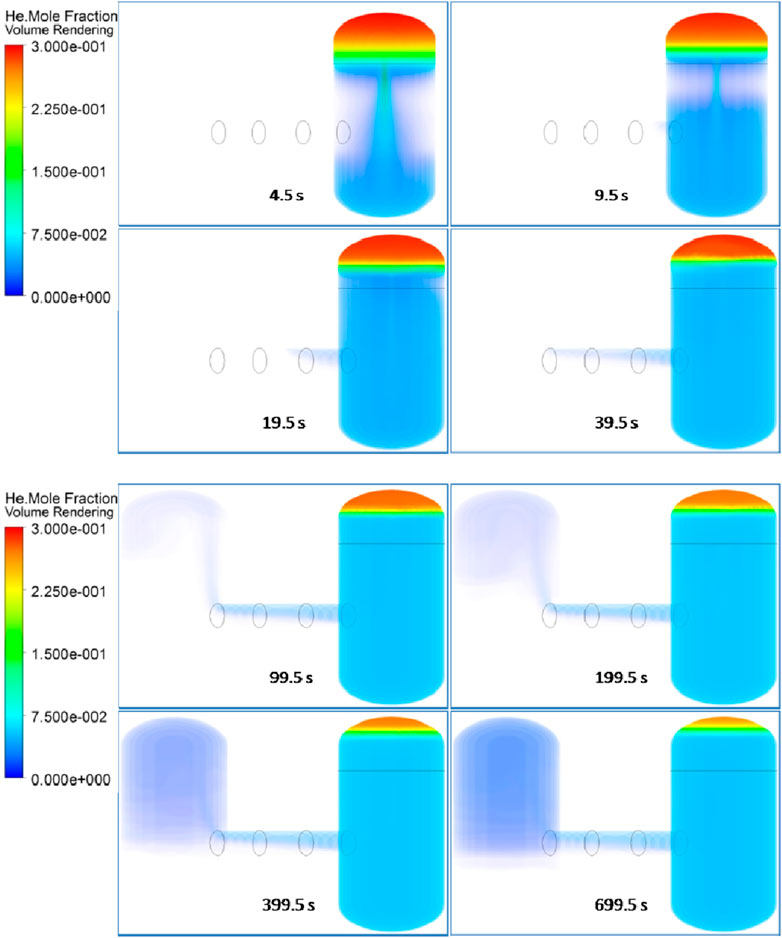
Figure 6. Helium molar fractions over time after spray activation (PANDA ST3_0 test, left: Vessel-2; right: Vessel-1).
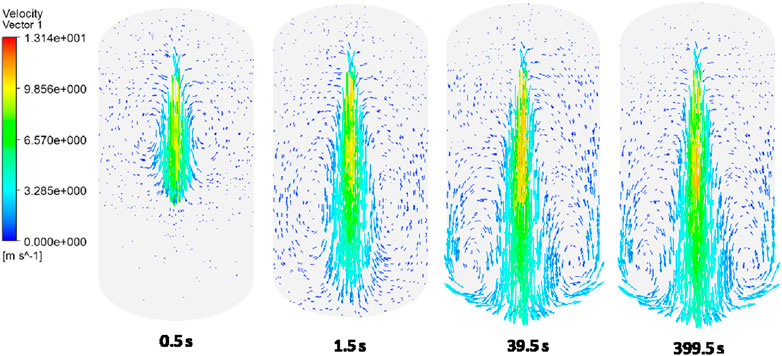
Figure 7. Velocity vector field in the vertical section of Vessel-1 (PANDA ST3_0 test).
4.3 Results for the ST3_1 test
During the ST3_1 test, the spray was injected into hot and pressurized 100% steam. This section discusses the test results for two effects of the spray injection: depressurization and gas mixing.
4.3.1 Depressurization
To analyze the spray effects on the evolutions of the global pressure and average temperature in Vessel-1, these two parameters were normalized using their initial values p0 and T0. As shown in Figures 8, 9, both the normalized pressure and temperature decayed with time. Compared with the test data, the simulation results were generally in agreement with the real evolutions; however, the simulations underestimated pressure and overestimated temperature. This is probably because the evaporation of the spray water collected in the lower head of Vessel-1 was neglected.
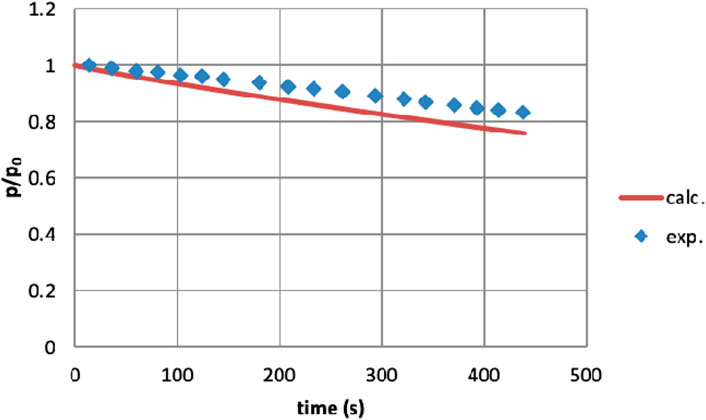
Figure 8. Pressure evolution in the vessels (PANDA ST3_1 test).
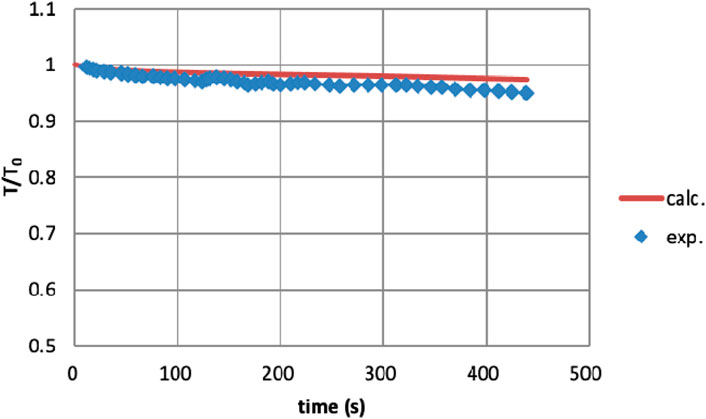
Figure 9. Temperature evolution in Vessel-1 (PANDA ST3_1 test).
Figure 10 presents the variations of the calculated temperature contours at the vertical sections of Vessel-1 and Vessel-2. During the ST3_1 test, the hottest point is located at the outlet of the spray nozzle because the droplet density is highest in this domain and steam condensation on the water droplet surface, which is a heat-loss process, heats the surrounding gas. According to temperature contours, in the region away from the spray nozzle in Vessel-1, water droplet evaporation is dominant along with heat absorption, leading to lower temperature. The temperature difference in Vessel-2 causes the cooler gas to settle at the bottom, while the warmer gas collects at the top. With time, the temperature stratification becomes clear in Vessel-2, and the average temperature of Vessel-2 is lower than that of Vessel-1.
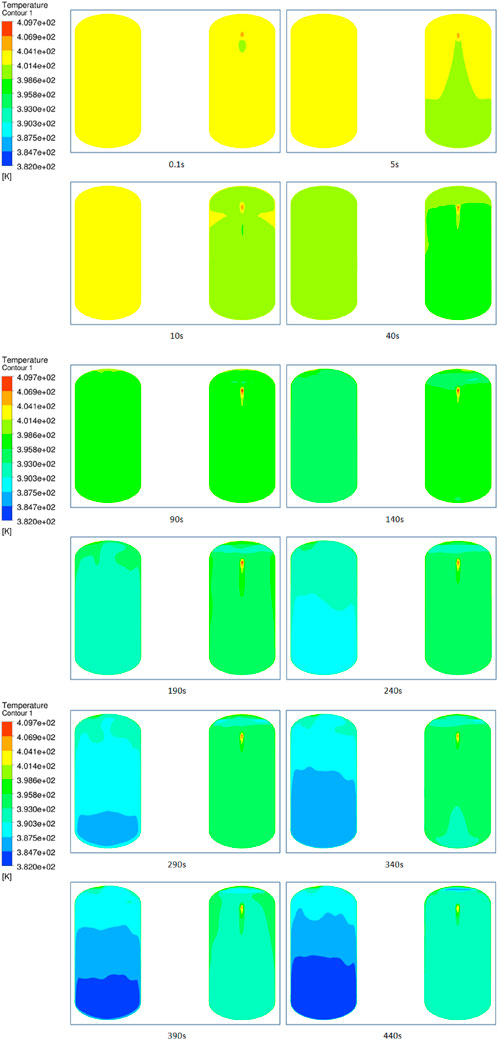
Figure 10. Temperature fields in the vertical sections of Vessel-1 and Vessel-2 (PANDA ST3_0 test, left: Vessel-2; right: Vessel-1).
4.3.2 Gas mixing
Similar to pressure and temperature, the helium concentration and gas mixture density were normalized with the initial values. Figure 11 demonstrates the time-dependent variations of the helium concentrations at some of the measurement points in Figure 1B. For Vessel-1, the numerical results are almost in agreement with the test data, except for the concentration at Point B. Similar to the simulation and experimental comparison for the ST3_0 test, a significant discrepancy is noted in the region above the spray nozzle, possibly owing to the lack of initial helium distribution. For Vessel-2, the simulation roughly follows the real trend but has differences with the test data.
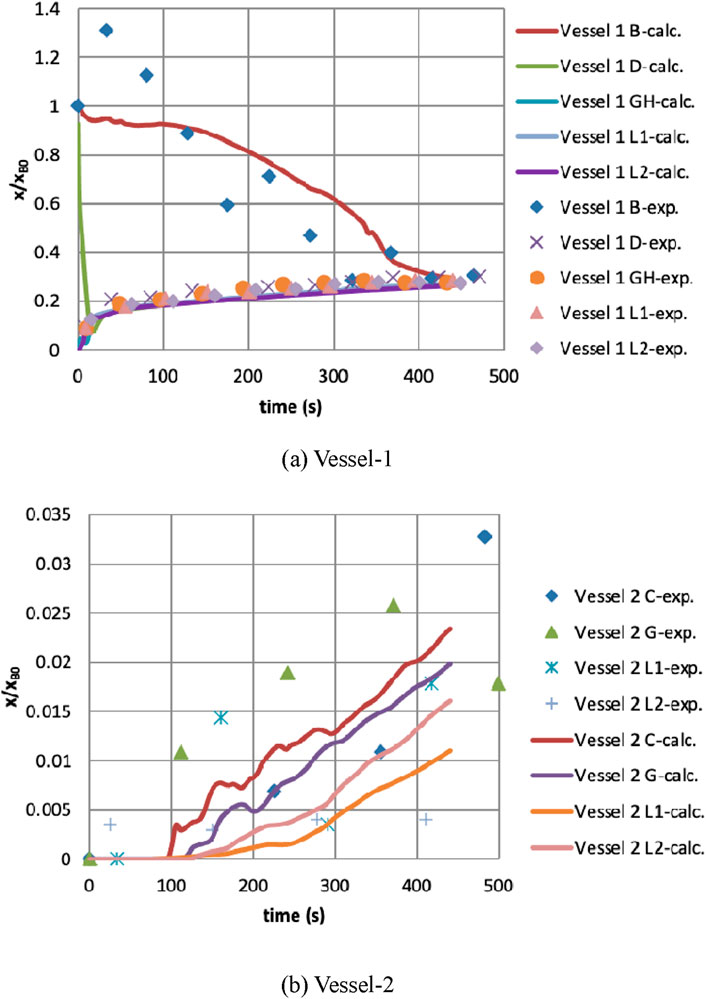
Figure 11. Time-dependent helium molar fractions (PANDA ST3_1 test) in (A) Vessel-1 and (B) Vessel-2.
Figure 12 shows the changes in the gas mixture densities in Vessel-1 and Vessel-2 over time; it can be seen that the simulation results agree with the test data. Figure 13 shows the distribution of helium molar fraction in the computational domain at different moments. Similar to the findings of the ST3_0 test, helium gas collected at the top of Vessel-1 upon spray injection is transported downward by spray entrainment, so the helium-rich layer becomes thin. Then, helium enters Vessel-2 through the IP from top to bottom and fills the entire Vessel-2.
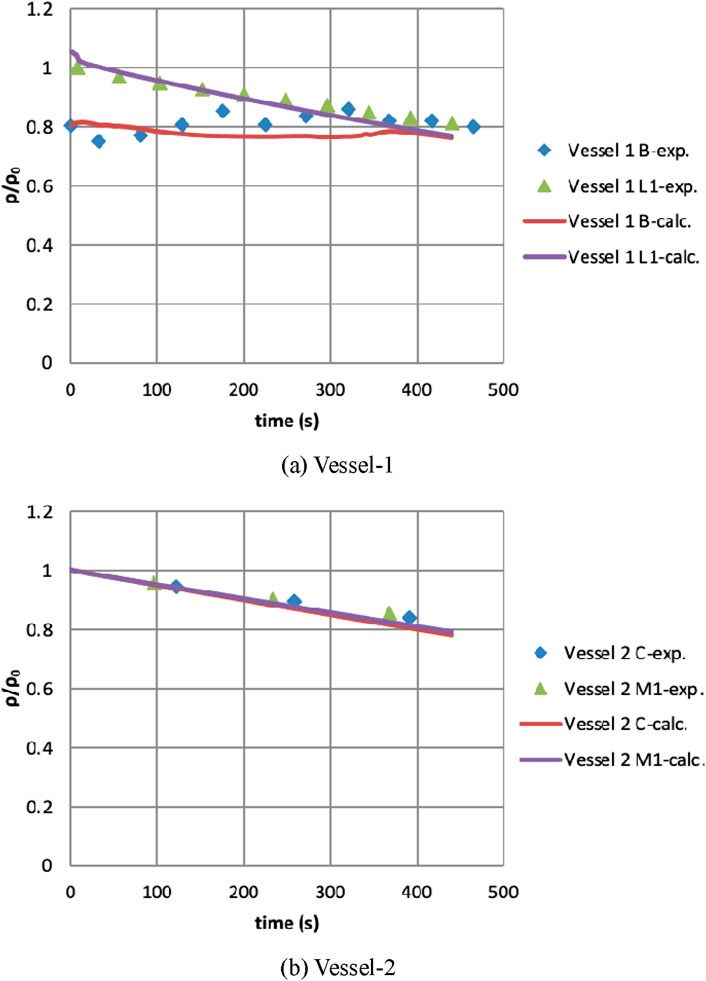
Figure 12. Gas mixture density versus time for the PANDA ST3_1 test in (A) Vessel-1 and (B) Vessel-2.
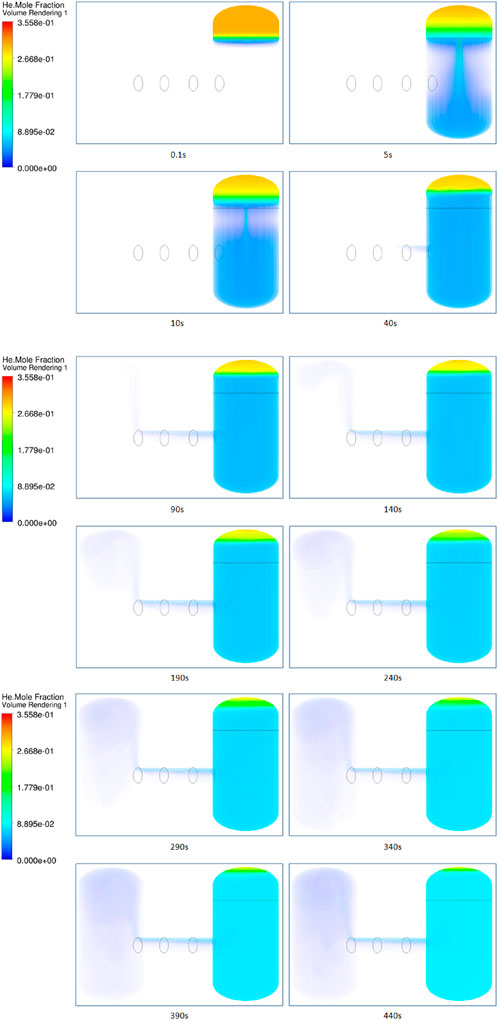
Figure 13. Helium molar fractions over time after spray activation (PANDA ST3_1 test, left: Vessel-2; right: Vessel-1).
5 Conclusion
Two spray tests were performed in the multicompartment PANDA facility with different preconditions and were also simulated; the focus here was on the effects of a spray on the atmosphere of a containment after a typical severe accident. Using an Eulerian–Lagrangian approach in ANSYS Fluent, the dispersed droplets were tracked in a Lagrangian framework for continuous gas solved using an Eulerian approach by considering two-way coupling between the droplets and gas. In particular, the mass and heat transfer models of the droplets were developed using UDFs, but the interactions between the droplets were neglected.
For the reference test ST3_0, comparisons between the simulations and experiments show that the simulation results almost agree with the test data, except for the measurement point above the spray nozzle, possibly because of the simplified initial condition for gas concentration. The simulation reproduces the gas stratification breakup processes upon spray injection and light gas transport in a multicompartment facility; helium penetrates the neighboring compartment upon spray activation.
In the simulation of the ST3_1 test, pressure is underestimated and temperature is overestimated, which is attributable to the neglect of sump re-evaporation. From the mass and heat transfer of the droplets, the calculated results show that the spray cools the entire region except for the outlet zone of the spray nozzle as heat absorption due to droplet evaporation plays a key role. Moreover, in the neighboring compartment, there is temperature stratification with spray activation. The time-dependent variations of the helium concentration calculated using the CFD code are similar to the results of the ST3_0 test. Although the simulation reproduces the real evolution of gas concentration, deviations still exist for the region above the spray nozzle.
Despite some discrepancies, there is general agreement between the simulation results and test data, showing that the proposed approach is adequately applicable to similar problems. However, further efforts are needed to improve the accuracy of the simulation, such as consideration of the detailed initial gas concentration distribution, by taking into account the sump re-evaporation.
Data availability statement
The original contributions presented in the study are included in the article/Supplementary Material; further inquiries can be directed to the corresponding authors.
Author contributions
YL: writing–original draft and writing–review and editing. XR: conceptualization, supervision, and writing–review and editing. ZW: validation and writing–review and editing.
Funding
The authors declare that financial support was received for the research, authorship, and/or publication of this article. The authors gratefully acknowledge the support by the Nature Science Foundation of Sichuan province (grant number 2024NSFSC1381) and Nuclear Power Institute of China Innovation Funding of Science and Technology (KJCX-2023-YC1-8).
Conflict of interest
The authors declare that the research was conducted in the absence of any commercial or financial relationships that could be construed as a potential conflict of interest.
Publisher’s note
All claims expressed in this article are solely those of the authors and do not necessarily represent those of their affiliated organizations, or those of the publisher, the editors, and the reviewers. Any product that may be evaluated in this article, or claim that may be made by its manufacturer, is not guaranteed or endorsed by the publisher.
Supplementary material
The Supplementary Material for this article can be found online at: https://www.frontiersin.org/articles/10.3389/fenrg.2024.1437115/full#supplementary-material
References
Babic, M., Kljenak, I., and Mavko, B. (2009). Simulations of TOSQAN containment spray tests with combined Eulerian CFD and droplet-tracking modelling. Nucl. Eng. Des. 239, 708–721. doi:10.1016/j.nucengdes.2008.12.022
Dabbene, F., Brinster, J., Abdo, D., Porcheron, E., Lemaitre, P., Mignot, G., et al. (2015). “Experimental activities on stratification and mixing of a gas mixture under the conditions of a severe accident with intervention of mitigation measures performed in the ERCOSAM-SAMARA project,” in ICAPP, Nice, France.
Erkan, N., Kapulla, R., Mignot, G., Zboray, R., and Paladino, D. (2011). Experimental investigation of spray induced gas stratification break-up and mixing in two interconnected vessels. Nucl. Eng. Des. 241, 3935–3944. doi:10.1016/j.nucengdes.2011.07.025
Malet, J., Blumenfeld, L., Arndt, S., Babic, M., Bentaib, A., Dabbene, F., et al. (2011). Sprays in containment: final results of the SARNET spray benchmark. Nucl. Eng. Des. 241, 2162–2171. doi:10.1016/j.nucengdes.2011.03.016
Malet, J., Laissac, R., Bentaib, A., Lemaitre, P., and Porcheron, E. (2015b). “Synthesis of stratification and mixing of a gas mixture under severe accident conditions with intervention of mitigating measures,” in ICAPP 2015, Nice, France, May 3–6, 2015 (Acropolis Congress Center).
Malet, J., and Huang, X. (2015). Influence of spray characteristics on local light gas mixing in nuclear containment reactor applications. Comput. and Fluids 107, 11–24. doi:10.1016/j.compfluid.2014.10.002
Malet, J., Mimouni, S., Manzini, G., Xiao, J., Vyskocil, L., Siccama, N. B., et al. (2015a). Gas entrainment by one single French PWR spray, SARNET-2 spray benchmark. Nucl. Eng. Des. 282, 44–53. doi:10.1016/j.nucengdes.2014.12.008
Malet, J., Parduba, Z., Mimouni, S., and Travis, J. (2014). Achievements of spray activities in nuclear reactor containments during the last decade. Ann. Nucl. Energy 74, 134–142. doi:10.1016/j.anucene.2014.05.033
Mimouni, S., Baudry, C., Douce, A., Guingo, M., Hassanaly, M., Lavieville, J., et al. (2013). “Modelling of sprays in a multi-compartment geometry with a CMFD code,” in NURETH15, Pisa, Italy.
Morsi, S. A., and Alexander, A. J. (1972). An investigation of particle trajectories in two-phase flow systems. J. Fluid Mech. 55 (2), 193–208. doi:10.1017/s0022112072001806
Ranz, W. E., and Marshall, W. R., Vaporation from drops, Part I and Part II, Chem. Eng. Prog., 48(4): 173–180.
Sazhin, S. S. (2006). Advanced models of fuel droplet heating and evaporation. Prog. Energy Combust. Sci. 32, 162–214. doi:10.1016/j.pecs.2005.11.001
Keywords: containment spray, depressurization, mixing, Eulerian–Lagrangian approach, computational fluid dynamics simulation
Citation: Lu Y, Ran X and Wei Z (2024) Computational fluid dynamics simulations of spray tests in a multicompartment construction with an Eulerian–Lagrangian approach. Front. Energy Res. 12:1437115. doi: 10.3389/fenrg.2024.1437115
Received: 23 May 2024; Accepted: 19 September 2024;
Published: 10 October 2024.
Edited by:
Jiankai Yu, Massachusetts Institute of Technology, United StatesReviewed by:
Wei Li, Xi’an Jiaotong University, ChinaIvo Kljenak, Institut Jožef Stefan (IJS), Slovenia
Copyright © 2024 Lu, Ran and Wei. This is an open-access article distributed under the terms of the Creative Commons Attribution License (CC BY). The use, distribution or reproduction in other forums is permitted, provided the original author(s) and the copyright owner(s) are credited and that the original publication in this journal is cited, in accordance with accepted academic practice. No use, distribution or reproduction is permitted which does not comply with these terms.
*Correspondence: Yazhe Lu, bHV5ejA3QGZveG1haWwuY29t; Xu Ran, cGVhY2VyYW5AMTYzLmNvbQ==