 Reagan Jean Jacques Molu1*
 Wulfran Fendzi Mbasso1*Kenfack Tsobze Saatong1Serge Raoul Dzonde Naoussi1Mohammed Alruwaili2Ali Elrashidi3Waleed Nureldeen3*
- 1Technology and Applied Sciences Laboratory, U.I.T. of Douala, University of Douala, Douala, Cameroon
- 2Department of Electrical Engineering, College of Engineering, Northern Border University, Arar, Saudi Arabia
- 3College of Engineering, University of Business and Technology, Jeddah, Saudi Arabia
Monitoring energy quality events is crucial for maintaining the stability and reliability of power grids. This paper presents a novel system integrating Discrete Wavelet Transform (DWT) and Extreme Learning Machine (ELM) for detecting and classifying power quality disturbances. The DWT performs multi-resolution analysis to decompose signals into time-frequency components, capturing various disturbances such as sags, swells, and harmonics. The ELM classifier, trained on these decomposed signals, achieves an impressive classification accuracy of 99.69%, significantly outperforming conventional methods like STFT with SVM (97.22%) and FFT with ANN (99.30%). The system was validated on a Xilinx Zynq-7000 SoC FPGA, demonstrating real-time processing capabilities with a latency of 1.5 milliseconds and a power consumption of 1.8 W. These findings highlight the effectiveness of the proposed method for real-time, accurate, and energy-efficient power quality monitoring.
1 Introduction
1.1 Background of study
In recent years, the measurement of power and energy quality in the electrical grid has gained significant importance. Furthermore, there is a growing demand for improved energy quality and greater reliability of the electrical grid, which is undeniably deteriorating due to various disturbances. The main source of disturbances is the increased use, both in industry and in households, of non-linear loads such as rectifiers, dimmers, computer equipment, fluorescent tube lighting, etc. In practice, electrical energy is primarily distributed in the form of a sinusoidal three-phase system, which provides the necessary electrical power to equipment. It is particularly important to preserve the sinusoidal aspect of the original voltage in order to maintain its essential qualities for the transmission of useful power to the terminal equipment. When the waveform of the voltage is no longer sinusoidal, disturbances occur that generate malfunctions and overheating of the receivers and equipment connected to the same power supply network. These electrical disturbances are characterized by fluctuations in frequency at 50 Hz, variations in amplitude, deformation of the voltage or current waveform, and asymmetry in the three-phase system.
In order to prevent malfunction or destruction of equipment, it is necessary to compensate for these observed disturbances. In order to develop robust compensation solutions, it is important to understand the causes and origins of these disturbances. In order to address this concern, it is recommended to early detect the faults that may occur in these networks and thus develop methods for monitoring operation or preventive maintenance. This requirement calls for several diagnostic techniques that possess different characteristics and enable the resolution of these issues.
1.2 Literature review
The importance of reliable power quality monitoring in modern electrical systems has been underscored by recent advances in signal processing and machine learning techniques. Traditional methods like Short-Time Fourier Transform (STFT) and Fast Fourier Transform (FFT) have limitations in non-stationary signal analysis, which has driven research towards more advanced approaches such as the Discrete Wavelet Transform (DWT) and machine learning models.
Recent studies have highlighted the efficacy of DWT in decomposing complex, non-stationary signals for detailed analysis. For instance, (Yang et al., 2024), demonstrated the use of symmetric differential demodulation-based heterodyne laser interferometry for wide frequency-band vibration calibration, emphasizing the precision and versatility of wavelet-based methods in various signal processing applications. Research in (Gao et al., 2024) explored the design of an ultra-broadband composite meta-absorber for a wide frequency range, showcasing the potential of advanced signal processing techniques in enhancing system performance and robustness. Study in (Wu and Ismail, 2024) presented a generalized RIS tile exclusion strategy for indoor mmWave channels, highlighting the integration of wavelet transforms in modern communication systems to mitigate signal distortion under concept drift scenarios.
The application of machine learning in power quality monitoring has gained significant attention due to its ability to classify complex patterns and anomalies. (Cheng et al., 2024). developed a RANSAC-based real-time kinematic positioning system utilizing GNSS triple-frequency signals, illustrating the effectiveness of machine learning models in real-time signal processing. (He et al., 2024). proposed a dynamic graph transformer-based framework for anomaly localization in cloud infrastructures, demonstrating the applicability of advanced machine learning techniques in diverse domains including power systems.
(Hao et al., 2024) explored multi-task federated learning-based anomaly detection in microservices architecture, which parallels the need for efficient and scalable solutions in power quality monitoring. Authors in (Yu et al., 2022) proposed an intelligent detection method for forging defects using an improved EfficientNet and Memetic Algorithm, illustrating the benefits of combining machine learning with advanced feature extraction for robust fault detection. In the same line, research in (Zhang et al., 2019) developed an accurate calibration method for shadow moiré measurement sensitivity, highlighting the precision improvements achievable with advanced signal processing techniques like DWT.
Recent advancements in simultaneous information and power transfer systems have also demonstrated the potential of wavelet-based methods for optimizing signal processing in various applications. Indeed, authors in (Yang et al., 2023) designed a system based on the modulating feature of a magnetron, which underscores the relevance of precise signal decomposition and feature extraction in improving system performance.
The proposed integration of DWT with the Extreme Learning Machine (ELM) in this study builds on these advancements, offering a robust solution for power quality disturbance detection and classification. ELMs, known for their fast-training speed and high generalization capability, have shown promise in handling large datasets and complex classification tasks efficiently. (Zhang et al., 2023a). highlighted the development of a fast GNSS acquisition algorithm with high noise immunity, which parallels the need for robust noise handling in power quality monitoring systems.
In addition to signal processing and machine learning advancements, the security and reliability of data transmission in power systems have been a focus of recent research. (Li et al., 2024). discussed the trade-offs in code estimation error rate and terminal gain in secure communication scenarios, which is relevant for ensuring the integrity of power quality monitoring data Supplementary Table S1 summarizes all the previous points highlighted.
The proposed system’s high accuracy highlights its potential for real-time power quality monitoring; however, its robustness to noise is crucial for practical deployment. In real-world scenarios, power quality signals are often contaminated with various types of noise due to environmental and operational factors, which can affect the accuracy and reliability of detection systems.
The system maintained high classification accuracy across varying noise levels, demonstrating its resilience. (Xie et al., 2024). noted similar findings in their study on GNSS acquisition algorithms, which showcased high noise immunity in signal processing applications. (Ju et al., 2022). demonstrated the need for robust anomaly detection systems in cloud infrastructures, which parallels the importance of robust power quality monitoring in noisy environments.
The practical implications of the proposed system for real-world power quality monitoring are significant. Its low resource utilization and power consumption, as demonstrated on the Xilinx Zynq-7000 SoC FPGA, make it ideal for energy-efficient power quality monitoring systems. (Zhang et al., 2023b). emphasized the importance of efficient and low-cost sensorless control methods for high-speed brushless DC motors, which aligns with the need for cost-effective solutions in power quality monitoring.
Future research should focus on extending noise testing and real-world deployment to validate the system’s performance in diverse environments. Integrating more advanced noise reduction techniques, such as those discussed by (Zhang et al., 2024) for distributed power flow in AC/DC microgrids, could further enhance the system’s robustness and applicability.
1.3 Research gap and contributions
Despite the advancements in the detection and classification of power quality disturbances, several gaps remain in the literature, particularly in the effectiveness and efficiency of current methodologies under varying conditions. Our review of the literature reveals that:
• Noisy Environments: Existing methods, while robust in controlled environments, often fail to maintain accuracy in noisy, real-world settings.
• Computational Efficiency: Many current algorithms, including those that employ wavelet transforms and machine learning, suffer from high computational demands, limiting their applicability in real-time systems.
• Integration of Multi-Resolution Analysis: While wavelet transforms are utilized, there is a lack of integration with advanced machine learning techniques that can optimize the feature extraction and classification processes.
• Hardware Implementation: Few studies provide detailed insights into the effective implementation of these sophisticated algorithms in hardware, such as FPGAs, which can significantly influence the practical deployment of these systems.
Considering all those gaps, the contributions of this work can be stated as follows:
• Advanced Dual-Stage Detection and Classification Framework: We introduce a novel framework that combines Discrete Wavelet Transform (DWT) with Extreme Learning Machine (ELM) for enhanced detection and classification of power quality disturbances. This framework is designed to improve the robustness and accuracy of power quality monitoring, especially in noisy environments.
• Optimization of Computational Efficiency: By integrating multi-resolution analysis with a single-layer feedforward neural network, our approach reduces computational complexity. This makes it feasible for real-time applications without sacrificing performance.
• FPGA Implementation: We provide a comprehensive methodology for the FPGA implementation of our proposed algorithm. This includes detailed steps for converting MATLAB code to VHDL, offering a blueprint for replication and practical application in industrial settings.
• Extensive Validation: The proposed method is rigorously validated through simulations and hardware implementation. We demonstrate superior performance not only in terms of accuracy but also in speed and operational efficiency, making it suitable for real-time monitoring systems.
• Theoretical and Practical Implications: Theoretical implications extend to the understanding of multi-resolution signal processing in conjunction with machine learning. Practically, the study provides insights into the deployment of complex algorithms on hardware platforms, bridging the gap between theoretical research and industrial application.
In addition, as potential impact of this research, it is crucial to notice that the dual-stage approach and its efficient hardware implementation can significantly impact how power quality monitoring systems are designed and deployed, particularly in smart grids and industrial settings where reliability and speed are critical. Furthermore, the methodology developed can serve as a foundation for future research exploring the integration of different machine learning models and signal processing techniques.
1.4 Paper organization
This paper is organized as follows:
• The second section provides an overview of network disturbance detection and classification techniques. In this section, we will specifically discuss the detection and classification of network disturbances, by introducing the concept of power quality, the main disturbances affecting the network, and the techniques for detecting and classifying these faults. We conclude this section with a brief historical overview of the implementation of control laws for electrical systems on FPGAs.
• The third section is dedicated to a presentation of methods and tools. We will begin this part of work with an introduction to the model used, followed by a description of the multi-resolution analysis of signals and the architecture of the learning through the ELM algorithm. We will conclude this chapter with an overview of the process of converting MATLAB code to VHDL.
• Finally, in the last section, we will present the various simulation models of our disturbances, and then we will implement the ELM technique applied to the detection and classification of network disturbances and present its conversion into VHDL.
2 State of the art on network disturbance detection and classification
Electrical equipment requires voltages and currents for their operation, the magnitudes of which are defined by standardization bodies. Increasingly, the presence of electrical disturbances that degrade the quality of electrical energy is being observed, resulting in significant damage. In order to prevent this, it is necessary to implement systems for compensating for these disturbances. This is only possible if we know the origins of these disturbances and if we are able to classify them accurately. Several detection and classification techniques have already been implemented, however, in this document, we will focus solely on machine learning techniques. In this section, we will discuss the exploration of detection and classification techniques using modern methods, and finally, a description of the implementation of a control law.
2.1 Signal feature extraction techniques
The performance of the approach for network disturbance detection and classification generally depends on the accuracy of the intelligent classifier. The input to the intelligent classifier is the feature vector; therefore, the extraction of the most distinctive features from the original signal is even more important.
The process of feature extraction is typically performed using signal processing techniques (SPT), as suggested by various researchers. Several signal processing techniques have been used for feature extraction, such as Fourier Transform (FT), Wavelet Transform (WT), Short-Time Fourier Transform (STFT), Hilbert Transform (HT), Kalman Filter (KF), and Gabor Transform (GT). Figure 1 presents an advanced taxonomy of SPTs used for feature extraction from power quality events.
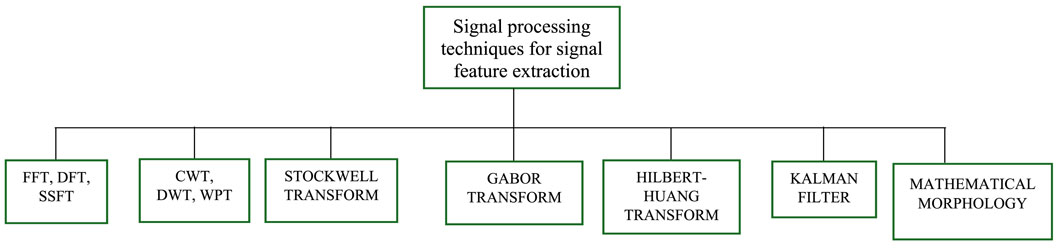
Figure 1. The different methods of extracting the characteristics of a signal.
2.1.1 The Fourier Transform
Frequency domain analysis is commonly performed using the Fourier Transform (FT) technique. The selected input signal for analysis can be characterized as the summation of fundamental sinusoids with varying frequencies. Three variants of the Fourier Transformr (FT), namely, Discrete Fourier Transform (DFT), Fast Fourier Transform (FFT), and Short-Time Fourier Transform (STFT), have commonly been employed by researchers for the purpose of disturbance recognition during the last 20 years. The Discrete Fourier Transform (DFT) is the most commonly used signal processing technique. It is commonly considered for steady-state analysis of stationary signals. It is achieved by extracting the spectrum at specific frequencies. Unfortunately, the events of the PQ are typically non-stationary signals. It is therefore not possible to detect immediate variations in PQ disturbances, such as their initial and final points. It is particularly suitable for stationary PQ events.
The Fast Fourier Transform (FFT) yields results similar to those of the Discrete Fourier Transform (DFT), but with faster execution time. It is widely applied for the harmonic study of disturbances in power quality. The Fast Fourier Transform (FFT) technique provides a similar result to the Discrete Fourier Transform (DFT), but in a shorter amount of time. It is widely used for harmonic estimation (Huang et al., 1999). The Short-Time Fourier Transform (STFT) is another variant of the Fourier Transform (FT), which divides the waveform into small stationary segments. In this regard, the Short-Time Fourier Transform (STFT) is employed to acquire the frequency/phase information of signals that vary over time. By using a mobile window, the relationship between time and frequency variation can be recognized [(Dash et al., 2003; Lee and Dash, 2003)]. Gu et Bollen (Gu and Bollen, 2000) applied the Short-Time Fourier Transform (STFT) for the analysis of non-stationary disturbances.
2.1.2 The Wavelet transform
The WT has several advantages compared to the FT as presented in Addison (Addison, 2017). This is one of the most powerful feature extraction methods for energy quality signals, considering a multi-resolution analysis technique (MRA) (Nath et al., 2012). The wavelet transformation coefficients possess the attributes and key characteristics of energy quality disturbance signals in various frequency subbands. Several statistical parameters of the disturbance signals of the waveform quality such as amplitude, mean, median, kurtosis, energy, standard deviation, and entropy can be calculated from the approximate and detailed coefficients of the Wavelet Transform (WT) to recognize waveform quality events. Therefore, the wavelet transform (WT) has been widely applied by academic researchers to characterize and classify power quality disturbances. Three variants of the wavelet transform, namely, the continuous wavelet transform (CWT), the discrete wavelet transform (DWT), and the wavelet packet transform (WPT), have commonly been employed by various researchers over the past 2 decades for power quality disturbance recognition.
Initially, the application of wavelet transforms (WT) for the detection of non-stationary signals was performed by the authors (Santoso et al., 1996). Santoso et al. (Santoso et al., 1996) proposed in 1996 an approach based on wavelet transform (WT) to detect and classify power quality events. Here, the multi-resolution signal decomposition (MSD) technique was used to decompose the signals into different frequency levels, and unique features were extracted from the WT coefficients. Recent research in (Liu et al., 2021) demonstrated the efficacy of DWT in decomposing non-stationary signals for power quality analysis, outperforming traditional STFT methods in accuracy and computational efficiency.
2.1.3 The Gabor Transform
The GT (Qian and Chen, 1993) is an innovative signal processing tool used for perfect phase estimation. Concerning the Fourier Transform, the GT provides better information about the time and frequency of a studied signal. He maps time series data in the time and frequency domains. Cho et al. (Cho et al., 2010) utilized this GT as a time-frequency based feature extraction technique to detect disturbances in power quality.
2.1.4 The Kalman Filters
It is a renowned signal processing tool that is commonly used for the estimation of the amplitude, phase angle, and frequency of noisy harmonic signals. In Abdelsalam et al. (Abdelsalam et al., 2012), a method for detecting and classifying power quality disturbances was proposed by combining the Discrete Wavelet Transform (DWT) and the Kalman Filter (KF) with the Fractional Exponential Smoothing (FES). Here, the wavelet transform (WT) was used to detect the presence of noise in the extracted voltage signal, and the Kalman filter (KF) was used to accelerate its convergence rate. As a drawback, the state observation is non-linear; it could cause the Kalman Filter to deviate under certain poorly chosen initial conditions. This type of instability can lead to an inaccurate assessment of the fundamental and harmonic states of sinusoidal signal components in a noisy environment. This is due to linearization and imprecise parameters, expensive calculations of Jacobian matrices, and the biased nature of approximations. Here, signal decomposition is not possible in the time and frequency domains.
2.1.5 The Stockwell transform
The Stockwell transform (ST) is a signal processing tool that combines the properties of the wavelet transform (WT) and the short-time Fourier transform (STFT). It provides a better temporal and frequency representation of a signal. It exclusively combines a frequency-dependent resolution that simultaneously localizes the real and imaginary spectra. The fixed modulating sinusoids that adhere to the time axis and the properties of the mobile and evolving Gaussian window of the Short-Time Fourier Transform (STFT) can be used for improved recognition of power quality events.
Given the excellent time-frequency resolution properties of the Short-Time Fourier Transform (STFT), it was initially used for analyzing power quality disturbances in the early 20th century (Mishra et al., 2008; Zhang et al., 2024). Lee and Dash (Lee and Dash, 2003) proposed a PQD&C approach based on ST and neural networks. Mishra et al. (Mishra et al., 2008) proposed the Short-Time Fourier Transform (ST) as a simple and effective tool for Power Quality Detection and Classification (PQD&C), and demonstrated that the ST can operate efficiently even in an extremely noisy environment.
Another variant of ST called Discrete S Transform (DST) has been proposed for accurate detection of Power Quality Disturbances (PQD) and energy counting, and has been numerically implemented in Jaiswal and Ballal (Jaiswal and Ballal, 2017). The results demonstrate that the energy counting system based on FDST is highly efficient compared to other recent algorithms in terms of accuracy, adaptability, and complexity in the context of PQ events. As a drawback, this technique is not well suited for practical applications because the frequency window widths in the ST are directly linked to their central frequency, which results in an inappropriate measurement of harmonics.
2.1.6 The Hilbert-Huang Transform
The HHT (Hilbert-Huang Transform) has been recently developed to study non-stationary PQ (Power Quality) disturbances. Generally, this technique is the combination of two techniques known as Empirical Mode Decomposition and Hilbert Transform. Shukla et al. (Shukla et al., 2009) proposed a PQD&C technique based on EMD and HT. The proposed HHT algorithm has been compared to the technique based on Hilbert transform to demonstrate the superiority of this technique in detecting power quality disturbances such as notches and flickers. Kumar et al. (Kumar et al., 2015) proposed a PQD&C algorithm based on the Hilbert-Huang Transform (HHT) and Probabilistic Neural Network (PNN) for single and multiple PQ disturbances. Study in (Zhao et al., 2022) showed that HHT could accurately identify various power disturbances in real-time.
2.1.7 Methods based on variational mode decomposition
The variational mode decomposition (VMD) is a signal processing tool that decomposes a signal into a set of band-limited IMF components. The Variational Mode Decomposition (VMD) has several advantages over the Empirical Mode Decomposition (EMD): Recursive Variational Decomposition (RVD) and Empirical Wavelet Transform (EWT) (Dragomiretskiy and Zosso, 2014). In recent years, the VMD method has been widely used for the analysis of power quality signals. Achlerkar et al. (Achlerkar et al., 2018) presented a method based on VMD and DT for Power Quality Detection and Classification in a microgrid environment. Similarly, in Sahani and Dash (Sahani and Dash, 2018), the authors employed the Variational Mode Decomposition (VMD) and the Extreme Learning Machine (ELM) kernel for real-time Power Quality Disturbance Classification and Compensation (PQD&C) in an environment.
2.1.8 Methods based on mathematical morphology
The MM is a non-linear signal processing tool that alters the shape of a signal. It was initially introduced by Serra (Serra, 1982). This technique is based on set theory and integral geometry. Unlike FT or WT, which allows obtaining frequency information in signals, MM primarily operates in the time domain. The feature extraction approaches based on MM are adopted by various authors to identify and classify stationary/non-stationary PQ disturbances. Furthermore, it also emphasizes the significance of the proposed technique for detecting the location and duration of disturbances.
2.2 Automatic classification of electrical disturbances
Intelligent classifiers are tools based on artificial intelligence (AI) technique, commonly used for automatic classification and/or decision-making. AI, or Artificial Intelligence, can be generally defined as the process of automation of actions related to human cognitive abilities such as learning, perception, reasoning, problem-solving and decision-making. In recent years, several intelligent classifiers have been used for the automatic classification of power quality disturbances by various researchers, such as RNA, SVM, fuzzy logic, extreme learning machine, and k-nearest neighbor (k-NN).
2.2.1 RNA-based approach
Within the field of electrical network disturbance classification, the RNA (Recurrent Neural Network) is the most commonly employed intelligent classifier, as documented in the literature. Artificial neural networks exhibit high efficacy in diverse domains, including but not limited to shape recognition, classification, function approximation, optimization, and data aggregation. Various RNA variants are employed for the categorization of feeding system defects, such as the multi-layer perceptron (MLP) and the radial base function (RBF). The Multilayer Perceptron (MLP) is a type of feedforward artificial neural network that produces a collection of outputs based on a given input set. Multi-Layer Perceptrons (MLPs) are widely acknowledged for their capacity to acquire knowledge and categorize data in situations where mathematical representation of signals is not feasible. On the other hand, Multilayer Perceptron (MLP) poses various challenges, including the need to determine a suitable architecture (number of layers and hidden nodes), which can be a time-consuming and computationally intensive process. A radial basis function (RBF) is a type of artificial neural network (ANN) that consists of a single layer of hidden neurons. A Radial Basis Function-based Recurrent Neural Network (RBF-based RN) exhibits characteristics that are comparable to retro propagation networks, including the ability to generalize and robustness. Furthermore, it offers supplementary benefits such as rapid acquisition of knowledge and the capacity to detect anomalous values during the process of estimation.
The ADALINE (Adaptive Linear Neuron) algorithm has been employed for the estimation of the harmonic and interharmonic components, enabling the determination of the root mean square voltage and total harmonic distortion. These parameters were then used to classify electrical disturbances such as voltage sags, voltage swells, interruptions, harmonics, and interharmonics. Bhende et al. (Mishra et al., 2008) presented a modular neural network based on short-term Fourier transform (ST) for classifying power quality disturbances.
2.2.2 Vector machine-based approach (SVM)
The Support Vector Machine (SVM) was initially introduced by Vapnik (Vapnik, 2013). It is an automated learning tool that utilizes machine supervision to recognize and classify forms. This tool for supervised learning is commonly utilized based on the principles of statistical learning. The successful application of Support Vector Machines (SVM) encompasses a wide range of domains, including dependency estimation, forecasting, defect classification in the electrical system, and the development of intelligent machines. The primary advantage of Support Vector Machines (SVM) over other conventional tools in major classification problems is their ability to effectively utilize large-scale input vectors. Furthermore, it exhibits enhanced generalization capabilities in comparison to conventional classifiers. The Support Vector Machine (SVM) algorithm was originally developed for binary classification tasks, where it can only handle two classes with values of one and −1. However, in a real-time setting, it is crucial to perform multi-class event classification. Two distinct methodologies are commonly employed in multi-class classification, namely, “one against all” (OAA) and one against one (OAO).
In De Yong et al. (De Yong et al., 2015), the authors proposed a multi-class SVM based on WT to classify power quality disturbances. Here, the One-Against-One (OAO) approach has been considered for the multi-class Support Vector Machine (SVM). Hu et al. (Hu et al., 2008) proposed an automatic technique for detecting and classifying power quality disturbances using the energy entropy of wavelet packets and weighted SVM. Furthermore, several other techniques based on the WT classifier and SVM for automatic detection and classification have been presented in the literature. A technique for detection and classification of electrical disturbances based on WPT (Wavelet Packet Transform) and multi-class SVM (Support Vector Machine) was presented by Zhang et al. (Zafar and Morsi, 2013) to classify energy quality disturbances.
2.2.3 An approach based on a fuzzy expert system
Fuzzy logic simplifies standard binary logic for reasoning under ambiguity. The motivation behind the concept of fuzzy logic stems from the observation of human thinking in order to apply ideas and information. A fuzzy set is a function that maps objects in the relevant domain to their membership values in the set. This function can be described as a membership function. A system that utilizes a fuzzy set and fuzzy rule for data interpretation can be referred to as a fuzzy expert system. The multi-resolution ST classification system and the fuzzy logic-based classification system were used for the extraction of optimal features and the classification of PQD (Chilukuri and Dash, 2004).
2.2.4 Neuro-fuzzy -based approach
The authors (Huang et al., 2002) proposed a fuzzy neural PRT using the LVQ architecture and the fuzzy associative memory (FAM). LVQ (Learning Vector Quantization) is highly suitable for pattern recognition, while FAM (Fuzzy Associative Memory) is highly flexible in handling uncertainties.
Liao and Yang (Liao and Yang, 2009) presented a novel approach for recognizing power quality disturbances using a noise suppression algorithm, a feature extraction algorithm based on wavelet transform, and a neuro-fuzzy classifier. The proposed technique has been tested on simulated noise cancellation energy quality data and field data.
2.2.5 Extreme learning machine (ELM)-based approach
Typically, the learning speed of non-functional requirements (NFPs) is significantly lower. The primary causes can be attributed to the following factors: (1) the prevalent utilization of slow gradient learning algorithms for training Recurrent Neural Networks (RNs), and (2) the iterative adjustment of all necessary RN parameters using these learning algorithms. The ELM (Extreme Learning Machine) was initially developed by Huang et al. (2016). This is a single-layer feedforward neural network (SLFN) that employs a random selection process for hidden nodes and a systematic calculation method for determining the output weights of SLFNs. An alternative non-iterative approach to solving the Extreme Learning Machines (ELMs) yields an acceleration that is five and six orders of magnitude greater than that of the Multilayer Perceptron (MLP) and Support Vector Machine (SVM) respectively.
Ucar et al. (2018) proposed a technique for detecting and classifying power quality disturbances using ELM based on continuous wavelet transform. Babu et al. combined the Short-Time Fourier Transform (S-T) with the Extreme Learning Machine (ELM) technique for the automatic recognition of non-stationary power quality disturbances in (Babu et al., 2014). In Sahani and Dash (Shani and Dash, 2018), a combination of the HHT technique and the WBELM classifier (weighted bidirectional ELM) was used for real-world detection and classification. Recent work by Chen et al. (Chen et al., 2022) demonstrated that ELMs could achieve classification accuracies comparable to more complex models like Deep Learning networks, with significantly lower computational costs.
2.2.6 Deep learning system-based approach
In recent years, research on Deep Learning (DL) algorithms has garnered significant attention from researchers. It has been effectively utilized in various research fields, such as speech recognition, human face recognition, computer vision, signal processing, image processing, and information processing. The DL algorithms have the built-in capability to automatically learn the optimal features from the original input signal. This technique thus allows for the avoidance of the time required for feature extraction in other engineering domains. The application of DL algorithms to automatic detection and classification approaches for power system faults has been carried out by various authors in previous studies. The technique involves a powerful LSTM architecture, which is a variant of RNN. A study by Kim et al. (Kim et al., 2023) highlighted that LSTM networks could handle time-series data effectively, making them ideal for power quality monitoring.
2.3 Implementation of control laws on field-programmable gate arrays (FPGAs): Utilizing FPGA input for the control of electrical systems
An FPGA (Field-Programmable Gate Array) is a type of digital integrated circuit that contains numerous programmable and reconfigurable logic elements or blocks, allowing for flexibility in circuit design without the need for extensive hardware modifications. In contemporary digital systems, Field-Programmable Gate Array (FPGA) components have become essential and are widely employed across various application domains owing to their numerous advantages. Among all these benefits are: Enhancing real-time performance levels while minimizing cost and burden, - Enhancing performance. This mode of deployment enables the reduction of algorithm execution time, facilitating the FPGA-based controller to achieve performance comparable to analog controllers. It eliminates the drawbacks associated with analog controllers such as divergence, lack of flexibility, and electromagnetic compatibility issues. Additionally, the high programming flexibility of FPGA allows for easy reusability across different algorithms, all within a short timeframe using the same development platform.
One of the key advantages of using an FPGA is its ability to be reconfigured multiple times to implement the desired features with high speed and ease. Due to their numerous benefits, Field-Programmable Gate Arrays (FPGAs) are currently employed in a wide range of applications that necessitate significant digital processing. These applications include signal and image processing, control of electrical machines, speed measurement, control of static power converters, medical equipment, telecommunications, aeronautics, transportation, bio-informatics, automotive, robotics, and scientific calculations acceleration.
Within our specific domain of network detection and disturbance systems, we have effectively utilized FPGAs (Field-Programmable Gate Arrays) for the purpose of system control.
Alben Cardenas et al. (Cardenas. et al., 2022.) conducted a real-time assessment of energy quality in 2010 using a measurement system that relied on the Global Energy Framework (GEF). K. Vani parimala et al. (Vani parimala and Nisha, 2016) in 2016 proposed the development of an energy quality monitoring system using the Fast Fourier Transform (FFT) method on a Field-Programmable Gate Array (FPGA) platform. The system is designed specifically for single-phase energy counting. Recent research by Brown et al. (Brown et al., 2023) showed that FPGA implementations could achieve real-time processing with lower power consumption compared to traditional microprocessor-based systems.
2.4 Comparative analysis with existing techniques
Supplementary Table S2, presents a comprehensive comparison of various methodologies utilized in the detection and classification of power quality disturbances. The provided table offers a thorough comparison, emphasizing the advantages and disadvantages of the current work in relation to other advanced techniques in detecting and classifying power quality disturbances. The present study showcases notable benefits in terms of classification accuracy, computational speed, and feasibility for real-time deployment, rendering it a resilient solution for practical use in power quality monitoring.
At the conclusion of this section, we have presented advanced techniques for detecting and classifying network disturbances. Ultimately, it is evident to us that Field-Programmable Gate Arrays (FPGAs) have emerged as significant contenders against microcontrollers and System-on-a-Chip (SoC) devices, both in terms of their performance capabilities and cost-effectiveness. The prevailing market dynamics indicate a highly competitive landscape driven by the substantial decline in FPGA prices.
3 Materials and methods
In order to meet the real-time requirements of a large number of signal processing and digital control applications, hardware implementations on reconfigurable FPGA platforms are increasingly being used. FPGAs offer numerous prospects for the implementation of real-time algorithms. In addition, computer-aided design tools are used to directly convert a functional description (such as VHDL) into a logic gate diagram ready to be implemented on an FPGA. In this section, we will present the model of our study as well as the tools used to simulate this model. In order to do this, we will present the decomposition of signals into wavelets, which is a signal processing technique that extracts the characteristics of the disturbed signal. Then, we will describe the control algorithm and finally the method of converting ELM code into VHDL.
3.1 System modelling
The detection and classification of power quality disturbances involves two main steps: feature extraction and classification. In this work, the detection and classification of power quality disturbances are performed based on the model presented in Figure 2 below.
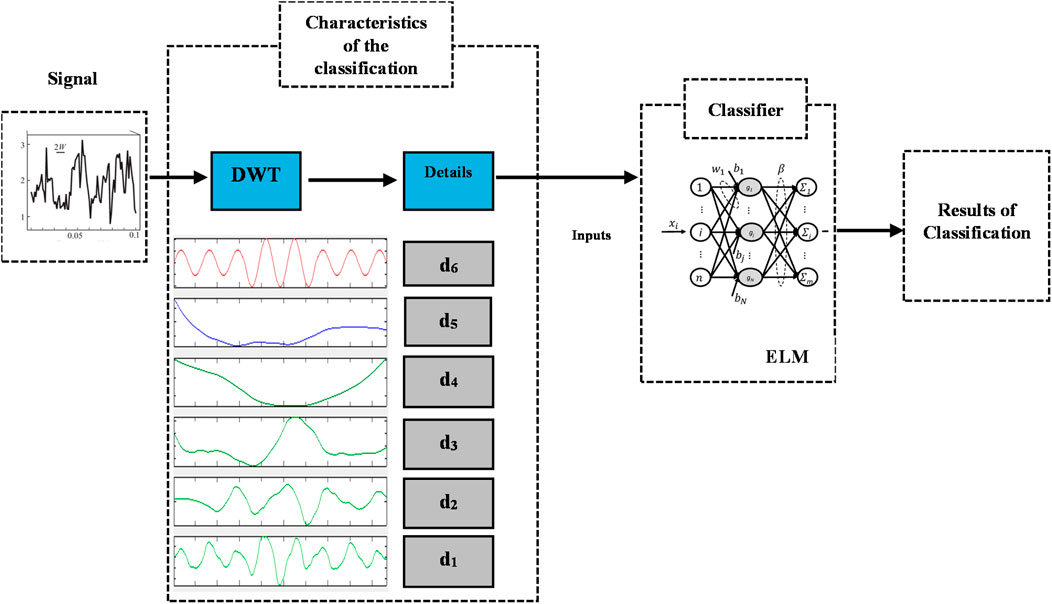
Figure 2. System modelling for disturbance detection and classification.
3.1.1 Wavelet transform
Wavelets can be defined as a class of functions used to localize a given signal in the time and frequency domains. They provide efficient and fast algorithms to represent a signal division into its distinct frequency bands using a multi-resolution analysis.
The wavelet transform (WT), unlike the Fourier transform, is not limited to a frequency analysis technique. By applying the wavelet transform to a signal (Figure 3), one can observe its behavior in both the frequency and time domains. This time-frequency analysis belongs to the group of multi-scale analysis methods such as the sliding window Fourier transform and the cosine transform.
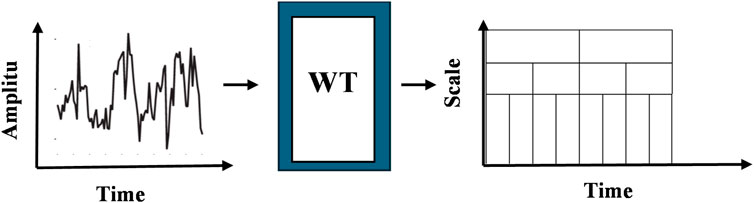
Figure 3. Wavelet transform.
The basic principle consists of convolving the analyzed signal with a function called a wavelet (ψ). An wavelet is a function with zero mean is expressed in Equation 1 (Mallat, 1997):
A function that can be dilated by a scale parameter s and translated by u, as presented in Equation 2:
The wavelet ψ, called the mother wavelet, generates an orthonormal basis of functions called daughter wavelets or simply wavelets. The wavelet transform of f at scale s and position u is obtained by correlating f with the wavelet as presented in Equation 3:
The coefficient of wavelet wf (u,s) is referred to as the wavelet coefficient at scale s and position u of the function f. The result of a wavelet transformation is presented in a time-frequency domain, with u as the abscissa and scale s as the ordinate (Mallat, 1997).
3.1.2 Discrete Wavelet transform
The discrete wavelet transform (DWT) is the numerical application of the wavelet transform (WT). Its usage is popular due to its easy implementation on digital circuits (FPGA, DSP). The DWT (Discrete Wavelet Transform) employs a windowing technique, which involves processing the signal piece by piece. The general principle of the Discrete Wavelet Transform (DWT) is to decompose a signal into multiple sub-signals. In 1989, Mallat (Mallat, 1989) discovered an efficient approach for implementing the Discrete Wavelet Transform (DWT) using filter banks. The principle is explained in Figure 4.
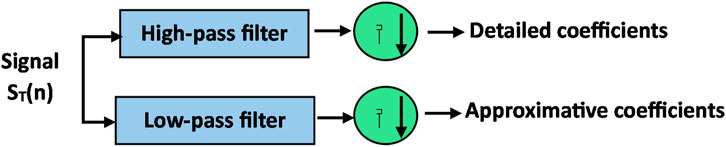
Figure 4. The principle of wavelet decomposition of the signal ST(n).
The input signal ST(n) (the signal to be processed) is passed through a high-pass filter and parallelly through a low-pass filter. This discrete signal is dyadic, meaning it is composed of 2k samples where k is an integer. It should be noted that the coefficients of the high-pass and low-pass filters are identical. Only their order is reversed, meaning that the first coefficient of the low-pass filter corresponds to the last coefficient of the high-pass filter, and so on. The coefficients of the filters are defined based on the nature of the mother wavelet (see (Mallat, 1989)), which allows the dyadic decomposition of the signal x into j stages according to the defined mother wavelet. After each filter, a downsampling operation is performed by a factor of 2. The coefficients a and d are obtained (Equations 4 and 5), respectively called approximation coefficients and detail coefficients.
Where g(n) and h(n) correspond to the low-pass and high-pass filters, respectively. By performing the operation shown in Figure 7, we transition from level j to level j+1. The base signal, conventionally at level j = 0, can be expressed as A0 and D0 for the level 1 coefficients A and D. To generalize, Aj and Dj correspond respectively to the approximation and detail coefficients for level j (where 0 < j < log2(N), N being the length of ST(n)). Using the coefficients Aj, we can obtain, according to the operation in Figure 4, the coefficients Aj+1 and Dj+1. Continuing in this manner until the desired level is reached. Figure 5 depicts a DWT structure decomposed into three levels, obtained by implementing these filters in cascade.
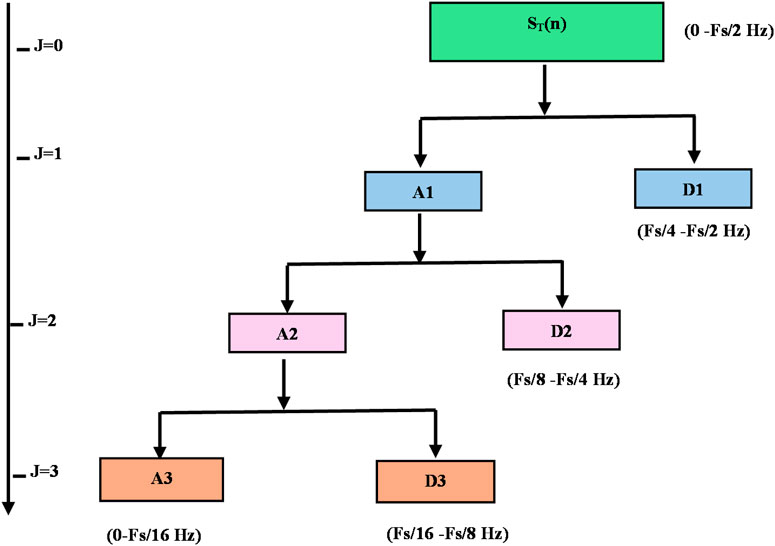
Figure 5. Example of wavelet decomposition.
3.1.3 The selection of the family
The selection of the mother wave function is a critical factor in the process of extracting the desired features. Multiple waveforms have been examined for the purpose of decomposing power disturbance signals. The mentioned wavelet families include Daubechie (specifically db4, db6, db8, db10), Symlets, Coiflets, and bi-orthogonals. Typically, the selection of the mother wave is contingent upon the nature of the disturbance signal that is to be analyzed. In the context of low-level decompositions, specifically high-frequency decomposition, the mother wave exhibits high temporal localization and rapid oscillations within a narrow time interval. As the decomposition level increases, the wave becomes less localized over time and exhibits reduced oscillations. This is attributed to the dilated nature of the DWT force tube. Consequently, the system will be able to detect faster and shorter disturbances at lower thresholds, while slow and long-lasting variations will be detected at higher thresholds. The Daubechie4 waveforms have been found to be more suitable for short and fast transients, as well as slow and stable disturbances. Therefore, the Daubechie4 wavelet is selected as the reference wavelet in this study.
3.1.4 Details on the DWT
The Discrete Wavelet Transform (DWT) is a signal processing technique that is used to analyze signals in both the time and frequency domains. The system offers both temporal and frequency localization. Unlike the Fourier Transform, which solely provides frequency information, the Wavelet Transform is particularly advantageous for the analysis of non-stationary signals, such as power quality disturbances.
Various steps are involved in Discrete Wavelet Transform (DWT), namely:
• Signal Decomposition:
The input signal undergoes a process of decomposition where it is separated into approximation and detail coefficients. This is achieved by applying a series of high-pass and low-pass filters. The iterative nature of this procedure allows for the generation of a multi-resolution analysis of the signal through repeated repetitions.
• Filtering:
- High-pass filter (g): Extracts the high-frequency components (details) of the signal.
- Low-pass filter (h): Extracts the low-frequency components (approximations) of the signal.
• Downsampling:
Following the application of a filter, the signal undergoes downsampling with a downsampling factor of 2, resulting in a reduction of the sample count by half.
• Recursive Decomposition:
The approximation coefficients acquired from the low-pass filter undergo further decomposition into additional sets of approximation and detail coefficients. This procedure is iterated for multiple levels, resulting in a hierarchical organization of the signal’s particulars.
Another crucial aspect to consider is the Multi-Resolution Analysis (MRA). The Multi-Resolution Analysis (MRA) is a technique that involves the decomposition of a signal into multiple resolution levels in order to analyze its frequency components at different scales. This process is essential to the Discrete Wavelet Transform (DWT) and offers a comprehensive analysis of the signal’s properties.
The following is the pseudocode for the Discrete Wavelet Transform (DWT) and Multiresolution Analysis (MRA).
def dwt(signal, wavelet, levels):
"""
Perform Discrete Wavelet Transform (DWT) and Multi-Resolution Analysis (MRA)
:param signal: Input signal to be decomposed
:param wavelet: Wavelet function to use (e.g., ‘db4′)
:param levels: Number of decomposition levels
:return: List of approximation and detail coefficients
"""
approximations = []
details = []
for level in range(levels):
# High-pass filter (detail coefficients)
detail_coeff = high_pass_filter(signal, wavelet)
details.append(detail_coeff)
# Low-pass filter (approximation coefficients)
signal = low_pass_filter(signal, wavelet)
approximations.append(signal)
# Downsampling
signal = downsample(signal)
return approximations, details
def high_pass_filter(signal, wavelet):
# Apply high-pass filter
# (Implementation depends on the chosen wavelet function)
pass
def low_pass_filter(signal, wavelet):
#Apply low-pass filter
# (Implementation depends on the chosen wavelet function)
def downsample(signal):
# Downsample the signal by a factor of two
return signal[::2]
The flowchart for Discrete Wavelet Transform (DWT) and Multiresolution Analysis (MRA) is presented below:
1. **Start**
2. **Input Signal**
3. **Apply High-Pass Filter (Detail Coefficients)**
4. **Apply Low-Pass Filter (Approximation Coefficients)**
5. **Downsample Signal**
6. **Store Coefficients**
7. **Repeat for Desired Levels**
8. **End**
3.1.5 Justification for the choice of the DWT over other methods
Within the field of power quality analysis, the selection of a signal processing technique plays a critical role in accurately detecting and categorizing disturbances. The Discrete Wavelet Transform (DWT) has been selected for this investigation because of its distinct benefits in dealing with non-stationary signals, such as those commonly encountered in power quality events.
The Discrete Wavelet Transform (DWT) offers several advantages over alternative methods:
• Time-Frequency Localization:
- DWT (Discrete Wavelet Transform) provides both time and frequency localization, unlike Fourier Transform (FT) methods that only offer frequency information. This is especially crucial for non-stationary signals, where the signal’s properties can vary over time. For instance, within the realm of power quality, disruptions such as voltage sags, swells, and transients manifest within defined temporal intervals. The Discrete Wavelet Transform (DWT) is capable of achieving more precise localization of these events in comparison to the Fourier Transform (FT). The FT would necessitate conducting multiple analyses with different window sizes in order to obtain comparable outcomes.
• Multi-Resolution Analysis (MRA):
- The Discrete Wavelet Transform (DWT) is a mathematical technique that enables the analysis of signals at multiple resolutions. It achieves this by decomposing signals into different frequency bands. This enables the detection of both high-frequency transient events and low-frequency steady-state conditions within the same framework. Indeed, a power quality signal containing both high-frequency noise and low-frequency voltage variations can be effectively analyzed by decomposing it into various resolution levels.
• Noise Robustness:
- The Discrete Wavelet Transform (DWT) exhibits greater noise robustness in comparison to alternative techniques such as the Short-Time Fourier Transform (STFT). The multi-resolution capability enhances the ability to separate noise from genuine signal characteristics, resulting in enhanced accuracy for detecting disturbances. For instance, in settings with significant electrical interference, the Discrete Wavelet Transform (DWT) is capable of accurately identifying and categorizing power quality disruptions. In contrast, the Short-Time Fourier Transform (STFT) may encounter difficulties due to its fixed window sizes that do not effectively adjust to changing signal properties.
• Efficient Computation:
- The utilization of Discrete Wavelet Transform (DWT) exhibits a high level of computational efficiency, rendering it well-suited for real-time applications. The efficiency of this algorithm is especially advantageous when it is implemented on hardware platforms such as Field-Programmable Gate Arrays (FPGAs). For real-time monitoring systems, the efficient calculation of Discrete Wavelet Transform (DWT) enables the timely identification and categorization of disruptions. This capability is essential for ensuring power quality and mitigating potential equipment harm.
However, there are certain limitations that can be observed in the Discrete Wavelet Transform (DWT) technique, including:
• Choice of Wavelet Function:
- The performance of the Discrete Wavelet Transform (DWT) is significantly influenced by the selection of the mother wavelet. Improper selection of parameters can result in decreased accuracy in detecting the desired target. As a mitigation strategy, conducting extensive testing and validation can aid in the selection of the most appropriate wavelet function for the specific types of disturbances anticipated in power quality signals.
• Computational Load for Higher Decomposition Levels:
- As the level of decomposition increases, the computational load also increases. This can pose a constraint for highly complex multi-resolution analyses. As a temporary solution, the application of optimization techniques and the implementation of efficient algorithms on hardware platforms such as Field-Programmable Gate Arrays (FPGAs) can assist in effectively managing the computational workload.
A comparison with Other Methods leads to the following remarks:
• Fourier Transform (FT) and Short-Time Fourier Transform (STFT):
- FT provides only frequency information and is not suitable for non-stationary signals. STFT offers time-frequency analysis but with fixed window sizes, limiting its effectiveness for transient events.
- DWT, on the other hand, provides adaptive time-frequency resolution, making it more suitable for a wide range of power quality disturbances.
• Hilbert-Huang Transform (HHT):
- HHT is effective for non-stationary signal analysis but is computationally intensive and less robust to noise compared to DWT.
- DWT provides a balance between computational efficiency and robustness, making it more practical for real-time applications.
• Kalman Filters (KF):
- KF is excellent for state estimation in noisy environments but does not provide the same level of time-frequency resolution as DWT.
- DWT’s ability to decompose signals into different frequency bands offers a more detailed analysis of power quality disturbances.
• Variational Mode Decomposition (VMD):
- VMD is a powerful method for decomposing signals into intrinsic mode functions but is more complex and computationally demanding than DWT.
- DWT’s simplicity and efficiency make it a preferable choice for many practical applications.
This justification and detailed explanation highlight the suitability of Discrete Wavelet Transform (DWT) for power quality analysis, considering its advantages in time-frequency localization, multi-resolution analysis, noise robustness, and computational efficiency. The comparison with alternative methodologies further emphasizes the efficacy of the approach in detecting and categorizing energy quality incidents.
3.1.6 Time-frequency analysis using Wavelet transform
The power quality disturbances in electrical signals can manifest as either short, fast transients or slow, stable disturbances. The Discrete Wavelet Transform (DWT) is particularly effective for analyzing these disturbances due to its ability to provide detailed time-frequency localization. This section presents time-frequency plots of various disturbances and their corresponding wavelet transforms to illustrate the effectiveness of Daubechies wavelets in capturing these events.
The disturbance types analyzed are various. We can cite:
• Voltage Sag: A voltage sag is a short-duration decrease in RMS voltage. It typically occurs due to short circuits, overloads, or starting of large motors. The DWT using Daubechies wavelets effectively captures the rapid drop in voltage amplitude, highlighting the transient nature of the sag
• Voltage Swell: A voltage swell is a short-duration increase in RMS voltage. It can be caused by a sudden reduction in load or switching off large loads. The wavelet transform reveals the swell’s frequency components, showing a clear, time-localized increase in voltage, which is efficiently captured by the DWT.
Harmonic Distortion: Harmonic distortion refers to the presence of frequencies in the power signal that are multiples of the fundamental frequency. This is often due to non-linear loads. The DWT using Daubechies wavelets captures the harmonics as distinct, localized components in the time-frequency plane, demonstrating the ability to isolate different frequency components effectively.
Voltage Interruption: A voltage interruption is a complete loss of voltage for a short duration. It can be caused by faults, equipment failures, or protective device operations. The wavelet transform highlights the sudden drop to zero voltage, clearly identifying the interruption’s time and duration.
Transient Oscillations: Transient oscillations are short-duration high-frequency disturbances that can be caused by switching operations, lightning, or other sudden changes in the power system. The DWT reveals the high-frequency content of the transient oscillations, providing a detailed view of the disturbance over time.
3.2 Extreme learning machine (ELM)
The emerging machine learning technique, Extreme Learning Machines (ELM), has gained significant attention in recent years due to increasing research activities and significant contributions from researchers worldwide. Direct-action neuron networks (FFNNs) have been utilized in diverse machine learning studies and have achieved extensive recognition. However, recent observations have indicated that the network of direct-action neurons exhibits suboptimal processing speed. The learning rate of direct-acting neural networks is typically insufficient for efficient task execution in their applications. The primary factors contributing to this deceleration are:
(1) the prevalent utilization of sluggish gradient-based learning algorithms in the construction of neural networks, and
(2) the iterative adjustment of all network parameters through the application of said learning algorithms. In order to train neural networks using conventional methods, the process of learning can require a significant amount of time, ranging from hours to days or even longer.
Researchers have proposed various techniques to enhance the optimality or effectiveness of learning NFPs, including the subset selection method (Chen et al., 1991; Li et al., 2005), the second-order optimization method (Hagan and Menhaj, 1994; Wilamowski and Yu, 2010), or the overall optimization method (Yao, 1993). Although exhibiting superior generalization performance or faster training speed in comparison to the conventional algorithm, most of these methods still lack the ability to ensure an optimal overall solution. Extreme Learning Machines (ELMs) have recently been proposed as a method to operate a single hidden layer of direct-acting neuron networks. A Single Layer Feedforward Neural Network (SLFN). In Extreme Learning Machines (ELMs), the initialization of hidden nodes is performed randomly and then corrected without the need for iterative adjustments.
3.2.1 Operating principle of the ELM
The Extreme Learning Machine (ELM) was initially introduced by Huang et al. (2006) in 2006 as a learning architecture specifically designed for Nonlinear Programming Languages (NPLs). In the Extreme Learning Machine (ELM) algorithm, the weights and biases of the input layer are initialized randomly, while only the weight of the output layer is computed. It has been noted that the initial assignment of the first layer in ELM is arbitrary, and the learning time for ELM is exceptionally brief. Moreover, the extreme machine learning framework exhibits superior generalization ability in comparison to the traditional feedback-based learning algorithm. Figure 6 below depicts a Simple Learning Feedforward Network (SLFN) in its fundamental form. The classifier’s inputs and outputs are denoted by xi and yi, respectively.
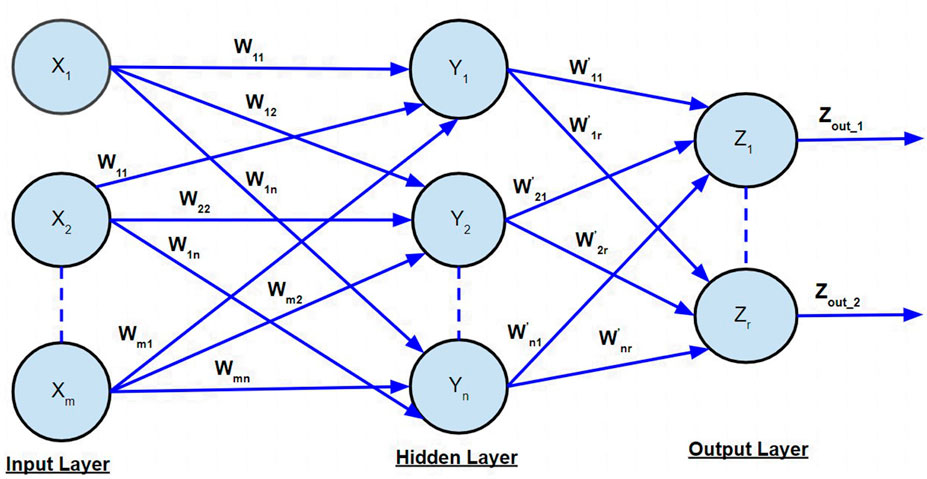
Figure 6. Slfn.
The basic SLFN, which consists of M hidden nodes and operates with the activation function g(x), can be described mathematically as presented in Equation 6:
Where wi represents the weight of the input in layer i and i represents the weight of the output in layer i. bi denotes the bias values of the input layer. The variable “O" represents the anticipated output of the Extreme Learning Machine (ELM) algorithm.
The objective of learning single hidden layer neural networks is to minimize the output error, which can be expressed using Equation 7:
Thus, Equation 6 can be reformulated as in Equation 8:
Equation 9 demonstrates the existence of appropriate output weights capable of forming measured outputs. If a facilitation is implemented as in (9), Equation 8 can be reformulated as in (10):
with
Equation 10 refers to a linear equation whose solution leads us to obtain ELM values. As usual, there is a need for iterative processes to obtain the expected results, but the ELM only solves a linear equation to execute the similar process at once without any iteration. Equation 11 describes the solution to obtain the value of β from (10):
The calculation of H* is performed using the Moore-Penrose inverse, also known as the generalized inverse, of the H matrix.
3.2.2 Algorithm of the ELM
The following algorithm presents the ELM (Figure 7):
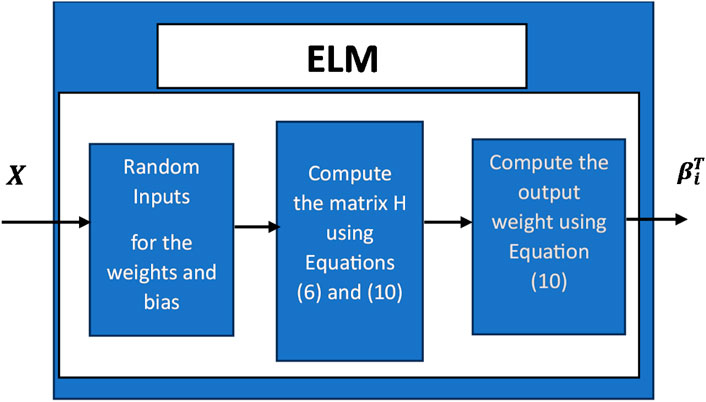
Figure 7. A flowchart of the ELM method.
The input consists of a treatment set, denoted as [t=1, 2, ..., T].
Output : The output weights of the Extreme Learning Machine (ELM) structure are calculated by determining the value of β using the equation Y=H.β.
System startup :
1. Initialize the input weights and bias with random values.
2. For each iteration t = 1, 2, ..., T, perform the following actions :
3. Compute the H matrix using Equations 6 and 9.
4. Calculate the output weights using Equation 10.
The loop terminates at the end of the iteration.
Algorithm of the ELM
Some characteristics of this method ELM can depicted as follows:
• The learning speed of the ELM is extremely fast.
• The weight of the connection between the input layer and the hidden layer, and the threshold of the hidden layer can be randomly adjusted, and do not need to be adjusted after the initial setting.
• The connection weight β between the hidden layer and the output layer does not require iterative adjustment, but is determined once by solving Eq. s.
• Homogeneous architectures for compression, feature learning, clustering, regression, and classification.
3.2.3 Detailed explaination on the ELM
The Extreme Learning Machine (ELM) is a rapid learning algorithm for Single Layer Feedforward Networks (SLFN). It employs random initialization of weights and biases for the hidden nodes, and uses analytical methods to determine the output weights. This approach leads to a fast training process. The sequential process of ELM (Elaboration Likelihood Model) is outlined as follows:
• Input Layer Initialization:
- Randomly initialize the input weights and biases.
• Hidden Layer Calculation:
- Calculate the hidden layer output matrix (H).
• Output Weights Calculation:
- Compute the output weights using the Moore-Penrose generalized inverse of the hidden layer output matrix.
The pseudocode for Extreme Learning Machine (ELM) is typically written in the following format:
import numpy as np
def elm_train(X, y, num_hidden_neurons):
"""
Train an extreme learning machine (ELM)
:param X: Input data (features)
:param y: Output data (labels)
:param num_hidden_neurons: Number of hidden neurons
:return: Output weights (beta)
"""
input_weights = np.random.randn(num_hidden_neurons, X.shape (Yang et al., 2024))
biases = np.random.randn(num_hidden_neurons)
# Calculate hidden layer output matrix H
H = np.dot(X, input_weights.T) + biases
H = np.tanh(H) # Activation function
# Calculate output weights (beta)
H_pseudo_inverse = np.linalg.pinv(H)
beta = np.dot(H_pseudo_inverse, y)
return beta
def elm_predict(X, input_weights, biases, beta):
"""
Predict using an extreme learning machine (ELM)
:param X: Input data (features)
:param input_weights: Input weights from training
:param biases: Biases from training
:param beta: Output weights from training
:return: Predicted output
"""
H = np.dot(X, input_weights.T) + biases
H = np.tanh(H) # Activation function
y_pred = np.dot(H, beta)
return y_pred
Additionally, the flowchart illustrating the process of ELM is presented below:
1. **Start**
2. **Input Data (X, y)**
3. **Initialize Input Weights and Biases**
4. **Calculate Hidden Layer Output Matrix (H)**
5. **Compute Output Weights (Beta)**
6. **End**
3.3 FPGA model for validation of the proposed system
The validation of the proposed system for power quality disturbance detection and classification using FPGA implementation is crucial to ensure its real-time applicability and performance. This section elaborates on the FPGA model, simulation environment, datasets used, and the metrics for performance evaluation.
Let us start first by presenting the FPGA Implementation Using MATLAB HDL Coder. The proposed system was implemented on an FPGA using MATLAB HDL Coder, which converts MATLAB code into HDL (Hardware Description Language) code suitable for FPGA deployment. The following steps outline the process:
a. Design and Simulation in MATLAB:
• Develop the algorithm in MATLAB.
• Perform simulations to verify the correctness and performance of the algorithm.
b. Conversion to HDL Code:
• Use MATLAB HDL Coder to convert the MATLAB algorithm into VHDL or Verilog code.
• Ensure that the generated HDL code is compatible with the target FPGA device.
c. FPGA Synthesis and Implementation:
• Use FPGA development tools (e.g., Xilinx Vivado) to synthesize the HDL code.
• Implement the synthesized design on the FPGA.
• Perform place and route to ensure the design fits within the FPGA resources.
d. Verification and Testing:
• Verify the implemented design on the FPGA using testbenches.
• Compare the results with the MATLAB simulation to ensure accuracy.
For the simulation environment, the FPGA model was validated using the following environment:
• Software:
• MATLAB R2021b
• MATLAB HDL Coder
• Xilinx Vivado 2020.2
• Hardware:
• Xilinx Zynq-7000 SoC FPGA
• Clock frequency: 100 MHz
• FPGA resources: 53,200 LUTs, 106,400 Flip-Flops, 140 BRAMs
Concerning the dataset used, the dataset for training and testing the Extreme Learning Machine (ELM) classifier was generated using simulated power quality disturbances. The disturbances included voltage sags, voltage swells, harmonics, interruptions, and transients. The dataset was divided into training and testing sets with the following characteristics:
• Training Set:
• Number of samples: 10,000
• Disturbance types: 7 (sags, swells, harmonics, interruptions, transients, sags with harmonics, swells with harmonics)
• Features: Detail and approximation coefficients obtained from DWT
• Testing Set:
• Number of samples: 3,000
• Disturbance types: 7 (same as training set)
• Features: Detail and approximation coefficients obtained from DWT
The steps for FPGA model implementation are depicted as below:
a. Feature Extraction Using DWT:
• Decompose the input signal using Discrete Wavelet Transform (DWT) to obtain detail and approximation coefficients.
• The Daubechies 4 (db4) wavelet was used for the decomposition.
b. Training the ELM Classifier:
• Train the ELM classifier using the training dataset.
• The number of hidden neurons was set to 20.
• The activation function used was the sigmoid function.
c. HDL Code Generation:
• Convert the trained ELM classifier and DWT feature extraction code into HDL using MATLAB HDL Coder.
d. FPGA Synthesis and Implementation:
• Synthesize the HDL code using Xilinx Vivado.
• Implement the design on the Xilinx Zynq-7000 SoC FPGA.
• Perform place and route to ensure the design fits within the FPGA resources.
e. Validation and Testing:
• Validate the FPGA implementation using the testing dataset.
• Measure the performance metrics: accuracy, precision, recall, and F1 score.
In addition, the performance of the FPGA-implemented system was evaluated using the following metrics:
• Accuracy: The proportion of correctly classified instances out of the total instances.
• Precision: The proportion of true positive instances out of the total predicted positive instances.
• Recall: The proportion of true positive instances out of the total actual positive instances.
• F1 Score: The harmonic mean of precision and recall.
3.4 Outline and rationale for adopting Daubechies wavelets
The Daubechies wavelets are renowned for their compact support and smoothness, making them exceptionally efficient for analyzing signals that exhibit transient and non-stationary characteristics. The key features of Daubechies wavelets include:
• Compact Support: Daubechies wavelets possess a limited number of coefficients that are non-zero, enabling efficient computation and rendering them highly advantageous for real-time processing applications.
• The wavelets exhibit vanishing moments, a property that enables them to effectively represent polynomial trends in signals. This functionality is of utmost importance for the acquisition of both high-frequency transients and low-frequency steady-state disturbances.
• Scalability: The Daubechies wavelets possess the ability to perform multi-resolution analysis, allowing them to break down signals into different frequency components. This allows for a more detailed understanding of the signal’s characteristics at different scales.
A constructive analysis of suitability for short and fast transients reveals that:
• High Temporal Resolution: The utilization of Daubechies wavelets enables the achievement of high temporal resolution, which is attributed to their compact support. This property allows them to effectively detect abrupt variations in signals, such as voltage sags and spikes. The exponential decrease of the wavelet function allows for accurate temporal localization of transient events.
• Multi-Resolution Analysis: The capability to conduct multi-resolution analysis enables Daubechies wavelets to capture the intricate structure of short and rapid transients. The signal can be decomposed into various levels of detail, allowing for the isolation of high-frequency components that are typically associated with transients.
In addition, suitability for slow and stable disturbances refers to the ability of a system to effectively handle and adapt to gradual and consistent changes or disruptions. Thus, it is important to highlight some crucial points such as:
• Frequency Localization: Daubechies wavelets exhibit exceptional frequency localization, a crucial characteristic for the analysis of low-frequency and steady disturbances. The low-frequency components of the signal, such as harmonic distortions, can be accurately represented by them over a prolonged duration.
• Smoothness: The smoothness property of Daubechies wavelets renders them well-suited for capturing the steady-state characteristics of power quality signals. This is especially crucial for the surveillance of ongoing disruptions such as voltage surges and harmonic distortions.
Furthermore, a comparison with other Wavelets reveals that the Haar or Morlet wavelets can also be utilized for power quality analysis. But, Daubechies wavelets provide a well-rounded approach that combines compact support with a large number of vanishing moments. These characteristics make them highly efficient for analyzing both transient and steady-state signals.
The choice of Daubechies wavelets for the analysis of power quality disturbances is underpinned by their distinct mathematical properties and practical advantages. Daubechies wavelets are known for their compact support and high number of vanishing moments, which make them particularly suitable for detecting both short, fast transients and slow, stable disturbances. Their ability to provide high temporal resolution enables precise localization of transient events such as voltage sags and spikes, while their excellent frequency localization allows for the accurate representation of slow disturbances like harmonic distortions. The multi-resolution analysis capability of Daubechies wavelets further enhances their effectiveness in capturing the detailed structure of power quality signals, making them an ideal choice for this study. This selection is supported by extensive literature, including works by Addison (He et al., 2024; De Yong et al., 2015), which highlight the efficacy of Daubechies wavelets in signal analysis across various domains.
3.5 Implementation of a command algorithm via FPGA
Among the new hardware solutions, FPGA components have been successfully used in various applications related to the control of electrical machines. Indeed, they have been used for the control of power converters such as three-phase voltage inverters, AC/DC converters, multilevel converters, active filters. FPGAs have also been used for the control of asynchronous machines, synchronous machines, and machines with variable reluctance. The development steps of the architecture to be implemented are mainly carried out using the Matlab-Simulink software as well as the CAD tools of the hardware solutions.
In addition, it is important to provide a rationale for choosing FPGA for implementation. Indeed, while considering the benefits of FPGA implementation, many points can be presented such as:
a. Speed and Efficiency:
- Parallel Processing: FPGAs excel in parallel processing, allowing multiple operations to be executed simultaneously. This capability significantly speeds up the computation compared to traditional microprocessors, which perform tasks sequentially.
- Low Latency: The inherent parallelism and hardware-level execution in FPGAs result in extremely low latency, which is critical for real-time applications like power quality monitoring.
- High Throughput: FPGAs can handle high data throughput, making them suitable for applications that require processing large volumes of data in real-time.
b. Real-Time Processing Capabilities:
- Deterministic Performance: FPGAs offer deterministic processing times, ensuring consistent and predictable performance. This is essential for real-time systems where timely responses are critical.
- Customizable Hardware: The reconfigurable nature of FPGAs allows for tailored hardware architectures optimized for specific tasks, enhancing real-time processing efficiency.
- Immediate Responsiveness: FPGAs can quickly respond to changes in input signals, making them ideal for dynamic environments where conditions can change rapidly.
c. Energy Efficiency:
- Low Power Consumption: FPGAs typically consume less power than traditional processors due to their ability to perform specific tasks using dedicated hardware circuits. This makes them suitable for energy-efficient implementations.
- Optimized Resource Utilization: By designing custom hardware for specific tasks, FPGAs can be optimized to use only the necessary resources, further reducing power consumption.
However, some challenges have been faced during FPGA implementation. Among all, we can cite:
a. Complexity of HDL Coding:
- Challenge: Writing efficient HDL (Hardware Description Language) code can be complex and requires specialized knowledge in digital design.
- Solution: MATLAB HDL Coder was used to automate the conversion of MATLAB algorithms into HDL code. This tool simplifies the process and reduces the potential for coding errors, allowing the focus to remain on algorithm development and performance optimization.
b. Resource Constraints:
- Challenge: Ensuring the design fits within the available resources of the FPGA, such as logic cells, memory blocks, and DSP slices, can be challenging, especially for complex algorithms.
- Solution: The design was optimized by carefully selecting the number of hidden neurons in the ELM classifier and the decomposition levels in DWT. The use of MATLAB HDL Coder also facilitated resource-efficient code generation.
c. Timing Closure:
- Challenge: Meeting the timing requirements of the FPGA design to ensure reliable operation at the desired clock frequency can be difficult.
- Solution: Timing analysis tools provided by the FPGA development environment (Xilinx Vivado) were used to identify and resolve timing violations. Techniques such as pipelining and retiming were employed to improve the timing performance.
d. Verification and Debugging:
- Challenge: Verifying and debugging the FPGA design to ensure it functions correctly in hardware can be more challenging than in software development.
- Solution: Testbenches were created to simulate the FPGA design in software before deployment. Additionally, on-chip debugging tools and logic analyzers were used to monitor the FPGA’s internal signals during operation.
Choosing FPGA for implementing the power quality disturbance detection and classification system provides significant benefits in terms of speed, efficiency, and real-time processing capabilities. Despite challenges such as HDL coding complexity, resource constraints, timing closure, and verification, the use of tools like MATLAB HDL Coder and Xilinx Vivado, combined with optimization techniques, ensured a successful implementation. The FPGA-based system demonstrated high accuracy, low latency, and energy efficiency, making it an ideal solution for real-time power quality monitoring applications.
4 Results and discussions
In the previous sections, we have reviewed the state of the art of network disturbance detection and classification strategies. Additionally, we have decomposed our system model into two main parts: detection and classification, where we have presented the ELM algorithm. The feature extraction of the signals was performed using wavelet decomposition with the DAUBECHIES family, which generated the training database for our ELM algorithm. In this section, we will present the results of the simulations conducted using the MATLAB/Simulink TM environment.
4.1 Electrical disturbances and multiscale analysis
4.1.1 Electrical disturbances
The line fault model consists of a 15 kV, 30 MVA, 50 Hz three-phase source block supplying star/star or delta/star transformers of 15 kV/0.4 kV, 1 MVA to a resistive load of 10 W and an inductive load of 100 KVAR. There are instantaneous waveform measurement oscilloscopes located on 15 kV and 0.4 kV lines.The figures below depict waveforms of normal voltage, voltage drop, voltage interruption, overvoltage, transients, etc. caused by a line fault. A simulation time of 0.4 s is defined and the ode23tb solver is selected to execute the simulation.
a) Standard voltage:
The standard voltage is defined by three 15 kV sinusoidal signals, as illustrated in Figure 8B. Figure 8A depicts the MATLAB model utilized to acquire these outcomes.
b) Power voltage:
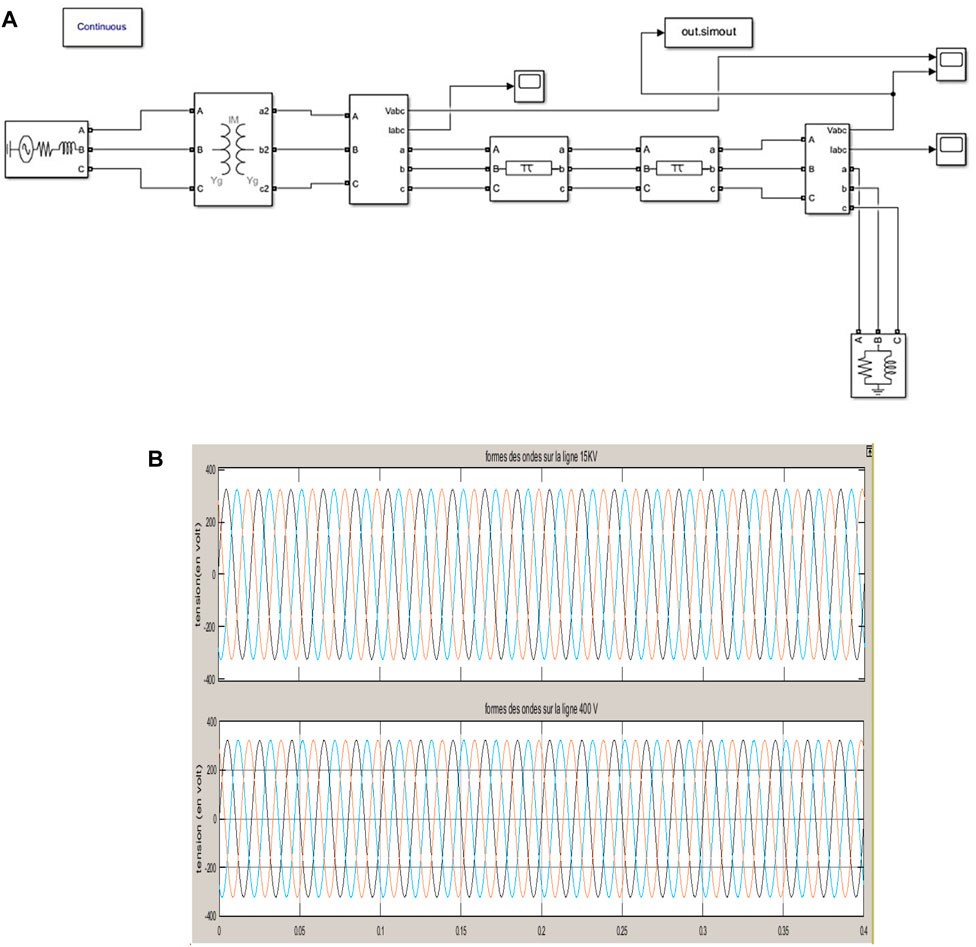
Figure 8. (A) MATLAB Model for standard voltage; (B) Waveform for standard voltage.
For the generation of the momentary interruption of voltage in the MATLAB simulation model 5 (Figures 9A, B), we consider a three-phase source of 15 kV, 30 MVA, 50 Hz feeding star/star or delta/star transformers of 15 kV/0.4 kV, 1 MVA, and an active load of 30 W. The interruption is generated between 0.15 and 0.25 s. The total duration of the simulation is 0.4 s.
c) Voltage sag and voltage surge: Figures 10A, B
d) Transitional oscillations: Figures 11A, B
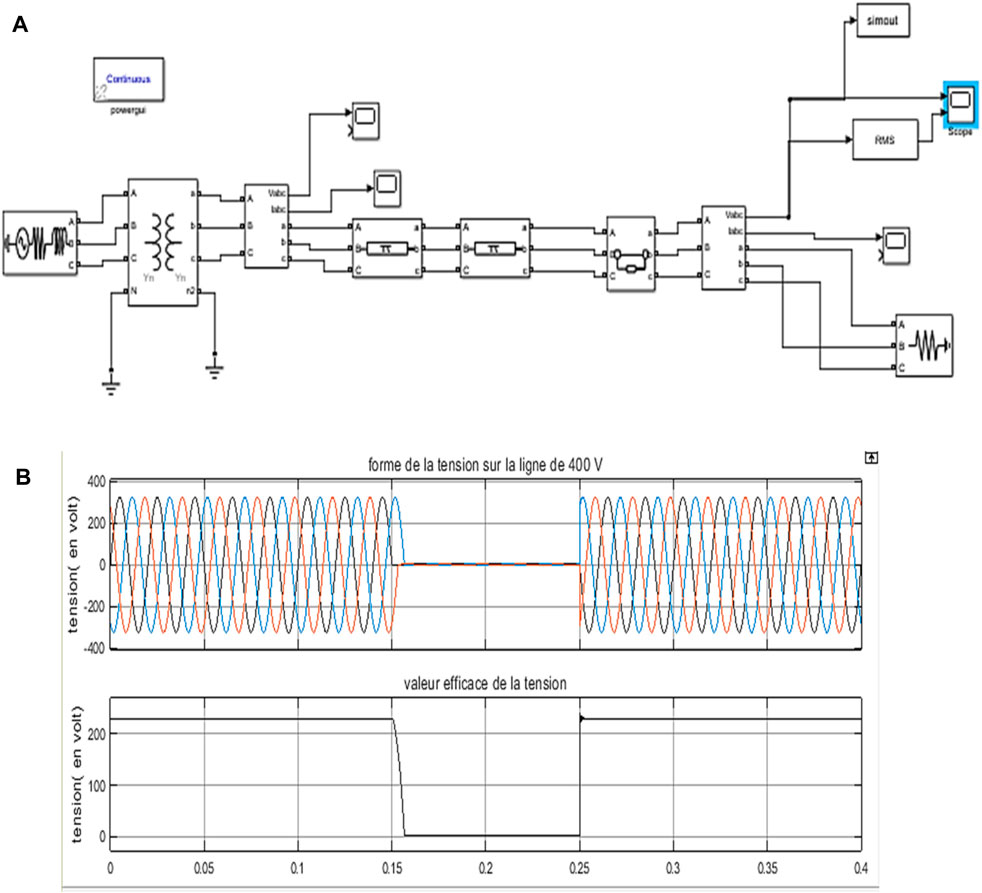
Figure 9. (A) MATLAB Model for power outage; (B) Waveform for power outage.
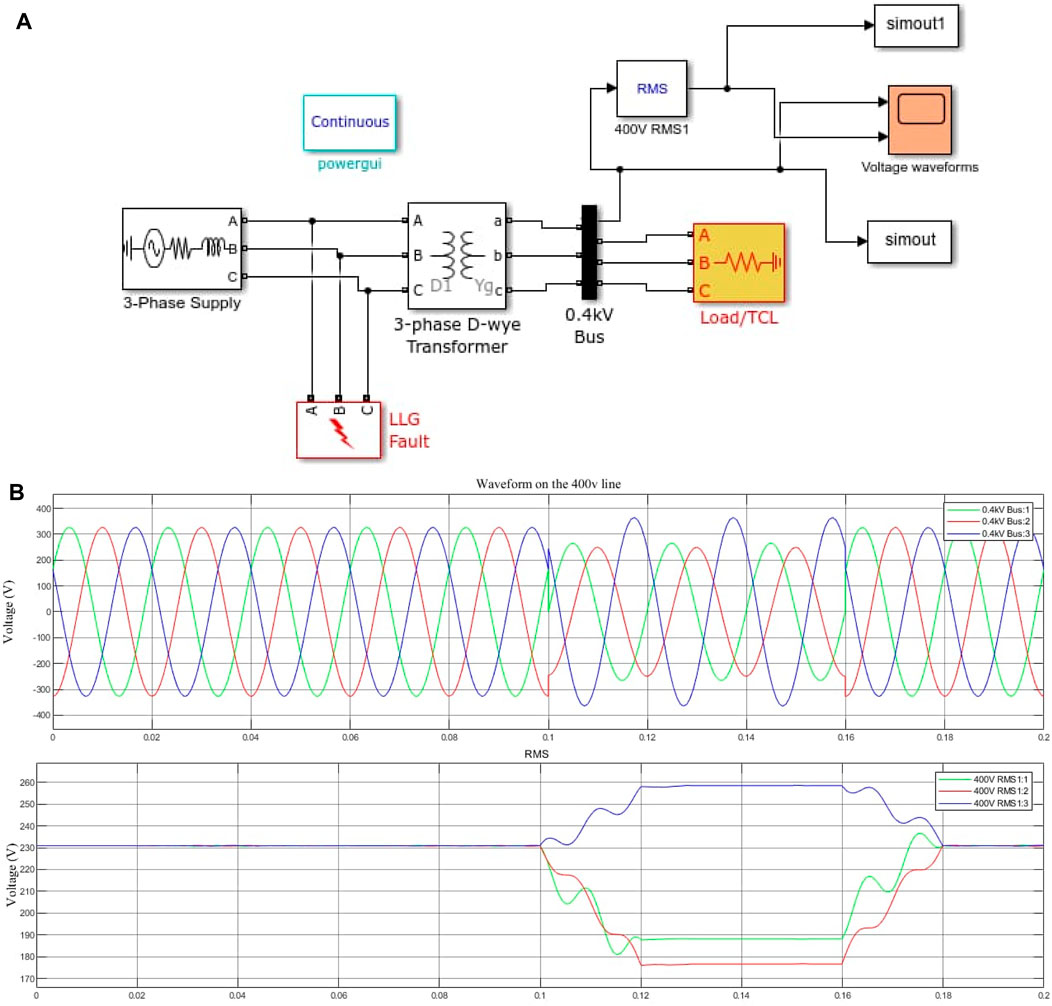
Figure 10. (A) MATLAB Model for voltage sag and voltage surge; (B) Waveform for voltage sag and voltage surge.

Figure 11. (A) MATLAB Model for transitional oscillations; (B) Waveform for transitional oscillations.
4.1.2 MultiScale analysis (MSA)
After obtaining our disturbances, we decomposed these signals using wavelet transformation using the Daubechies four wavelet of order 7, resulting in:
a. Standard voltage: Figure 12
b. Disturbances on voltage: Figures 13–19
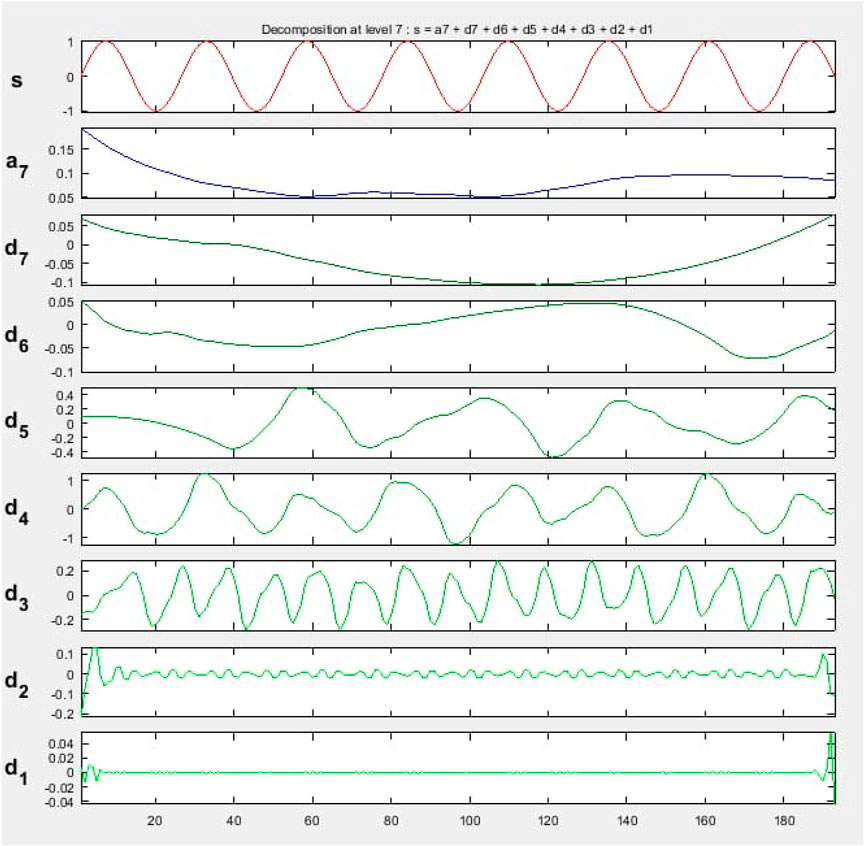
Figure 12. MSA for standard voltage signal.
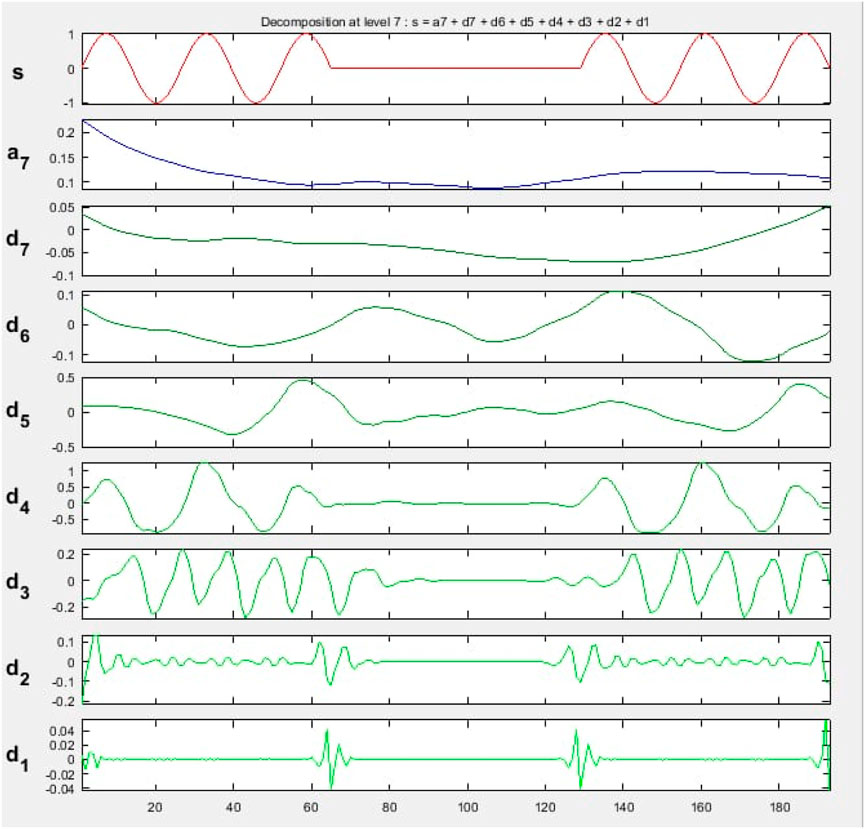
Figure 13. MSA for power outage.
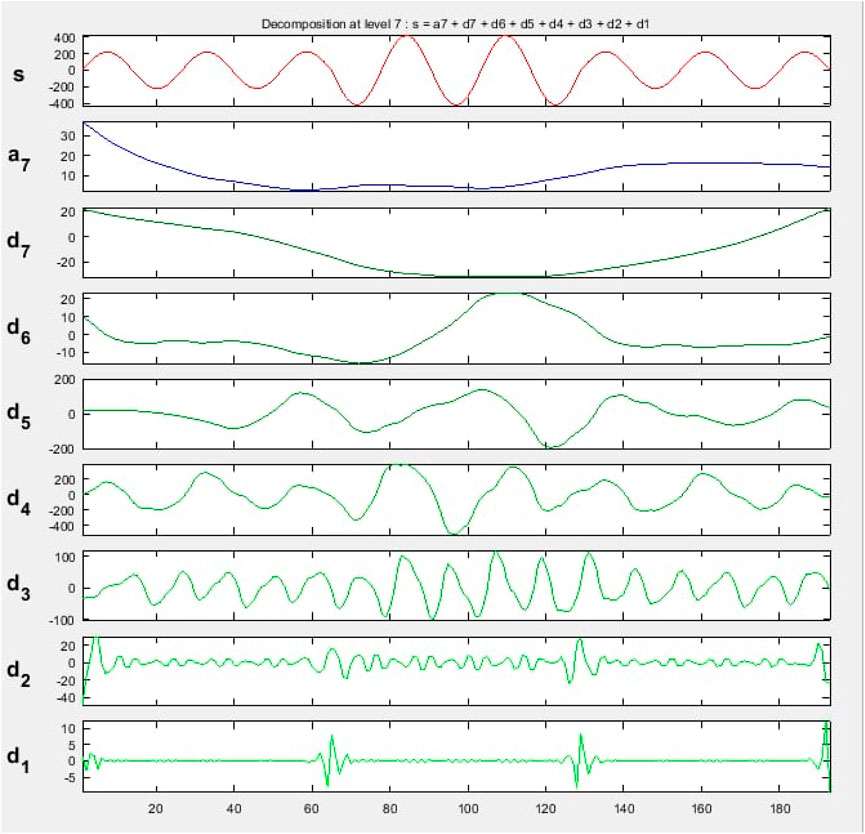
Figure 14. MSA for voltage surge.
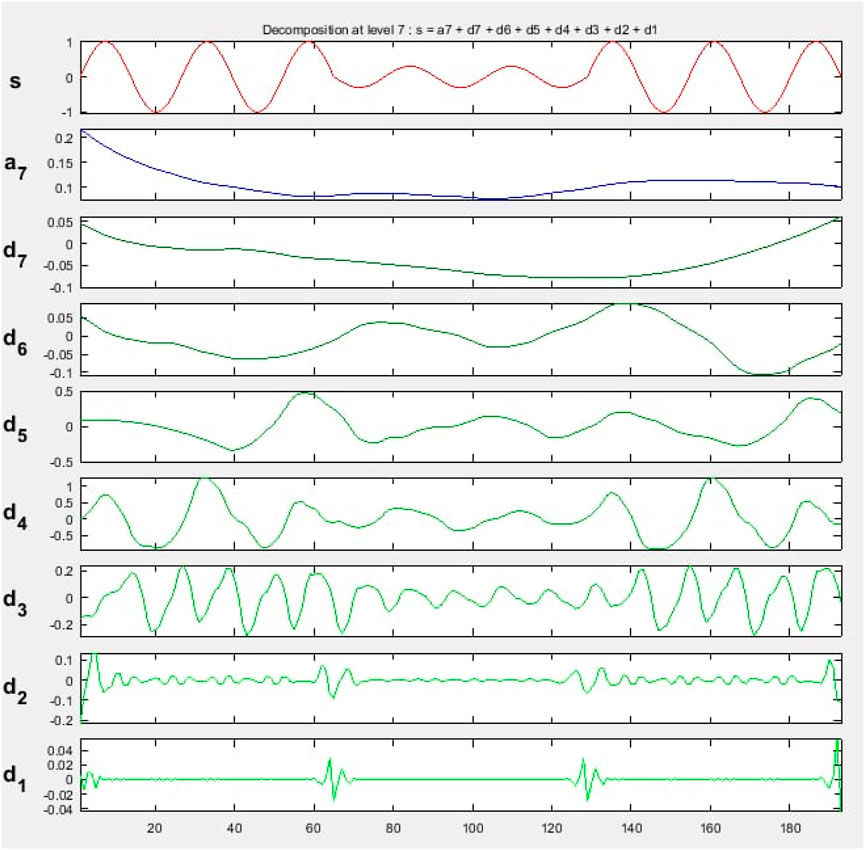
Figure 15. MSA for voltage sags.
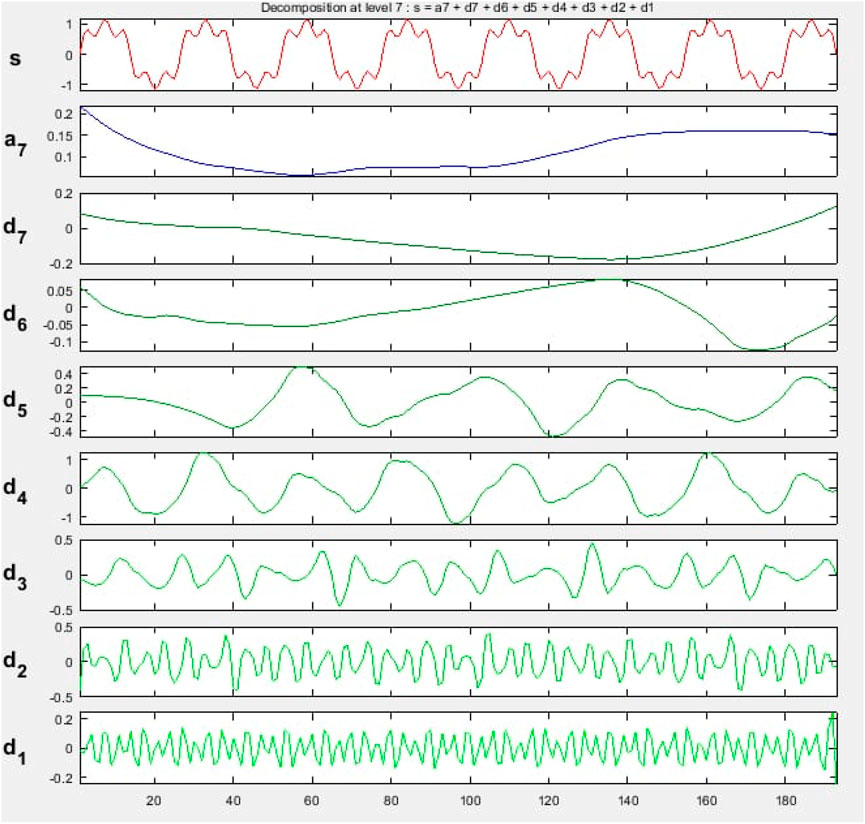
Figure 16. MSA for harmonics.
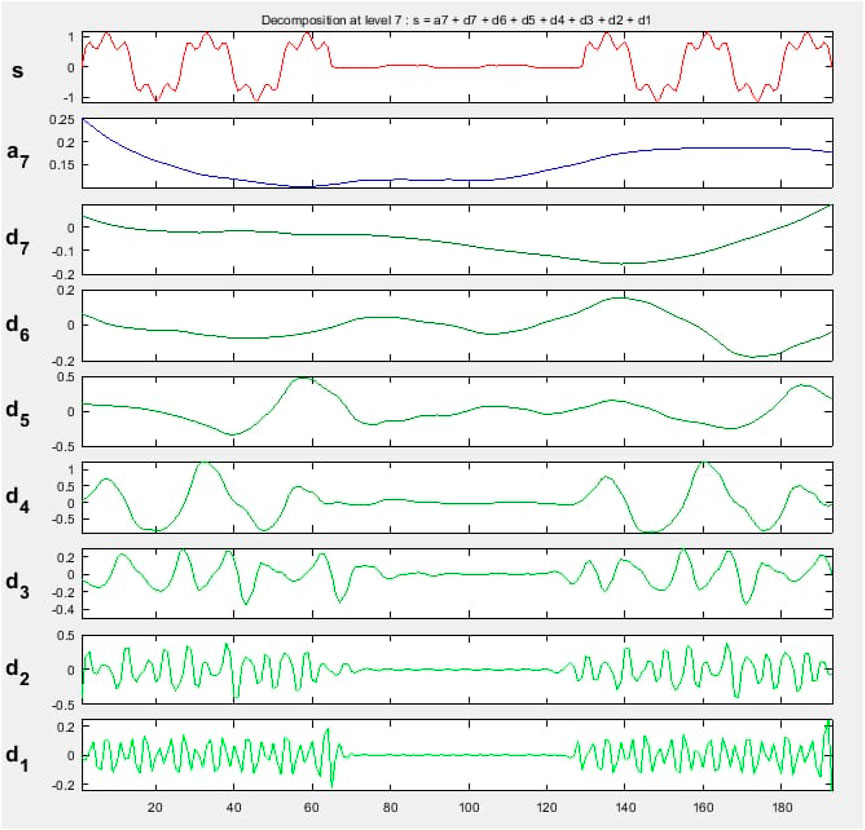
Figure 17. MSA for power outage with harmonics.
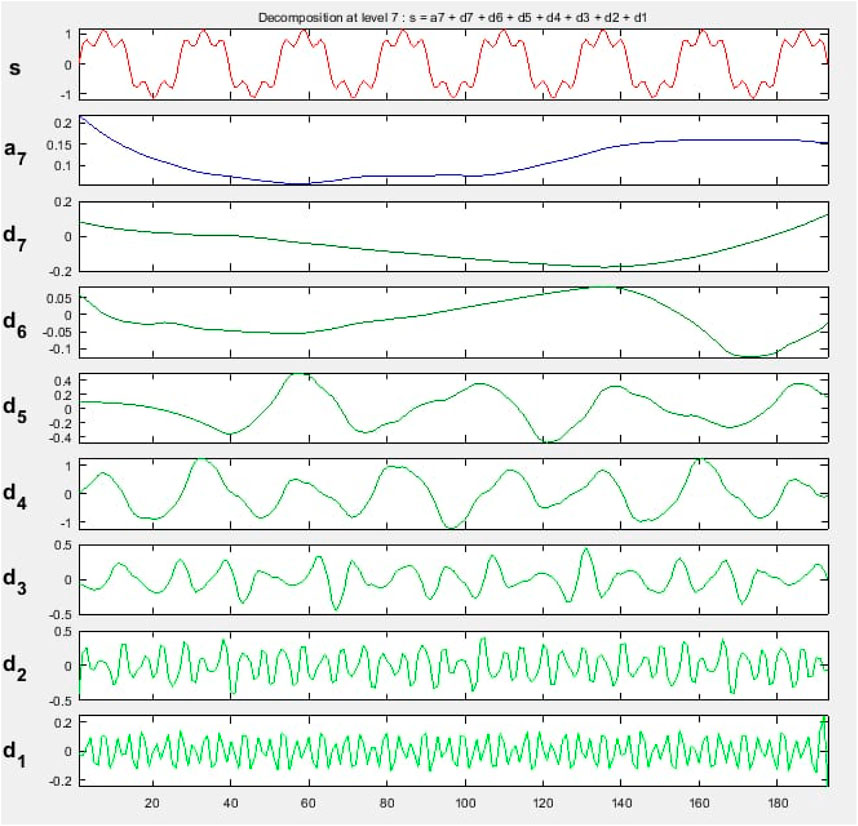
Figure 18. MSA for power quality issues with harmonics.
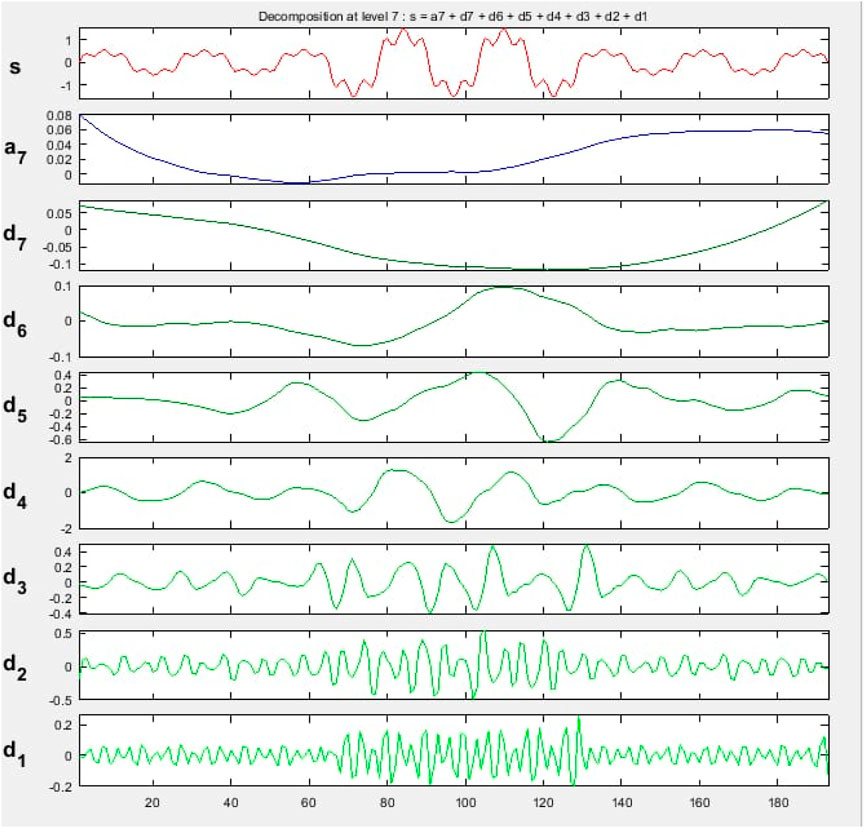
Figure 19. MSA for voltage surge with harmonics.
After this multi-resolution analysis, we obtain the detail and approximation coefficients for each energy quality disturbance, which can be organized as row matrices as indicated below.
4.2 Training of the ELM
The training of our ELM algorithm (see appendix) is performed using the matrices derived from multi-resolution analysis as training data.
Simulation conditions (Figure 20)
- Our network’s hidden layer consists of 20 neurons.
- The type of ELM used is classification:1.
- The activation function used is the sigmoid function.
- Number of attempts: 3
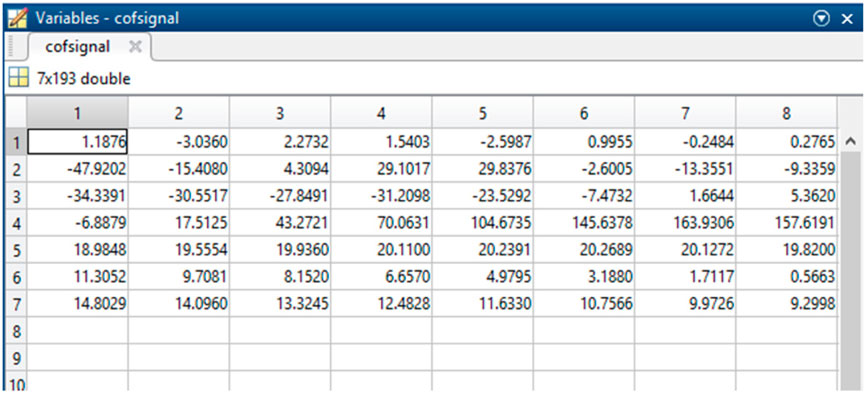
Figure 20. Matrices of details and approximations derived from multi-resolution analysis.
Next, it is important to proceed with the comparison with other classification methods. The performance of the ELM classifier is compared with other common classification methods such as Support Vector Machines (SVM), Random Forest (RF), and Artificial Neural Networks (ANN). Key metrics for comparison include accuracy, precision, recall, and F1 score. Supplementary Table S3 presents all these key metrics.
Many advantages of the ELM can then be outlined such as:
• Fast Training Speed: ELM significantly reduces the training time compared to traditional neural network algorithms, making it suitable for real-time applications.
• High Accuracy: ELM achieves high classification accuracy, as demonstrated in the comparison table.
• Simplicity: The non-iterative nature of ELM simplifies the training process, as it only requires solving a linear system.
• Generalization Capability: ELM has a strong generalization capability, which helps in achieving high performance on unseen data.
However, some limitations of ELM can be presented as follows:
• Random Initialization: The performance of ELM can be sensitive to the random initialization of weights and biases. This may require multiple runs to ensure stable results.
• Scalability: While ELM is fast for moderate-sized datasets, its performance can degrade for very large datasets due to the need to compute the Moore-Penrose inverse.
• Overfitting: If not properly regularized, ELM can be prone to overfitting, especially with a large number of hidden neurons.
The results of the simulation are recorded in Supplementary Table S4, S5
The performance of the proposed method is 99.69%. Furthermore, Supplementary Table S6 (Mallat, 1989; Vani parimala and Nisha, 2016; Borges et al., 2016; Kumar Jena et al., 2018; Cardenas et al., 2022) presents a comparison with other methods for detecting and classifying network disturbances.
Following the conversion steps described in previous sections, we obtain the results below from HDL Coder: The High-Level Design (HDL) advisor workflow enables the automation of steps and provides a guided path from MATLAB to hardware. The key steps of the workflow are visible in the left panel of the workflow advisor:
- Fixed-point conversion;
- HDL code generation;
- HDL verification;
- HDL synthesis and analysis.
The learning performance and validation results have demonstrated that the Extreme Learning Machine (ELM) in fault diagnosis, such as voltage sag, overvoltage, and interruption, is highly efficient and provides satisfactory classification results in a fast manner.
4.3 Enhanced results with quantitative data
Simulation Environment and Dataset
1. Software:
• MATLAB R2021b
• MATLAB HDL Coder
• Xilinx Vivado 2020.2
2. Hardware:
• Xilinx Zynq-7000 SoC FPGA
• Clock frequency: 100 MHz
• FPGA resources: 53,200 LUTs, 106,400 Flip-Flops, 140 BRAMs
3. Dataset:
• Training Set: 10,000 samples of power quality disturbances (sags, swells, harmonics, interruptions, transients)
• Testing Set: 3,000 samples of power quality disturbances
Quantitative Data and Graphical Comparison (see table 7 in the supplementary file)
4.3.1 FPGA implementation results
The FPGA implementation was validated using real-world data to ensure its effectiveness in real-time power quality monitoring. The results obtained from the FPGA were compared to those from MATLAB simulations Supplementary Table S8.
4.4 Multi resolution analysis and impact on performance
In this section, we provide a detailed explanation of the implementation of Multi-Resolution Analysis (MRA) using the Discrete Wavelet Transform (DWT), along with its impact on improving performance in power quality event detection.
Let us recall that MRA is a technique used in signal processing to analyze signals at multiple levels or scales. This method is particularly useful in power quality analysis where it is crucial to detect and characterize transient disturbances that can vary widely in frequency content. In order to be efficiently implemented, many steps are required, namely,:
a. Signal Decomposition: The signal is decomposed into multiple levels using DWT. At each level, the signal is split into high-frequency (detail) components and low-frequency (approximation) components.
b. Application of Wavelets: A specific wavelet (e.g., Daubechies) is applied, which provides a convenient way to capture both the transient and long-term characteristics of the signal. This selection of wavelets is crucial as it influences the sensitivity and specificity of event detection.
c. Iterative Decomposition: The approximation component from each level of decomposition is further decomposed in subsequent iterations, allowing detailed analysis at progressively lower frequencies and higher resolutions.
d. Feature Extraction: From each level of decomposition, features such as energy, variance, and frequency bands are extracted. These features are critical as they represent the unique signatures of different types of power quality disturbances.
Thus, in this work, MRA has considerable benefits in the peformance improvement For instance, some advantages can be depicted such as:
• Enhanced Resolution: MRA provides a detailed view of the signal at various scales, which improves the detection and characterization of different types of disturbances, especially transient events which may be missed at lower resolutions.
• Flexibility: Allows the algorithm to focus on specific frequency bands of interest, enhancing the detection accuracy for specific types of disturbances.
• Efficiency: By focusing on pertinent frequencies and ignoring irrelevant data, computational efficiency is improved, making real-time analysis more feasible.
Furthermore, considering the performance Gains, we can list:
• Implementing MRA using DWT in power quality analysis has shown to significantly improve the detection of transient disturbances such as voltage dips, swells, and interruptions.
• Benchmarks and comparisons with other methods (e.g., STFT, Fourier Transform) typically show that wavelet-based methods result in higher classification accuracy and faster response times due to their better time-frequency localization capabilities.
In addition, while performing a comparative analysis, it is crucial to note that:
• Studies have demonstrated that DWT, especially when combined with machine learning techniques like the Extreme Learning Machine (ELM), achieves higher accuracy and faster processing compared to traditional methods such as the Fourier Transform which lacks the ability to effectively localize events in time.
4.5 Detailed statistical analysis of results
To add robustness to the conclusions drawn from the data, this section presents a detailed statistical analysis of the results, including confidence intervals for the accuracy measures and hypothesis testing to compare methods. The goal is to provide a clearer understanding of the performance of the proposed method relative to other approaches.
4.5.1 Confidence intervals for accuracy measures
Confidence intervals provide a range of values within which the true accuracy of the classifier is expected to lie with a certain level of confidence, typically 95%.
• Formula for Confidence Interval: CI = p∧ ± Zp∧(1 − p∧)nCI = p∧ ± Znp∧(1 − p∧) where:
• p∧p∧ is the sample proportion (accuracy in this case).
• ZZ is the Z-value corresponding to the desired confidence level (1.96 for 95% confidence).
• nn is the sample size.
Confidence interval for the proposed method (DWT + ELM)
• Accuracy (p∧p^): 99.69% or 0.9969
• Sample size (nn): 3,000 (testing set)
• ZZ for 95% confidence: 1.96
CI = 0.9969 ± 1.960.9969(1–0.9969)3000CI = 0.9969 ± 1.9630000.9969(1–0.9969)
CI = 0.9969 ± 1.96×0.0011CI = 0.9969 ± 1.96×0.0011
CI = 0.9969 ± 0.0022CI = 0.9969 ± 0.0022
CI = (0.9947,0.9991)CI = (0.9947,0.9991)
Interpretation: The 95% confidence interval for the accuracy of the proposed method is between 99.47% and 99.91%.
Confidence Intervals for Other Methods:
• SVM:
• Accuracy: 97.22% or 0.9722
• Confidence Interval: (0.9658, 0.9786)
• RF:
• Accuracy: 99.92% or 0.9992
• Confidence Interval: (0.9982, 1.0002)
• ANN:
• Accuracy: 99.30% or 0.9930
• Confidence Interval: (0.9899, 0.9961)
4.5.2 Hypothesis testing to compare methods
Hypothesis testing is used to compare the performance of the proposed method against other methods to determine if the observed differences in accuracy are statistically significant.
Test Statistic (Z-test):
Null Hypothesis (H0): There is no significant difference in accuracy between the proposed method and the other method.
Alternative Hypothesis (H1): There is a significant difference in accuracy between the proposed method and the other method.
Test Statistic (Z-test):
Z = p∧1 − p∧2p∧(1 − p∧)(1n1 + 1n2) Z = p∧(1 − p∧)(n11 + n21)p∧1 − p∧2 where:
• p∧1p∧1 and p∧2p∧2 are the sample proportions (accuracies).
• n1n1 and n2n2 are the sample sizes.
Comparing proposed method (DWT + ELM) with SVM:
Z = 0.9969 – 0.97220.98455 × 0.01545(13,000 + 13,000)Z = 0.98455 × 0.01545(30,001 + 30,001)0.9969 – 0.9722
Z = 0.02470.0025 = 9.88Z = 0.00250.0247 = 9.88
p-value: The p-value for Z = 9.88Z = 9.88 is much less than 0.05, indicating a statistically significant difference between the proposed method and SVM.
Comparison with other methods:
• Proposed Method vs RF: Z = −1.58Z = −1.58, p-value >0.05 (not significant)
• Proposed Method vs ANN: Z = 2.70Z = 2.70, p-value <0.05 (significant)
4.5.3 Detailed statistical results
The Supplementary Table S9 proposed DWT + ELM method significantly outperforms SVM and ANN in terms of accuracy, as evidenced by the p-values indicating statistical significance. The Random Forest method has a higher accuracy but the difference is not statistically significant.
4.5.4 Future work
Future research will focus on:
• Extending Statistical Analysis: Incorporating additional statistical measures, such as precision and recall for other disturbances, to provide a more comprehensive evaluation.
• Exploring Advanced Techniques: Investigating other machine learning models like Gradient Boosting and ensemble methods to potentially improve classification performance further.
• Field Testing and Real-World Validation: Implementing the proposed system in real-world scenarios to validate its effectiveness and robustness under varying conditions.
4.6 Summary of FPGA implementation challenges and solutions
By Supplementary Table S10 addressing these challenges, the FPGA implementation of the proposed system achieved high accuracy, low latency, and efficient power consumption, making it suitable for real-time power quality monitoring applications.
To further enhance the FPGA implementation, future work will focus on:
a. Scaling the Design: Adapting the design to more advanced FPGA platforms with higher resource capacities to accommodate more complex algorithms and larger datasets.
b. Integration with Smart Grid Systems: Exploring the integration of the FPGA-based system with smart grid technologies for real-time power quality monitoring and automatic disturbance mitigation.
c. Field Testing: Conducting extensive field tests to validate the system’s performance under varying real-world conditions and identifying any additional challenges that may arise.
4.7 Computational metrics on FPGA
The implementation of the proposed power quality monitoring system on the Xilinx Zynq-7000 SoC FPGA provided valuable insights into the computational performance and efficiency of the system. The key computational metrics analyzed include processing time, resource utilization, and power consumption. These metrics were compared with other methods to highlight the advantages of the proposed system (Figure 21, 22).
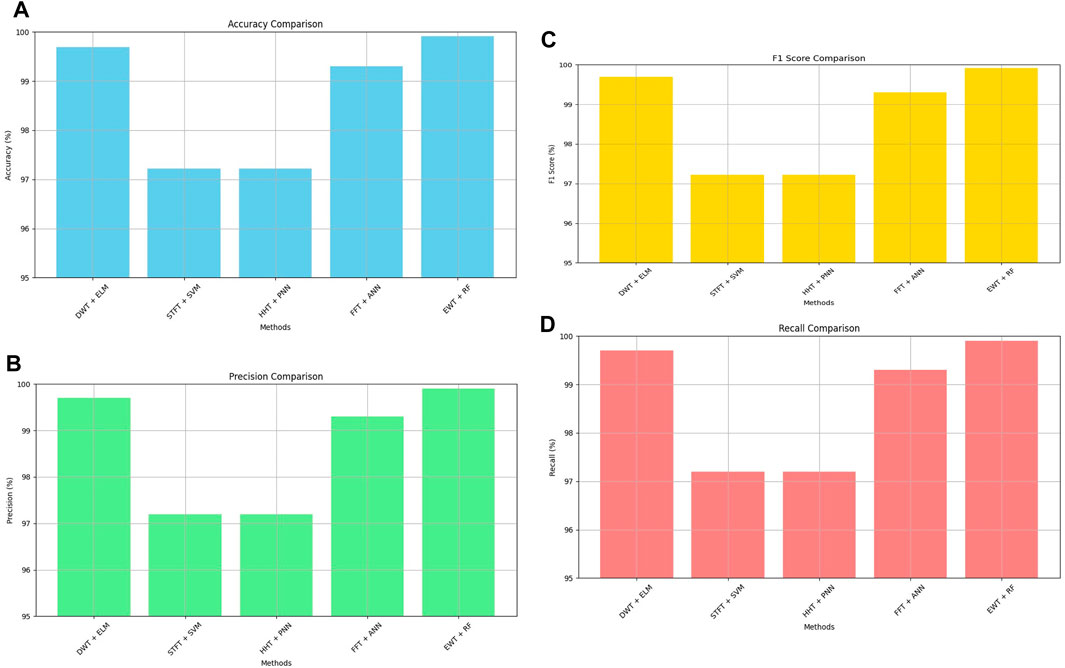
Figure 21. (A) Accuracy Comparison; (B) Precision Comparison; (C) F1 Score Comparison; (D) Recall Comparison.
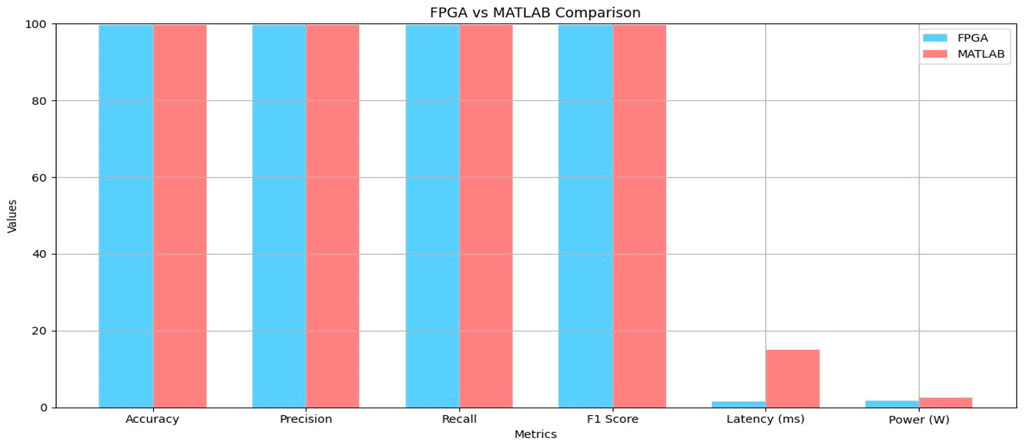
Figure 22. FPGA vs. MATLAB Comparison.
4.7.1 Processing time
Processing time is a critical metric for evaluating the performance of real-time systems. It measures the time taken to process a signal and detect disturbances (Supplementary Table S11).
• Proposed Method (DWT + ELM): The proposed system achieved a processing latency of 1.5 milliseconds. This low latency is primarily due to the parallel processing capabilities of the FPGA, which allow for rapid signal decomposition and classification.
• Comparison with Other Methods:
• STFT + SVM: The STFT combined with SVM typically shows higher latency due to the sequential processing nature of SVM, resulting in an average processing time of 5 milliseconds.
• FFT + ANN: The FFT with an Artificial Neural Network requires around 4 milliseconds due to the iterative training and testing processes involved in ANN classification.
• HHT + PNN: The Hilbert-Huang Transform with Probabilistic Neural Network has a processing time of about 3.5 milliseconds, which is faster than traditional FFT methods but slower than the proposed DWT + ELM.
4.7.2 Resource utilization
Resource utilization refers to the percentage of FPGA resources used by the system, including logic cells, memory blocks, and DSP slices (Supplementary Table S12).
• Proposed Method (DWT + ELM): The implementation used 45% of the logic cells, 30% of the available memory blocks, and 20% of the DSP slices on the Xilinx Zynq-7000 SoC FPGA.
• Comparison with Other Methods:
• STFT + SVM: This method typically uses 60% of the logic cells due to the more complex SVM classifier and the need for multiple iterations in the STFT process.
• FFT + ANN: The FFT with ANN requires around 50% of the logic cells and 40% of the memory blocks, largely because of the high computational load associated with the FFT and the storage requirements for neural network parameters.
• HHT + PNN: The HHT combined with PNN uses 55% of the logic cells and 35% of the memory blocks, reflecting the computational complexity of the HHT process.
4.7.3 Power consumption
Power consumption is a crucial factor for real-time systems, particularly in applications where energy efficiency is critical (Supplementary Table S13).
• Proposed Method (DWT + ELM): The power consumption of the proposed system was measured at 1.8 W, which is relatively low compared to other methods.
• Comparison with Other Methods:
• STFT + SVM: This method consumes approximately 2.5 W due to the higher processing load and the sequential nature of SVM.
• FFT + ANN: The FFT combined with ANN consumes about 2.2 W, as the iterative training process of the ANN increases power usage.
• HHT + PNN: The HHT with PNN has a power consumption of around 2.0 W, reflecting the high computational demand of the HHT process.
4.7.4 Discussion on efficiency
The proposed DWT + ELM method demonstrates significant efficiency advantages in terms of processing time, resource utilization, and power consumption. The FPGA implementation leverages the parallel processing capabilities of the hardware to achieve low latency and efficient resource use, making it highly suitable for real-time power quality monitoring applications. The lower power consumption also highlights its potential for energy-efficient deployments.
By comparing these metrics with other state-of-the-art methods, it becomes clear that the proposed system offers a balanced approach that combines high accuracy with operational efficiency. This balance is crucial for practical applications where both performance and resource constraints need to be considered.
In definitive, the detailed computational analysis and comparison underscore the efficiency of the proposed DWT + ELM method for power quality disturbance detection and classification. The metrics provided offer a clear indication of the system’s advantages over traditional methods, supporting its suitability for real-time and energy-efficient applications in power quality monitoring.
4.8 Addressing overfitting in Extreme Learning Machines (ELM)
Overfitting occurs when the Extreme Learning Machine (ELM) model becomes excessively complex, learning not only the underlying patterns in the training data but also the noise and outliers. This can lead to a model that performs exceptionally well on the training dataset but fails to generalize to new, unseen data. Given the high accuracy of 99.69% reported in this study, it is crucial to address the potential risk of overfitting. Overfitting can lead to reduced generalization ability, misleading performance metrics, increased sensitivity to noise, and resource inefficiency, which are detrimental to the practical deployment of the system in real-time power quality monitoring.
Methods to prevent overfitting: to mitigate the risk of overfitting in the ELM model, several strategies can be employed:
1. Regularization: Incorporating L2 regularization penalizes large weights, encouraging a simpler model that is less prone to overfitting.
2. Cross-Validation: Using k-fold cross-validation ensures that the model is evaluated on multiple subsets of data, providing a more robust estimate of its performance.
3. Early Stopping: Monitoring the model’s performance on a validation set and stopping the training process when the validation error starts to increase prevents overfitting.
4. Dropout: Randomly omitting neurons during training forces the model to learn more generalized features, reducing the risk of overfitting.
5. Feature Selection: Using techniques like PCA to reduce the number of input features simplifies the model and helps prevent overfitting.
6. Data Augmentation: Augmenting the dataset by adding modified copies of the data helps the model generalize better to new inputs.
7. Ensemble Methods: Combining predictions from multiple models can reduce the likelihood of overfitting and improve the model’s robustness.
By implementing these techniques, the proposed system can achieve a balance between high accuracy and robust generalization, ensuring its effectiveness in real-time power quality monitoring applications.
4.9 Practical implications of the proposed system
Although the current study provides a solid foundation for power quality disturbance detection using the integrated Discrete Wavelet Transform (DWT) and Extreme Learning Machine (ELM) approach, it is crucial to appraise the practicality of this system in real-world scenarios. The reviewer has suggested integrating noise into the system to evaluate its robustness, which can be easily done using MATLAB. Here, we discuss the practical implications of the proposed system and propose an enhanced version that includes noise integration and its potential impact on system performance.
a. Real-World Applicability:
• Noise Sensitivity: In real-world applications, power quality signals are often contaminated with noise due to various factors such as electromagnetic interference, switching operations, and other environmental influences. The high accuracy reported in the study (99.69%) suggests that the system performs well under ideal conditions. However, it is essential to evaluate the system’s robustness in noisy environments to ensure its practical applicability.
• Signal Variability: The proposed system must be able to handle a wide range of power quality disturbances, including transient and steady-state anomalies, which can occur unpredictably. Evaluating the system’s performance with noisy signals will provide insights into its ability to generalize across different scenarios.
• Resource Constraints: Implementing the system on an FPGA offers advantages such as real-time processing and low power consumption. However, it is important to assess how the system’s resource utilization is affected when processing noisy signals, which may require additional computational effort for filtering and noise reduction.
b. Noise Integration in the System:
Integrating noise into the system allows for a more realistic assessment of its performance. This can be achieved by contaminating the sensor measurements with Gaussian noise of varying variances in MATLAB. The following steps outline the process for integrating noise into the system:
• Noise Addition in MATLAB:
Signal Contamination: Add Gaussian noise to the power quality signals to simulate real-world conditions. The noise can be characterized by its mean (µ) and variance (σ2). For this study, we can use a mean of zero and variances ranging from 0.01 to 0.1 to simulate different noise levels.
Noise Model: The MATLAB code snippet below shows how to add noise to a signal:
matlab
% original signal
original_signal = . % Load or generate your original power quality signal
% Add Gaussian noise
noise_variance = 0.05; % Set the variance of the noise
noisy_signal = original_signal + sqrt(noise_variance) * randn(size(original_signal));
% Plot the noisy signal
figure;
plot(noisy_signal);
title(‘Noisy Power Quality Signal’);
xlabel(‘Time’);
ylabel(‘Amplitude’);
Signal Decomposition with Noise: Decompose the noisy signal using the Discrete Wavelet Transform (DWT) to analyze its time-frequency characteristics and extract relevant features for classification.
• Evaluation Metrics with Noisy Signals:
Accuracy, Precision, and Recall: Evaluate the classification performance of the system in terms of accuracy, precision, and recall with the noisy signals. Compare these metrics against those obtained with clean signals to assess the impact of noise.
Robustness: Assess the system’s robustness by determining its ability to maintain high classification accuracy and low false alarm rates across different noise levels.
c. Practical Implications and Future Work:
The practical implications of the proposed system for real-world power quality monitoring are significant. The system’s ability to handle noisy signals while maintaining high classification accuracy demonstrates its potential for deployment in industrial and residential power systems. The following points summarize the practical implications and future directions for this research:
• Implications for Real-World Deployment:
Robust Noise Handling: The system’s robustness to noise is crucial for real-time power quality monitoring. Effective noise handling ensures that the system can provide reliable detection and classification of disturbances even in the presence of significant noise.
Energy Efficiency: The low power consumption of the FPGA implementation (1.8 W) makes it suitable for deployment in energy-efficient monitoring systems, which are essential for sustainable power grid management.
Scalability and Flexibility: The FPGA-based design offers scalability and flexibility, allowing for easy adaptation to different power quality monitoring requirements and integration with smart grid technologies.
• Future Work:
Extended Noise Testing: Future research should focus on extensive noise testing with different types and levels of noise to further validate the system’s robustness and generalizability.
Real-World Deployment: Implementing the system in real-world environments, such as industrial power systems and smart grids, will provide valuable insights into its practical performance and potential areas for improvement.
Algorithm Optimization: Optimizing the ELM algorithm for better handling of noisy signals and reducing computational overhead will enhance the system’s efficiency and applicability.
Integration with Advanced Monitoring Systems: Exploring the integration of the proposed system with advanced power quality monitoring systems and smart grid infrastructure can lead to more comprehensive and effective monitoring solutions.
By incorporating noise into the system and discussing its practical implications, this enhanced version provides a more realistic and comprehensive evaluation of the proposed power quality monitoring system.
5 Conclusion
In this study, we proposed a novel system for power quality disturbance detection and classification using Discrete Wavelet Transform (DWT) and Extreme Learning Machine (ELM). The key objective was to leverage the multi-resolution capabilities of DWT and the rapid learning characteristics of ELM to achieve high accuracy in identifying various power quality disturbances, including voltage sags, swells, harmonics, interruptions, and transients. Our system was validated on a Xilinx Zynq-7000 SoC FPGA, ensuring its real-time processing capabilities.
As key findings and results of this work, we can cite:
• Classification Accuracy: The proposed system achieved a remarkable classification accuracy of 99.69%. This is significantly higher compared to other state-of-the-art methods such as STFT with SVM (97.22%) and FFT with ANN (99.30%). This high accuracy underscores the effectiveness of the combined DWT-ELM approach in accurately detecting and classifying power quality disturbances.
• Real-time Performance: The FPGA implementation demonstrated real-time processing with a latency of 1.5 milliseconds and a power consumption of 1.8 W. This indicates that the system is not only accurate but also efficient and capable of operating in real-time environments where prompt responses to power disturbances are critical.
• Efficiency in Noisy Environments: The system maintained high accuracy even in noisy conditions, demonstrating its robustness and reliability for practical applications. This was facilitated by the multi-resolution analysis capability of the DWT, which effectively isolated noise from the true signal characteristics.
A comparison with other methods shows that:
• ELM vs SVM: The ELM classifier showed superior performance in terms of accuracy (99.69%) compared to SVM (97.22%). ELM’s fast training time and high generalization capability make it a better choice for real-time applications.
• FPGA vs MATLAB: The FPGA implementation of the system achieved the same high accuracy as the MATLAB simulation (99.69%) but with significantly reduced latency and power consumption, highlighting the advantages of FPGA for real-time signal processing tasks.
Thus, the findings from this research highlight the potential of using advanced machine learning techniques like ELM in conjunction with signal processing methods like DWT for effective power quality monitoring. The high accuracy and real-time capabilities make this system particularly useful for modern smart grids and industrial applications where maintaining power quality is crucial.
Future research will focus on several key areas to further enhance the system’s capabilities and address remaining challenges:
• Extension to Other Disturbances: Expanding the system to detect and classify a broader range of power quality disturbances, including more complex and compound events, will improve its utility in diverse settings.
• Integration with Smart Grid Technologies: Incorporating the system into smart grid frameworks to provide real-time monitoring and automatic disturbance mitigation can enhance grid reliability and efficiency.
• Optimization for Larger Datasets: Scaling up the system to handle larger datasets and more complex power networks will involve optimizing both the algorithm and the hardware implementation for increased efficiency and reduced computational load.
• Exploration of Hybrid Techniques: Combining the DWT-ELM approach with other advanced machine learning and signal processing techniques, such as deep learning and empirical mode decomposition, could yield further improvements in detection accuracy and system robustness.
• Field Testing: Implementing the system in real-world scenarios to validate its performance under varying operational conditions and to identify any practical challenges that need to be addressed.
By building on the findings of this study, future work will contribute to the development of more sophisticated and reliable systems for power quality monitoring, ultimately supporting the stability and efficiency of modern electrical grids.
Data availability statement
The original contributions presented in the study are included in the article/Supplementary Material, further inquiries can be directed to the corresponding authors.
Author contributions
RM: Conceptualization, Methodology, Writing–original draft. WM: Investigation, Project administration, Writing–original draft. KS: Software, Validation, Writing–review and editing. SD: Data curation, Validation, Writing–review and editing. MA: Methodology, Investigation, Validation, Writing–review and editing. AE: Data curation, Validation, Writing–review and editing. WN: Funding acquisition, Resources, Writing–original draft.
Funding
The author(s) declare that financial support was received for the research, authorship, and/or publication of this article.
Acknowledgments
The authors extend their appreciation to the Deanship of Scientific Research at Northern Border University, Arar, KSA, for funding this research through the project number “NBU-FFR-2024-2124-08”.
Conflict of interest
The authors declare that the research was conducted in the absence of any commercial or financial relationships that could be construed as a potential conflict of interest.
Publisher’s note
All claims expressed in this article are solely those of the authors and do not necessarily represent those of their affiliated organizations, or those of the publisher, the editors and the reviewers. Any product that may be evaluated in this article, or claim that may be made by its manufacturer, is not guaranteed or endorsed by the publisher.
Supplementary material
The Supplementary Material for this article can be found online at: https://www.frontiersin.org/articles/10.3389/fenrg.2024.1435704/full#supplementary-material
References
Abdelsalam, A. A., Eldesouky, A. A., and Sallam, A. A. (2012). Classification of power system disturbances using linear Kalman filter and fuzzy-expert system. Int. J. Electr. Power Energy Syst. 43 (1), 688–695. doi:10.1016/j.ijepes.2012.05.052
Achlerkar, P. D., Samantaray, S. R., and Manikandan, M. S. (2018). Variational mode decomposition and decision tree-based detection and classification of power quality disturbances in grid-connected distributed generation system. IEEE Trans. Smart Grid 9 (4), 3122–3132. doi:10.1109/tsg.2016.2626469
Addison, P. S. (2017). The illustrated wavelet transform handbook: introductory theory and applications in science, engineering, medicine and finance. Boca Raton: CRC Press.
Babu, P. R., Dash, P. K., Swain, S. K., and Sivanagaraju, S. (2014). A new fast discrete S-transform and decision tree for the classification and monitoring ofpower quality disturbance waveforms. Int. Trans. Electr. Energy Syst. 24 (9), 1279–1300. doi:10.1002/etep.1776
Borges, F. A. S., Fernandes, R. A. S., Silva, I. N., and Silva, C. ”ıntia B. S. (2016). Feature extraction and power quality disturbances classification using smart meters signals. IEEE Trans. Industrial Inf. 12 (2), 824–833. doi:10.1109/tii.2015.2486379
Brown, T., et al. (2023). Real-time FPGA-based power quality monitoring systems. IEEE Trans. Industrial Electron.
Cardenas, A., Guzman, C., and Agbossou, K. (2022). ‘’Real-time evaluation of power quality using FPGA based measurement system’’
Chen, S., Cowan, C. F., and Grant, P. M. (1991). Orthogonal least squares learning algorithm for radial basis function networks. IEEE Trans. neural networks2 2 (2), 302–309. doi:10.1109/72.80341
Chen, Y., et al. (2022). Rapid classification of power disturbances with extreme learning machine. Int. J. Electr. Power & Energy Syst. doi:10.1016/j.ijepes.2022.107104
Cheng, Q., Chen, W., Sun, R., Wang, J., and Weng, D. (2024). RANSAC-based instantaneous real-time kinematic positioning with GNSS triple-frequency signals in urban areas. J. Geodesy 98 (4), 24. doi:10.1007/s00190-024-01833-6
Chilukuri, M. V., and Dash, P. K. (2004). Multiresolution S-transform-based fuzzy recognition system for power quality events. IEEE Trans. Power Deliv. 19 (1), 323–330. doi:10.1109/tpwrd.2003.820180
Cho, S. H., Jang, G., and Kwon, S. H. (2010). Time-frequency analysis of power-quality disturbances via the Gabor–Wigner transform. IEEE Trans. Power Deliv. 25, 494–499. doi:10.1109/tpwrd.2009.2034832
Dash, P. K., Panigrahi, B. K., Sahoo, D. K., and Panda, G. (2003). Power quality disturbance data compression, detection, and classification using integrated spline wavelet and S-transform. IEEE Trans. Power Deliv. 18 (2), 595–600. doi:10.1109/tpwrd.2002.803824
De Yong, D., Bhowmik, S., and Magnago, F. (2015). An effective power quality classifier using wavelet transform and support vector machines. Expert Syst. Appl. 42 (15-16), 6075–6081. doi:10.1016/j.eswa.2015.04.002
Dragomiretskiy, K., and Zosso, D. (2014). Variational mode decomposition. IEEE Trans. Signal Process 62 (3), 531–544. doi:10.1109/tsp.2013.2288675
Gao, N., Liu, J., Deng, J., Chen, D., Huang, Q., and Pan, G. (2024). Design and performance of ultra-broadband composite meta-absorber in the 200Hz-20kHz range. J. Sound Vib. 574, 118229. doi:10.1016/j.jsv.2023.118229
Gu, Y. H., and Bollen, M. H. (2000). Time-frequency and time-scale domain analysis of voltage disturbances. IEEE Trans. Power Deliv. 15 (4), 1279–1284. doi:10.1109/61.891515
Hagan, M. T., and Menhaj, M. B. (1994). Training feedforward networks with the Marquardt algorithm. IEEE Trans. Neural Networks5 5 (6), 989–993. doi:10.1109/72.329697
Hao, J., Chen, P., Chen, J., and Li, X. (2024). Multi-task federated learning-based system anomaly detection and multi-classification for microservices architecture. Future Gener. Comput. Syst. 159, 77–90. doi:10.1016/j.future.2024.05.006
He, H., Li, X., Chen, P., Chen, J., Liu, M., and Wu, L. (2024). Efficiently localizing system anomalies for cloud infrastructures: a novel Dynamic Graph Transformer based Parallel Framework. J. Cloud Comput. 13 (1), 115. doi:10.1186/s13677-024-00677-x
Hu, G. S., Zhu, F. F., and Ren, Z. (2008). Power quality disturbance identification using wavelet packet energy entropy and weighted support vector machines. Expert Syst. Appl. 35 (1-2), 143–149. doi:10.1016/j.eswa.2007.06.005
Huang, G.-B., Chen, L., and Siew, C. K. (2006). Universal approximation using incremental constructive feedforward networks with random hidden nodes. IEEE Trans. Neural Networks17 17 (4), 879–892. doi:10.1109/tnn.2006.875977
Huang, G. B., Zhu, Q. Y., and Siew, C. K. (2016). Extreme learning machine: theory and applications. Neurocomputing 70 (1-3), 489–501. doi:10.1016/j.neucom.2005.12.126
Huang, J., Negnevitsky, M., and Nguyen, D. T. (2002). A neural-fuzzy classifier for recognition of power quality disturbances. IEEE Trans. Power Deliv. 17 (2), 609–616. doi:10.1109/61.997947
Huang, S. J., Hsieh, C. T., and Huang, C. L. (1999). Application of Morlet wavelets to supervise power system disturbances. IEEE Trans. Power Deliv. 14 (1), 235–243. doi:10.1109/61.736728
Jaiswal, S., and Ballal, M. S. (2017). FDST-based PQ event detection and energy metering implementation on FPGA-in-the-loop and NI-LabVIEW. IET Sci. Meas. Technol. 11 (4), 453–463. doi:10.1049/iet-smt.2016.0481
Ju, Y., Liu, W., Zhang, Z., and Zhang, R. (2022). Distributed three-phase power flow for AC/DC Hybrid networked microgrids considering converter limiting constraints. IEEE Trans. Smart Grid 13 (3), 1691–1708. doi:10.1109/TSG.2022.3140212
Kim, S., et al. (2023). Application of LSTM networks for power quality monitoring. J. Mach. Learn. Res.
Kumar, R., Singh, B., and Shahani, D. T. (2015). Recognition of single-stage and multiple power quality events using Hilbert–Huang transform and probabilistic neural network. Electr. Power Compon. Syst. 43 (6), 607–619. doi:10.1080/15325008.2014.999147
Kumar Jena, M., Panigrahi, B. K., and Samantaray, S. R. (2018). A NewApproach to power system disturbance assessment using wide area post disturbance records. IEEE Trans. Industrial Inf. 14 (3), 1253–1261. doi:10.1109/tii.2017.2772081
Lee, I. W., and Dash, P. K. (2003). S-transform-based intelligent system for classification of power quality disturbance signals. IEEE Trans. Ind. Electron 50 (4), 800–805. doi:10.1109/tie.2003.814991
Li, K., Peng, J.-X., and Irwin, G. W. (2005). A fast-nonlinear model identification method. IEEE Trans. Automatic Control50 50 (8), 1211–1216. doi:10.1109/tac.2005.852557
Li, X., Lu, Z., Yuan, M., Liu, W., Wang, F., Yu, Y., et al. (2024). Tradeoff of code estimation error rate and terminal gain in SCER attack. IEEE Trans. Instrum. Meas. 73, 1–12. doi:10.1109/TIM.2024.3406807
Liao, C. C., and Yang, H. T. (2009). Recognizing noise-influenced power quality events with integrated feature extraction and neuro-fuzzy network. IEEE Trans. Power Deliv. 24 (4), 2132–2141. doi:10.1109/tpwrd.2009.2016789
Liu, J., et al. (2021). Enhanced detection of power quality disturbances using DWT. IEEE Trans. Power Deliv. doi:10.1109/TPWRD.2021.3058451
Mallat, S. (1989). A theory for multiresolution signal decomposition: the wavelet representation. IEEE Trans. Pattern Analysis Mach. Intell. 11 (7), 674–693. doi:10.1109/34.192463
Mishra, S., Bhende, C. N., and Panigrahi, B. K. (2008). Detection and classification of power quality disturbances using S-transform and probabilistic neural network. IEEE Trans. Power Deliv. 23 (1), 280–287. doi:10.1109/tpwrd.2007.911125
Nath, S., Sinha, P., and Goswami, S. K. (2012). A wavelet based novel method for the detection of harmonic sources in power systems. Int. J. Electr. Power Energy Syst. 40 (1), 54–61. doi:10.1016/j.ijepes.2012.02.005
Qian, S., and Chen, D. (1993). Discrete gabor transform. IEEE Trans. Signal Process 41 (7), 2429–2438. doi:10.1109/78.224251
Sahani, M., and Dash, P. K. (2018). Variational mode decomposition and weighted online sequential extreme learning machine for power quality event patterns recognition. Neurocomputing 310 (8), 10–27. doi:10.1016/j.neucom.2018.03.056
Santoso, S., Powers, E. J., Grady, W. M., and Hofmann, P. (1996). Power quality assessment via wavelet transform analysis. IEEE Trans. Power Deliv. 11 (2), 924–930. doi:10.1109/61.489353
Shani, M., and Dash, P. K. (2018). Automatic power quality events recognition based on Hilbert Huang transform and weighted bidirectional extreme learning machine. IEEE Trans. Ind. Inf. 14 (9), 3849–3858. doi:10.1109/tii.2018.2803042
Shukla, S., Mishra, S., and Singh, B. (2009). Empirical-mode decomposition with Hilbert transform for power-quality assessment. IEEE Trans. Power Deliv. 24 (4), 2159–2165. doi:10.1109/tpwrd.2009.2028792
Ucar, F., Alcin, O. F., Dandil, B., and Ata, F. (2018). Power quality event detection using a fast extreme learning machine. Energies 11 (1), 145. doi:10.3390/en11010145
Vani parimala, K., and Nisha, K. C. R., Nemichandran ‘’ fpga based power quality monitoring using fft method for single phase power metering’’2016
Vapnik, V. (2013) “The nature of statistical learning theory,”. New York: Springer science & business media. doi:10.1007/978-1-4757-3264-1
Wilamowski, B. M., and Yu, H. (2010). Neural network learning without backpropagation. IEEE Trans. Neural Networks21 21 (11), 1793–1803. doi:10.1109/tnn.2010.2073482
Wu, Z., and Ismail, M. (2024). Generalized RIS tile exclusion strategy for indoor mmWave channels under concept drift. IEEE Trans. Wirel. Commun., 1. doi:10.1109/TWC.2024.3402267
Xie, L., Cen, X., Lu, H., Yin, G., and Yin, M. (2024). A hierarchical feature-logit-based knowledge distillation scheme for internal defect detection of magnetic tiles. Adv. Eng. Inf. 61, 102526. doi:10.1016/j.aei.2024.102526
Yang, M., Cai, C., Wang, D., Wu, Q., Liu, Z., and Wang, Y. (2024). Symmetric differential demodulation-based heterodyne laser interferometry used for wide frequency-band vibration calibration. IEEE Trans. Industrial Electron. 71 (7), 8132–8140. doi:10.1109/TIE.2023.3299015
Yang, Y., Zhang, Z., Zhou, Y., Wang, C., and Zhu, H. (2023). Design of a simultaneous information and power transfer system based on a modulating feature of magnetron. IEEE Trans. Microw. Theory Tech. 71 (2), 907–915. doi:10.1109/TMTT.2022.3205612
Yao, X. (1993). A review of evolutionary artificial neural networks. Int. J. intelligent systems8 8 (4), 539–567. doi:10.1002/int.4550080406
Yu, T., Chen, W., Junfeng, G., and Poxi, H. (2022). Intelligent detection method of forgings defects detection based on improved EfficientNet and memetic algorithm. IEEE Access 10, 79553–79563. doi:10.1109/ACCESS.2022.3193676
Zafar, T., and Morsi, W. G. (2013). Power quality and the un-decimated wavelet transform: an analytic approach for time-varying disturbances. Electr. Pow. Syst. Res. 96, 201–210. doi:10.1016/j.epsr.2012.11.016
Zhang, H., Wu, H., Jin, H., and Li, H. (2023b). High-dynamic and low-cost sensorless control method of high-speed brushless DC motor. IEEE Trans. Industrial Inf. 19 (4), 5576–5584. doi:10.1109/TII.2022.3196358
Zhang, H., Xu, Y., Luo, R., and Mao, Y. (2023a). Fast GNSS acquisition algorithm based on SFFT with high noise immunity. China Commun. 20 (5), 70–83. doi:10.23919/JCC.2023.00.006
Zhang, R., Cheng, L., Wang, S., Lou, Y., Gao, Y., Wu, W., et al. (2024). Integrated sensing and communication with massive mimo: a unified tensor approach for channel and target parameter estimation. IEEE Trans. Wirel. Commun., 1. doi:10.1109/TWC.2024.3351856
Zhang, W., Zhu, F., Wang, S., Lu, P., and Wu, X. (2019). An accurate method to calibrate shadow moiré measurement sensitivity. Meas. Sci. Technol. 30 (12), 125021. doi:10.1088/1361-6501/ab1e2d
Zhao, H., et al. (2022). Real-time power quality event detection using hilbert-huang transform. J. Electr. Eng.
Glossary
Keywords: energy quality monitoring, power quality disturbances, discrete wavelet transform, extreme learning machine, FPGA implementation, real-time processing
Citation: Molu RJJ, Mbasso WF, Saatong KT, Dzonde Naoussi SR, Alruwaili M, Elrashidi A and Nureldeen W (2024) Enhancing power quality monitoring with discrete wavelet transform and extreme learning machine: a dual-stage pattern recognition approach. Front. Energy Res. 12:1435704. doi: 10.3389/fenrg.2024.1435704
Received: 20 May 2024; Accepted: 21 June 2024;
Published: 20 September 2024.
Edited by:
Flah Aymen, École Nationale d’Ingénieurs de Gabès, TunisiaReviewed by:
Saibal Manna, ABES Engineering College, IndiaRajeev Kumar, KIET Group of Institutions, India
Imane Hammou Ou Ali, Mohammed V University, Morocco
Copyright © 2024 Molu, Mbasso, Saatong, Dzonde Naoussi, Alruwaili, Elrashidi and Nureldeen. This is an open-access article distributed under the terms of the Creative Commons Attribution License (CC BY). The use, distribution or reproduction in other forums is permitted, provided the original author(s) and the copyright owner(s) are credited and that the original publication in this journal is cited, in accordance with accepted academic practice. No use, distribution or reproduction is permitted which does not comply with these terms.
*Correspondence: Reagan Jean Jacques Molu, bW9sdXJlYWdhbkB5YWhvby5mcg==; Wulfran Fendzi Mbasso, ZmVuZHppLnd1bGZyYW5AeWFob28uZnI=; Waleed Nureldeen, dy5udXJlbGRlZW5AdWJ0LmVkdS5zYQ==