 Belqasem Aljafari
 S. Devakirubakaran
 Praveen Kumar Balachandran
 Sudhakar Babu Thanikanti
- 1Department of Electrical Engineering, College of Engineering, Najran University, Najran, Saudi Arabia
- 2Center for Nonlinear Systems, Chennai Institute of Technology, Chennai, Tamil Nadu, India
- 3Department of Electrical, Electronic and Systems, Faculty of Engineering and Built Environment, Universiti Kebangsaan Malaysia, Selangor, Malaysia
- 4Department of Electrical and Electronics Engineering, Chaitanya Bharathi Institute of Technology, Hyderabad, India
There has been a global expansion of solar electricity during the past decades. Solar photovoltaic (PV) electricity generation is not only simple but also environmentally benign and cost-effective. This is the most affordable and suitable power source for rural areas. The PV power output is unavoidably suppressed when there is partial shade. There were numerous maximum power point tracking (MPPT), arrays, and reconfiguration approaches that were available earlier. The authors have previously described an L-shaped propagating array arrangement. The L-shaped configuration creates the PV rows based on the chess game coin. The knight coin of this game will move in the shape of “L,” which inspired new array configurations. This work discusses the hybridization of the L-shaped configuration with the conventional array configurations. The proposed hybrid L-shaped configuration has been developed in MATLAB/Simulink, where the conventional configuration and the hybrid configurations are validated under different test conditions. The test conditions are created based on the all possible real-word shading patterns. The power generation, mismatch losses, and characteristic curves were attained for each method, and this work presents all these validations with the inferences. In addition, the justification for the suitable array configuration with.
1 Introduction
Innovations in the generation of renewable energy provide a solution to the problem of carbon emissions and depletion of fossil fuels (Viebahn et al., 2015; Bryant et al., 2024; Wang et al., 2024). When it comes to development, renewable energy sources with simple harvesting procedures and low harvesting costs are generally selected. In comparison to alternative sources, such as direct implementation and rural electrification, solar energy conversion (SEC) has few negative aspects. Photovoltaics and solar thermal conversion are the two methods that SEC systems use to collect. One of the most effective and environmentally friendly methods for electrification in rural areas is solar photovoltaic conversion. Utilizing the photovoltaic effect, solar photovoltaic (PV) systems are able to convert sunlight into electrons (Yang et al., 2020). Different kinds of PV panels are commercially used and are categorized based on the material, like poly or mono crystalline (Aghaei et al., 2020).
PV cells are organized in arrays according to the amount of power required. Series–parallel and module interaction are used to classify array topologies. In array construction, the most important concern is the mismatch losses (MLs). The variations in power generation between PV modules are the root cause of this mismatch loss. Furthermore, photovoltaic (PV) systems are susceptible to a variety of issues, including the occurrence of shading, diode failure, burning of strings, and panel aging, which generate mismatch losses across PV array rows (Prince Winston et al., 2020a; Lappalainen and Valkealahti, 2017a; Lappalainen and Valkealahti, 2017b). The power requirement and panel arrangement haves an impact on the power output from PV arrays. Due to power shading, certain PV rows generate rated power, while shaded rows generate less power. The power difference between healthy and defective PV rows is known as mismatch loss. When the PV system is connected with the grid as on grid PV integration, it would affect the stability of the grid when PV experiences more MLs (Prasad et al., 2022). Various solutions are being investigated in order to minimize mismatch losses. Earlier versions of maximum power point tracking (MPPT) used perturb and observation. Subsequently, approaches for incremental conductance MPPT were established eventually. In contrast, photovoltaic (PV) systems that are partially shaded produce uneven characteristic curves (Aljafari et al., 2023; Ramana et al., 2019). These curves would have multiple spikes, which make the MPPT track the exact maximum power point (MPP). Most of the MPPT algorithms generate MPPs that are inefficient. For improving the performance, MPPT makes use of soft computing and optimization. The researchers utilized different computation algorithms like optimization methods, machine learning, and reinforcement learning for improving the tracking ability (Mohapatra et al., 2017). The attempt to track the MPPT fails in tracking the actual MPP in challenging situations. Another disadvantage of the MPPT is that shade cannot be distributed throughout the PV array. PV reconfiguration is another solution used for this ML reduction (Prince Winston et al., 2020a; Srinivasan et al., 2020; Alwar et al., 2022). For dispersing the shading over an array, this makes use of dynamic switching circuits to change the interconnections between PV modules (Thanikanti et al., 2023). Since it makes use of sensors, switches, and several other controls, this technology is quite expensive (Durango-Flórez et al., 2022; Babu et al., 2018). For compensating mismatch power, external power compensation sources are connected across the PV rows (Prince Winston et al., 2020b). This method nullifies the ML caused by various factors. The implementation of these compensation methods requires complex control algorithms, high-performance converters, and is also very expensive.
It is general to use an array configuration in the generation of the required demand of power with required specifications. The way the array is structured determines whether the amount of partial shadowing is reduced or increased. Series, parallel, and series–parallel configuration approaches are the traditional array configurations used widely in PV applications (Devakirubakaran et al., 2023; Pendem and Mikkili, 2018; Aljafari et al., 2024). On the other hand, these array arrangements do not come with partial shade effect dispersing capabilities. When photovoltaic modules are connected in a dynamic way, where they dynamically change their interconnections, the amount of power generated increases. In the earlier stages of the development of the total cross-tied (TCT) array, the construction provided a tie between each string of series–parallel connections. Under these circumstances, the shaded panel effect that could occur in series connections is mitigated. When a row is completely blocked out, extreme power loss is caused. This phenomenon results in reduced power-generating ability. Array configurations such as competent square, dominating square, skyscraper, magic square pattern-based, SuDoKu, Futoshiki, honeycomb, and bridge-linked can be utilized to developed an advanced method to TCT in the reduction of mismatch losses (Mohammadnejad et al., 2016). In each type of the array configuration, the logic employed is different. The logics may come with their own mathematical formulation with the constraints. The honeycombs are the inspiration behind the design of the PV string connections, which are made to look like honeycombs. During the process of constructing a bridge-linked array, photovoltaic strings are linked to one another through the use of a bridge connection. The PV array is constructed by the utilization of number-based problem-solving strategies, such as SuDoKu and Futoshiki (Dhanalakshmi and Rajasekar, 2018a; Sagar et al., 2020; Ye et al., 2023). Arrays of magic squares are defined by the sums of the numbers in the rows, columns, and diagonals being equal to one another. After making a few minor adjustments in its structure, the squares that are competent and dominant are framed (Dhanalakshmi and Rajasekar, 2018b; Ramasamy et al., 2022; Devakirubakaran and Bharatiraja, 2023; Ramasamy et al., 2023). The movement of the chess knight coin served as the inspiration for the L-shaped propagation array row structure (Srinivasan et al., 2021). Additionally, the spiral pattern array was developed at the same time that the nodes were being built (Cherukuri et al., 2021). These are the most common and up-to-date combinations of array setup methods. When a new logic is implemented, a significantly greater reduction in system mismatch loss can be accomplished. Though the configurations are performing well in some scenarios, it cannot mitigate MLs in some complex scenarios. By introducing the new logics/rules with the consideration of effective ML mitigation, smoother operation can be achieved. In this work, a new kind of hybrid L-shaped configuration is proposed and implemented in different conventional methods, and the performance has been validated. The contribution of this work is as follows.
• The proposed L-shaped array configuration provides a unique logic to replace the panel interconnection in a PV array in order to minimize the mismatch losses.
• In some common shading scenarios, the complete L-shaped configuration is not required, where the L-shaped configuration can be integrated with the conventional series–parallel and other methods.
• This integration reduces the required number of wires for establishing L-shaped configuration.
• The integration of the L-shaped method with the conventional method can improve the performance of PV arrays under the partial shading conditions.
• A detailed validation has been carried out in different possible shading patterns, and the results with inferences are presented in the manuscript.
The work has been organized as follows: Section 2 discusses the proposed array methodology. Section 3 discusses the construction of the PV system under different methods and simulation analyses. Section 4 validates the performance of the proposed method by using an experimental setup.
2 Proposed methodology
The proposed array configuration combines the advantages of conventional and recently developed array configurations. The authors already proposed the L-shaped propagated array configuration (LsPAC), which is further extended in this work (Srinivasan et al., 2021). This kind of array configuration technique follows the movement of the knight coin in the chess game. The starting node will be the first position of the PV module in the corresponding PV rows. This pattern allows the PV array to be constructed with the PV rows having unique PV modules. If the L-shaped pattern selects one module, then no other PV modules will be repeated in the corresponding rows and columns. The row formation of this array configuration considered the number of columns in the PV row to define the row propagation factor. This configuration’s propagation factor is given in Equations 1 and 2. The proposed hybrid configuration has been validated on the 9 x 9 configuration, which contains an odd number of columns. The row formation will take Equation 1 to find the row L-shaped propagation, as given in Equation 3
Various steps for obtaining the row formation are as follows.
1. Define the number of L-shaped propagation = (no of column-1) = 9–1 = 8
2. Obtain the PgF.
3. Calculate and obtain the PV row from j to (j + PPgF) and (j-PPgF) to j
4. Find,
If, RF > n, then go for RFnew as,
RFnew = RF–no of rows.
The row formations of the 9 × 9 PV using Equations 1–3 are obtained by the steps given above, and the corresponding formation is given in Table 1.
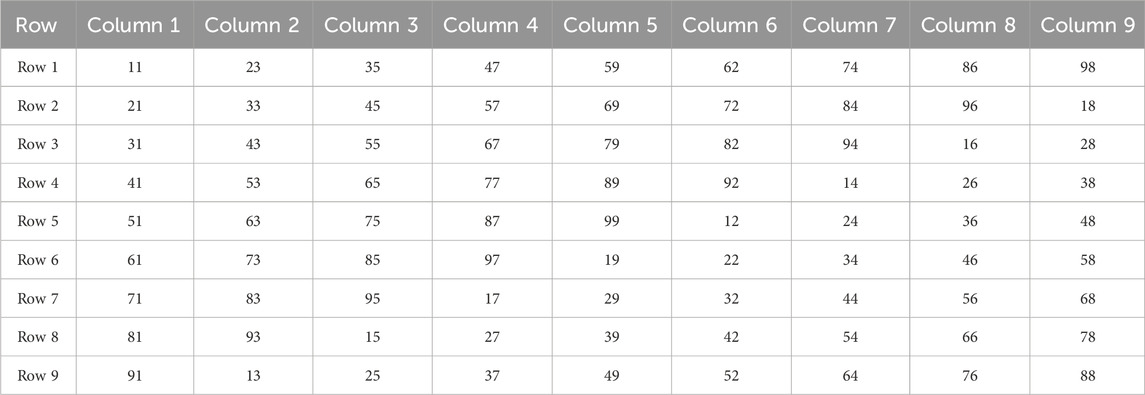
Table 1. LsP attained for a 9 × 9 PV array.
Figure 1 depicts the construction of the LsP PV array configuration. The row creation and array formation of the LsP PV array are shown in Figures 1A, B.
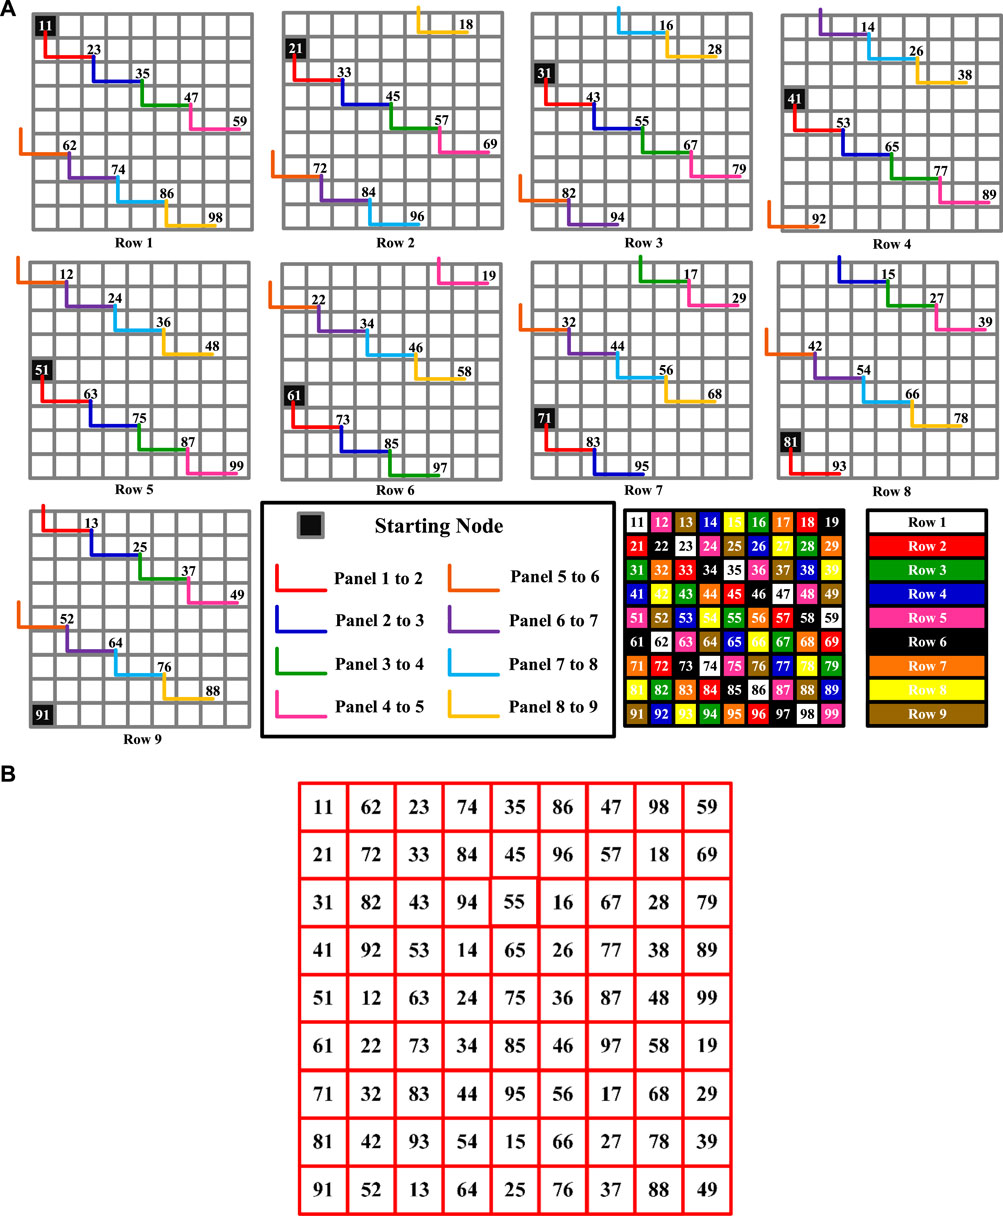
Figure 1. (A) Row creation of the LsP configuration. (B) 9 × 9 PV array with LsP.
This work is based on the concept of creating a hybrid configuration by combining the LsPAC with conventional array configurations. These configurations include the series–parallel configuration (SPC), the bridge-linked configuration (BLC), the honeycomb configuration (HCC), and the total cross-tied configuration (TCTC). A representation of the actual array structure of the standard array configurations that were discussed earlier is shown in Figure 2.
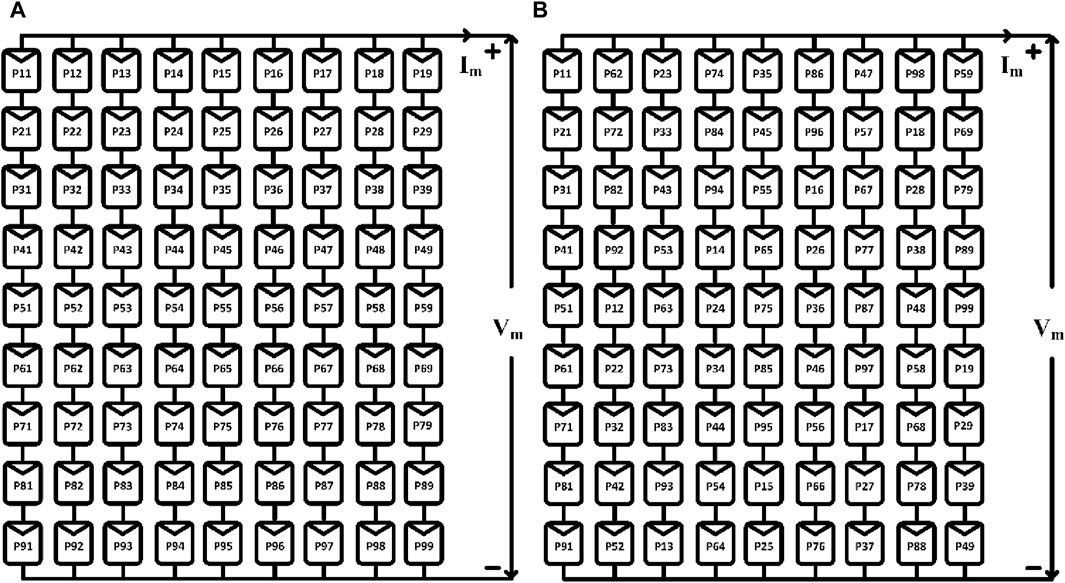
Figure 2. (A) Conventional Se-P configuration. (B) Proposed hybrid L-Se-P configuration.
In particular, Figure 2A depicts the hybrid L-shaped series–parallel configuration (L-SPC), which is a design in which the panel positions are selected by the exploitation of the L-shaped propagation, and the interconnection is made in line with the SPC. As shown in Figures 3–5, the L-shaped bridge-linked configuration (L-BLC), the L-shaped honeycomb configuration (L-HCC), and the L-shaped total cross-tied configuration (L-TCTC) are all of the same shape and have the same outline.
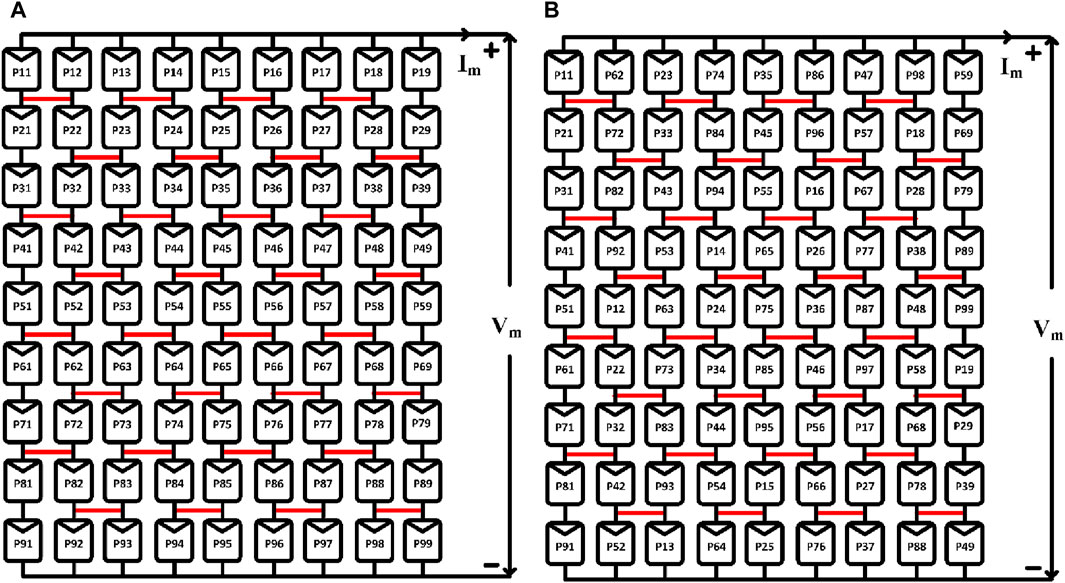
Figure 3. (A) Conventional BL configuration. (B) Proposed hybrid L-BL configuration.
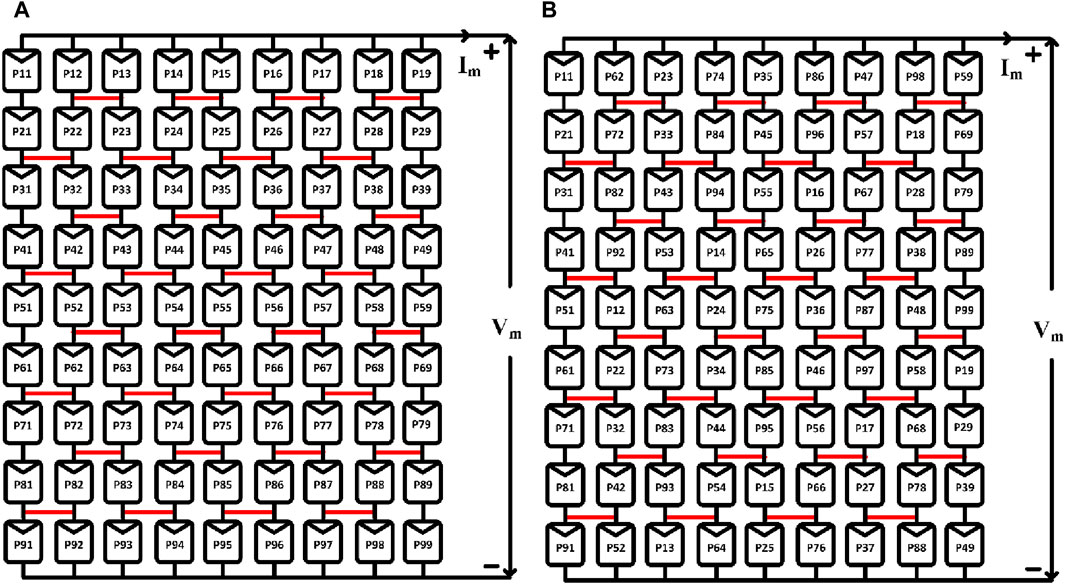
Figure 4. (A) Conventional HC configuration. (B) Proposed hybrid L-HC configuration.
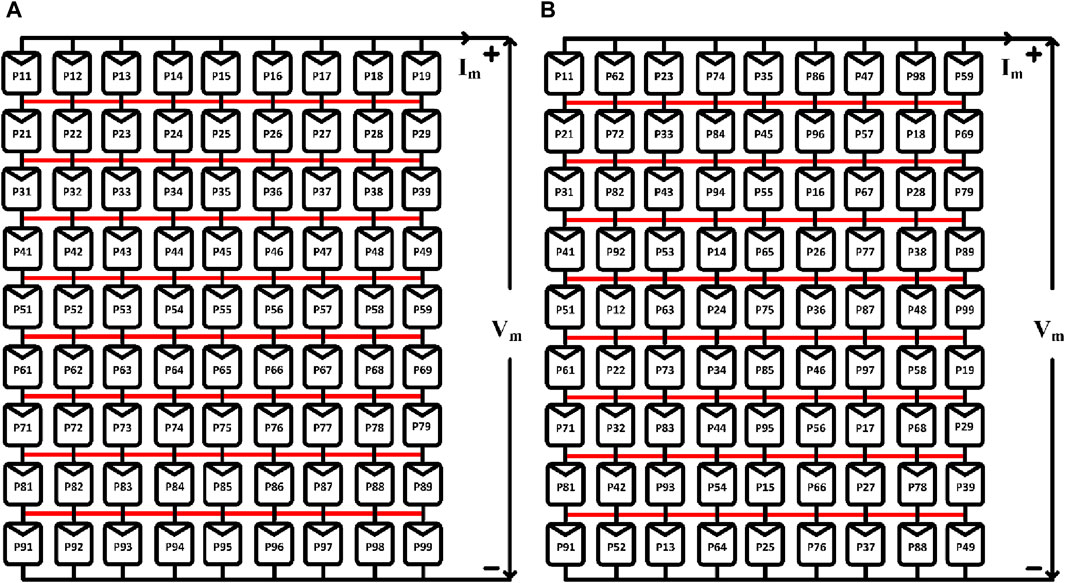
Figure 5. (A) Conventional TCT configuration. (B) Proposed hybrid L-TCT configuration.
3 System design
The number of photons incident on the PV cell surface defines the rate of generation in the PV current where it can be denoted as Equation 4 (Nguyen and Nguyen, 2015), (Ma et al., 2019).
The voltage is added in series, and the current is added in parallel on the same connection of the PV cell connected as an array.
When many cells are connected in series and an individual PV module is impacted by the partial shade, it operates with the lowest current. This current will be available at the output of the circuit based on Equation 5. The shaded panel will decrease the whole row’s current. The mismatch losses between the rows under the uneven irradiation are given in Equation 6.
The power conversion efficiency of the proposed array configuration is calculated as the ratio between the actual power generation of the PV system to the rated power output. It can be expressed as Equation 7.
This work aims to decrease the power loss in order to increase the power conversion rate. As illustrated in Figure 6, the proposed arrangement and traditional configurations are built in a 9 × 9 array using MATLAB/Simulink®. The mathematical model of the single-diode model PV cell is used for the construction of the PV panel in Simulink. The 9 x 9 PV array has been constructed in all 10 kinds of PV array configurations to validate the performance.
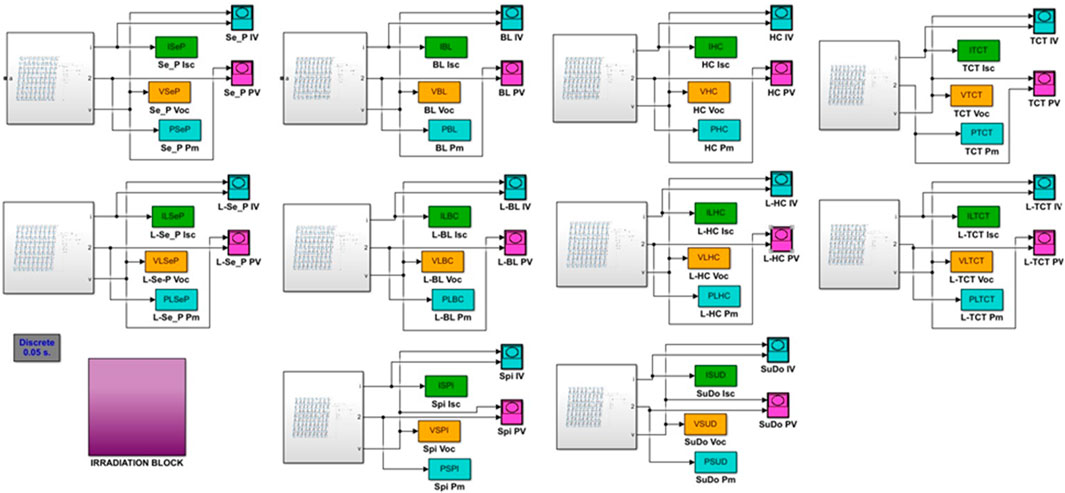
Figure 6. Simulink model of 9 × 9 PV array structures of various array topologies.
For the analysis, the following array configurations were used: SuDoKu puzzle pattern-based array configuration (SuPC), spiral array configuration (SpiC), BLC, HCC, TCTC, L-SPC, L-BLC, L-HCC, and L-TCTC. The X_Y plotter has been used to plot the characteristic curve of each validation scenario. The current and voltage were measured by incorporating a variable load across the PV array in each case. This load varies from zero resistance to maximum load resistance, which gives the value of minimum current to maximum current, and based on these measured current and voltage values, the power generation with respect to each load resistance will be obtained. These values are plotted using the X–Y plotter for plotting the characteristic curves in each validation.
The mismatch loss generation in each scenario can be improved with the proposed array configuration. For example, the 3 × 3 PV array, where the first row receives 200 W/m2, 200 W/m2, and 200 W/m2, and the remaining panels in the second and third rows receive 900 W/m2. The conventional TCT configuration has been operated with high mismatch losses. The first row limits the performance of the second and third rows. The mathematical expressions of each row are given as follows.
For the SPC method, the string current and total current are as follows:
The total current of the SPC is
For the TCT method, the row current and total current are as follows:
The total current of the SPC is
For the L-TCT method, the total output current and each row current are calculated as follows:
The total current of the SPC is
The proposed L-shaped propagated array configuration efficiently improves the power generation and the overall performance of the PV system. For the detailed validation of the proposed array configuration, six different types of shading patterns, namely, random shading pattern (RS), diagonal shading pattern (DS), short and narrow (S-N), short and wide (S-W), long and narrow (L-N), and long and wide (L-W), as shown in Figure 7. The experimental setting has also analyzed the same. Table 2 provides the details of the PV module that was utilized for this work.
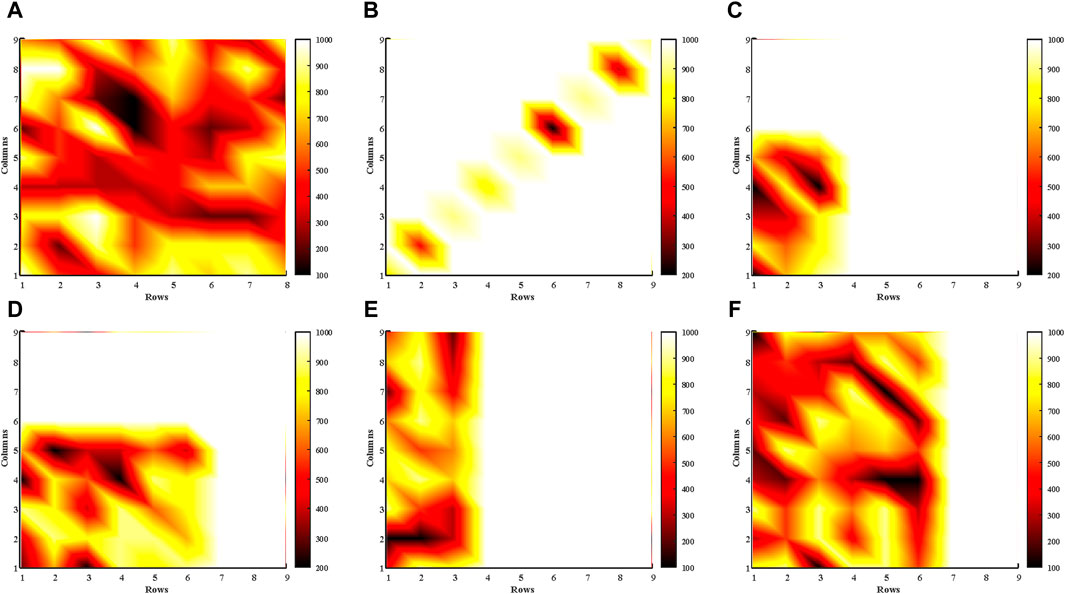
Figure 7. (A) DS, (B) RS, (C) S-N shading, (D) S-W shading, (E) L-N shading, and (F) L-W shading.
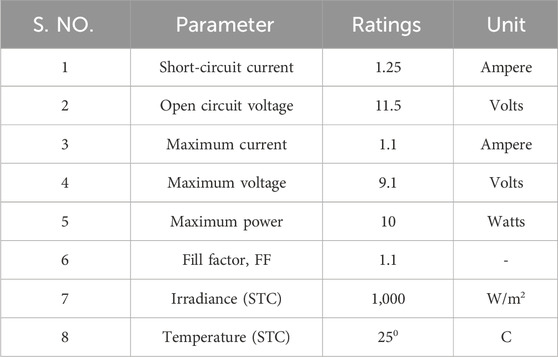
Table 2. Specification of PV modules.
Among the six kinds of shading patterns, RS does not follow any kind of unique pattern, and it has three subdivisions: shading on the less surface area, shading on 50% of the surface area, and shading on more than 50% of the surface area, which can be expressed as lesser shading, medium shading, and high shading, respectively. This type of shade pattern is typically generated by temporary objects placed between the panel surface and the Sun. The RS and its shading level are not predictable and controllable. Hence, the PV system should be able to mitigate the effects of shading from a lower to a higher level. The performance of 10 array configurations is analyzed under this RS, and the corresponding results are given in Table 3. The proposed L-TCTC has superior power generation among the other shading patterns. The spiral array configuration has the second-highest power generation.
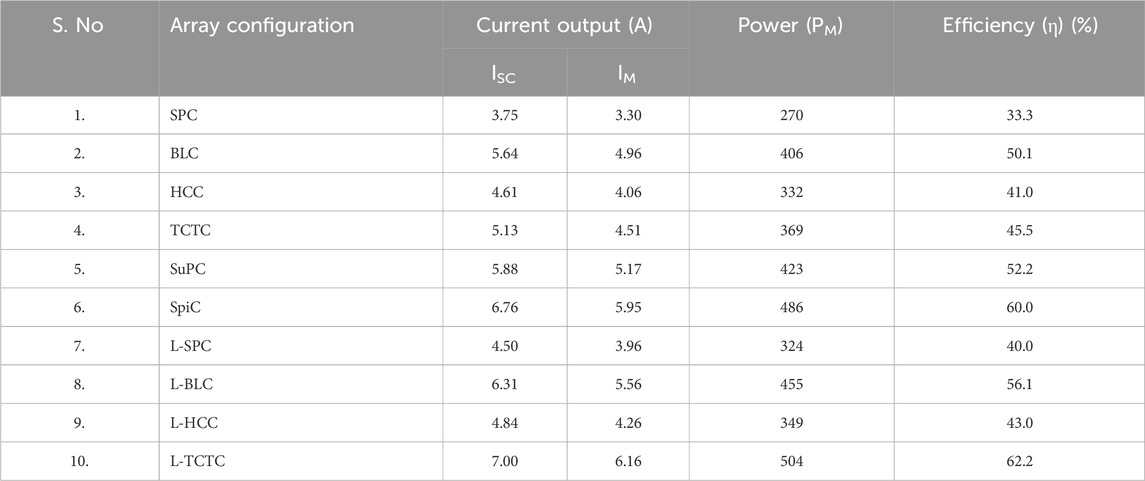
Table 3. Performance under the RS condition.
The proposed L-shaped hybrid configuration improves the performance by demonstrating the shade dispersion ability of the L-shaped propagating array structure. The proposed hybrid configurations improve the conventional array configuration performance to meet or exceed the performance of the recently developed array configurations such as SuPC and SpiC. Figure 8 shows the characteristic curves of all array configurations under the RS. The curves of the conventional methods have multiple LMPPs, due to the presence of partial shading, where the proposed configuration has few peaks, which reduces the computation complexity of the MPPT controller.
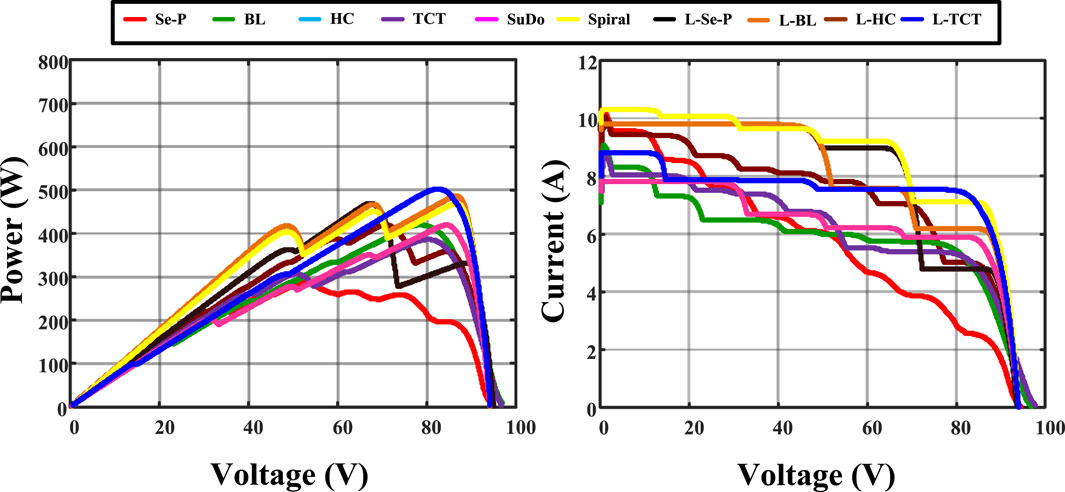
Figure 8. PV array characteristic curves under RS.
The diagonal shade pattern on the PV system is generated by a higher building built close to the PV plant. This pattern generates shading on each row, which impacts the performance of the conventional array configuration. Other conventional array topologies, except for TCTC, fail to spread the shading. The highest possible percentage of the shading level of this shading pattern is 10%–20%. However, it reduces half of the power generation due to the poor shade dispersion rate. The SuDoKu array configuration also failed on the shade dispersion process, and it has a power output of 486 W. The performances of all array configurations under the DS are given in Table 4. The proposed L-TCTC has superior power generation among the other shading patterns. The SpiC has the third-highest power generation, whereas the TCTC generates the second-highest power output.
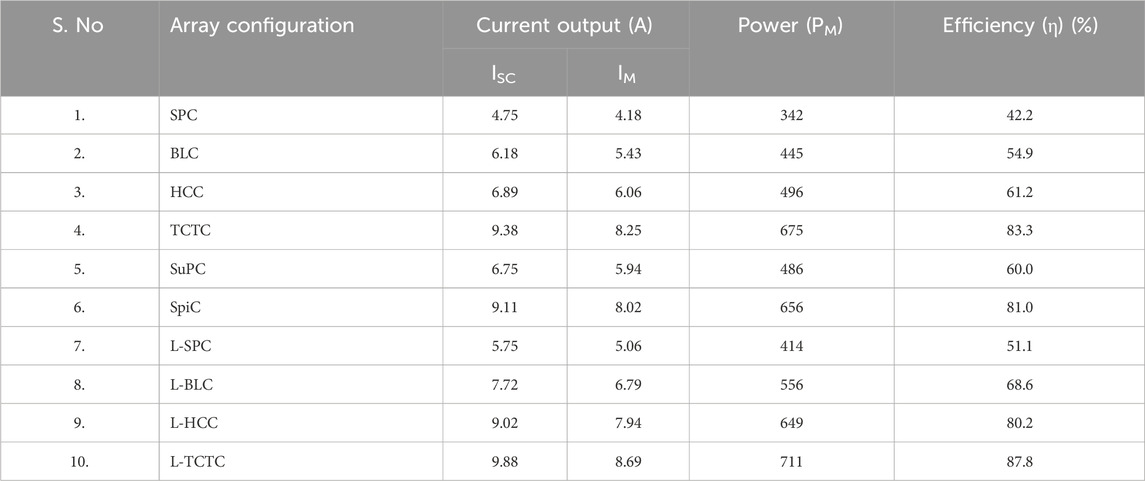
Table 4. Performance under the DS condition.
When the performance of conventional and proposed array topologies is compared, the proposed method outperforms the existing methods. The increased efficiency rate demonstrates the novelty of the proposed work. Figure 9 depicts the characteristic curves of all array arrangements. Because of the presence of partial shading, the curves of conventional approaches have many LMPPs. However, the hybrid array structure has better characteristic curves, and it improves the accuracy of maximum power point trackers.
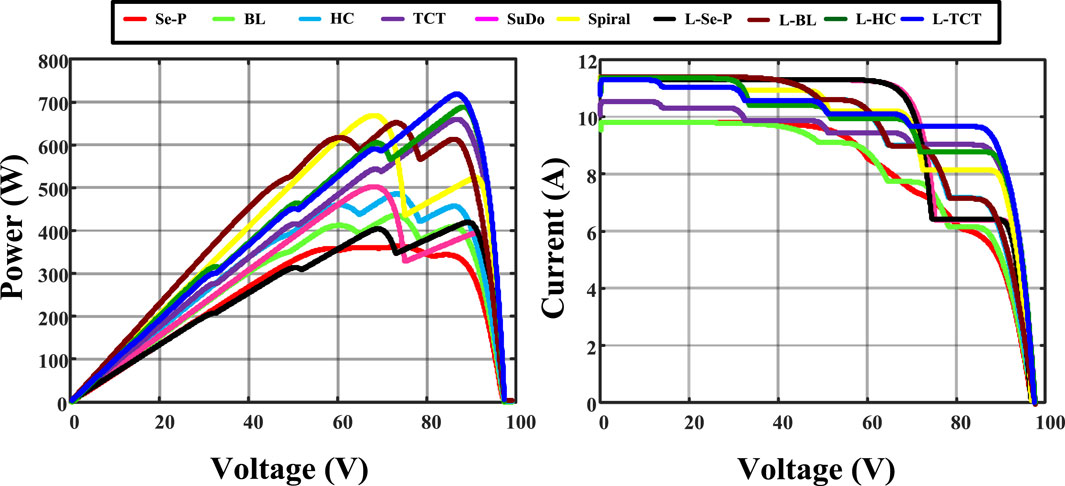
Figure 9. PV array characteristic curves under DS.
The S-N pattern is caused on the PV system due to the new construction built near the PV plant or due to some temporary shading. This shading shades approximately 25% of the PV surface. The poor partial shade dispersion rate decreases the power conversion efficiency by up to 50%. The performances of all array configurations under the DS are given in Table 5.
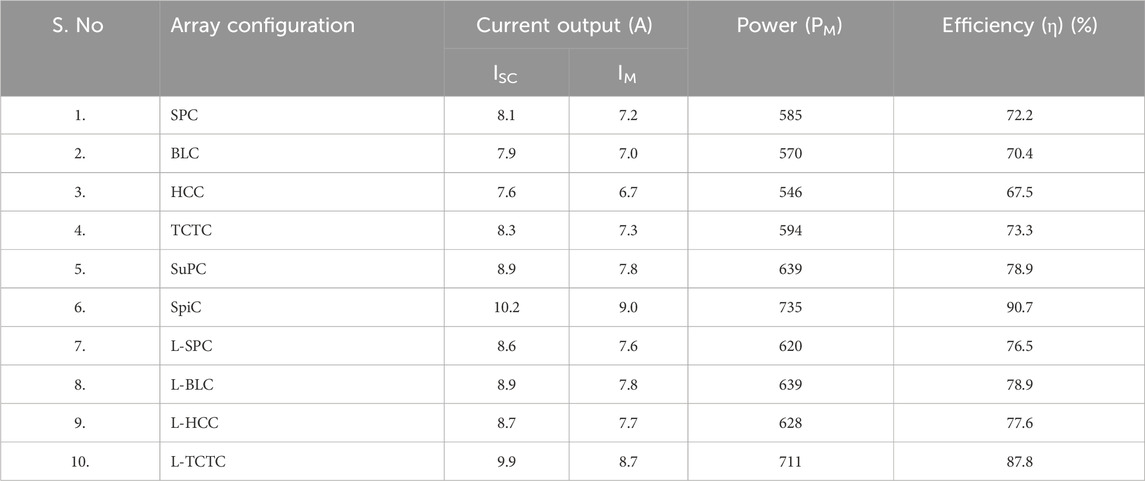
Table 5. Performance under the S-N shading condition.
The L-shaped hybrid array configuration outperforms the conventional array configurations. The characteristic curves of the PV array configurations are shown in Figure 10. The proposed hybrid configurations have better characteristic curves than the conventional array configurations. The proposed array configuration enhances the performance of the PV system under this S-N shading pattern by increasing the shaded dispersion rate.
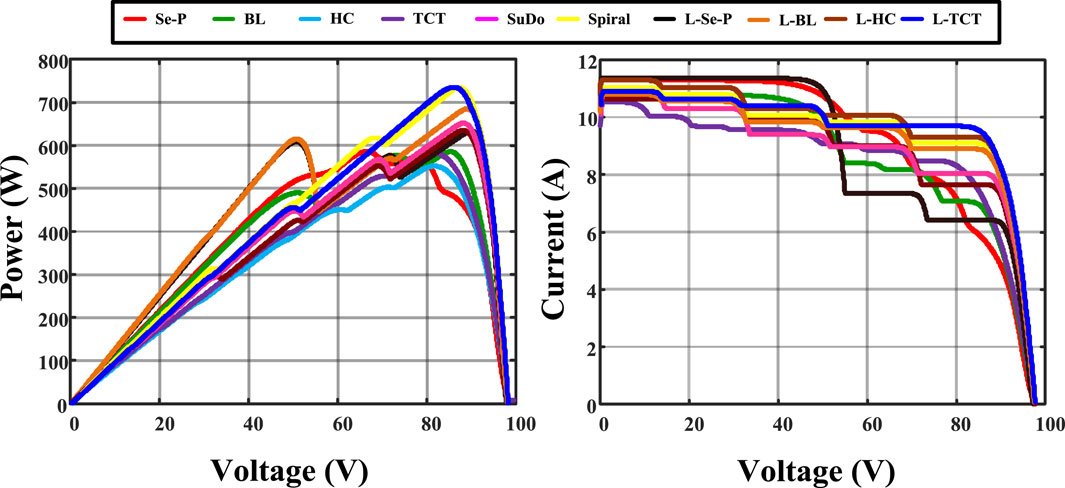
Figure 10. PV array characteristic curves under the S-N shading pattern.
The extension of the above S-N shading pattern is the S-W shading pattern. The performance of 10 array configurations is analyzed under this S-W shading pattern, and the corresponding results are given in Table 6. The proposed L-TCTC has superior power generation among the other shading patterns, and the proposed LHCC has the third-highest power generation among the other configurations. The spiral array configuration has the second-highest power generation.
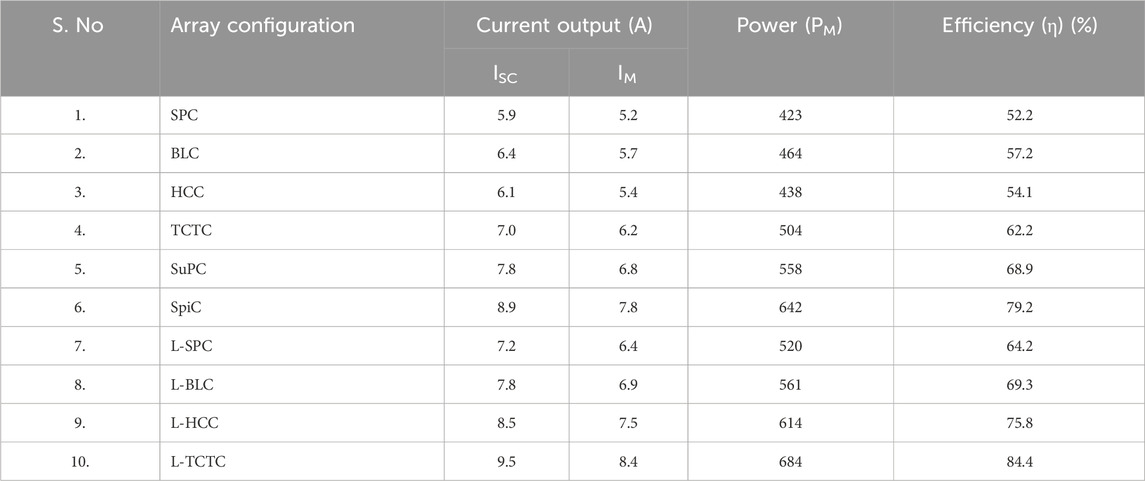
Table 6. Performance under the S-W shading condition.
The proposed L-shaped hybrid configuration improves the performance by dispersing the shade dispersion ability of the L-shaped propagating array structure. It enhances the performance of conventional array configurations to match or exceed the performance of recently developed array configurations. These configurations outperform the SuPC, and the LHCC generates similar power output to the SpiC, and the L-TCTC generates more power than the SpiC. The characteristic curves of all kinds of array configurations under the S–W shading pattern are shown in Figure 11. The curves of the conventional methods have multiple LMPPs, due to the presence of partial shading. This comparison between the characteristic curves of the conventional and proposed method demonstrates the effectiveness of this L-shaped hybrid configuration.
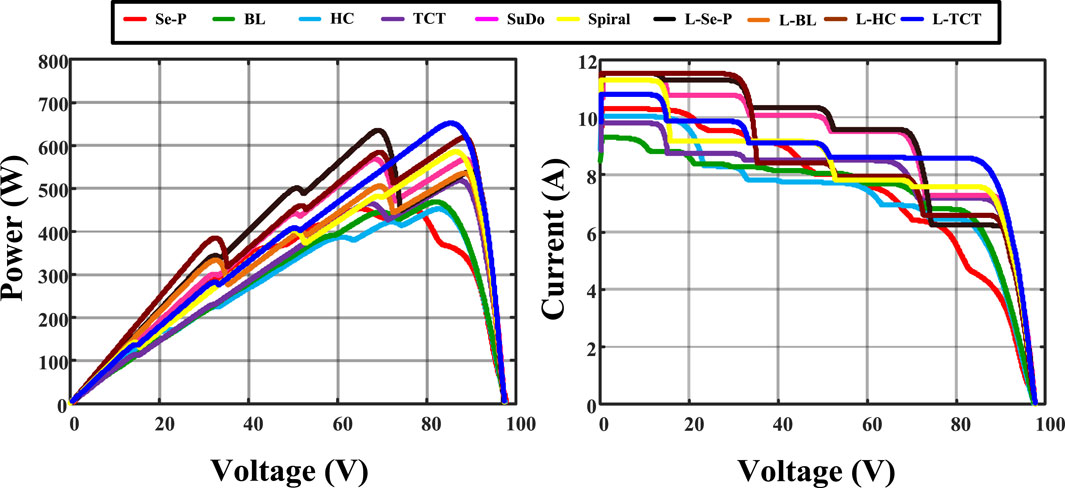
Figure 11. PV array characteristic curves under the S-W shading pattern.
The L-N shading pattern is caused on the PV system due to the new construction built near the PV plant, which shades 20%–30% of the PV panel surface. Because of the shading, the conventional SPC and LSPC are nearly the same. Under this kind of shading, the power output may be reduced due to the dispersion of shading. The effectiveness of the LSPC is not impressive, as seen in the above shading patterns. The performances of all array configurations under the L-N shading pattern are given in Table 7.
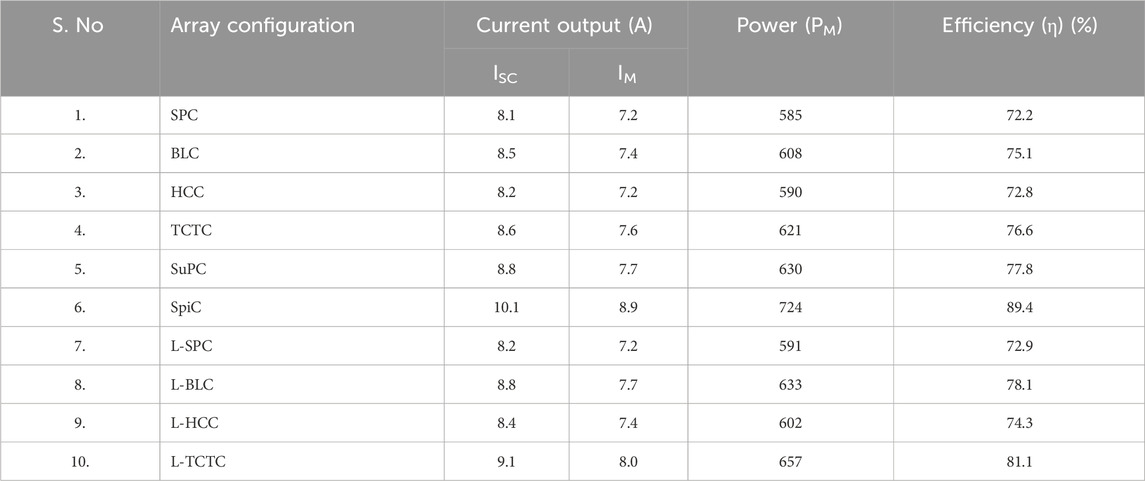
Table 7. Performance under the L-N shading condition.
The L-shaped hybrid array configuration effectively outperforms the conventional PV array configurations. The P-V and I-V curves of all PV array configurations under the L-N shading pattern are shown in Figure 12. The proposed hybrid configurations have better characteristic curves than the conventional array configurations. The L-W (L-W) shading pattern is an extension of the above L-N shading pattern. Table 8 shows the results of the analysis of the performance of 10 array topologies under this L-W shading pattern. The L-TCTC has superior power generation among the other shading patterns, and the proposed LBLC has the third-highest power generation among the other configurations. The SpiC has the second-highest power generation.
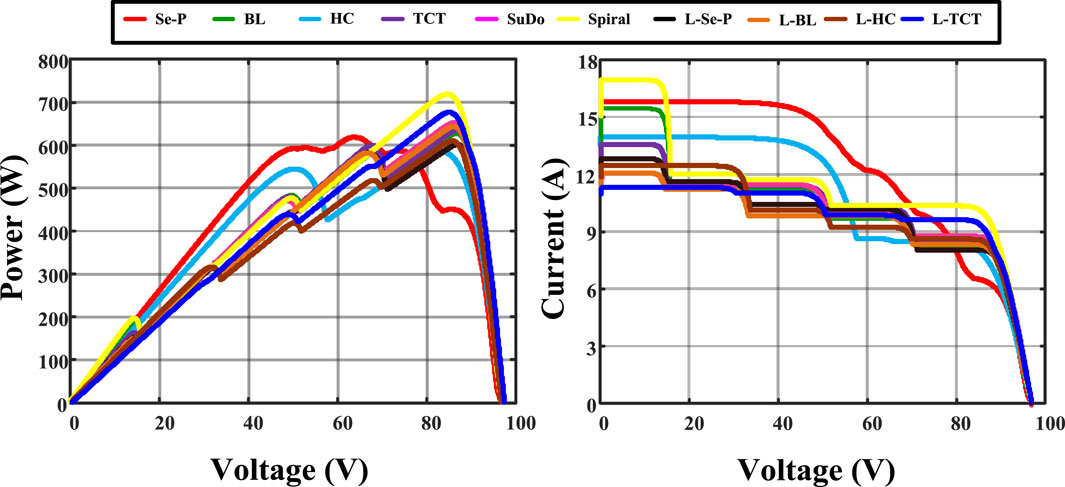
Figure 12. PV array characteristic curves under the L-N shading pattern.
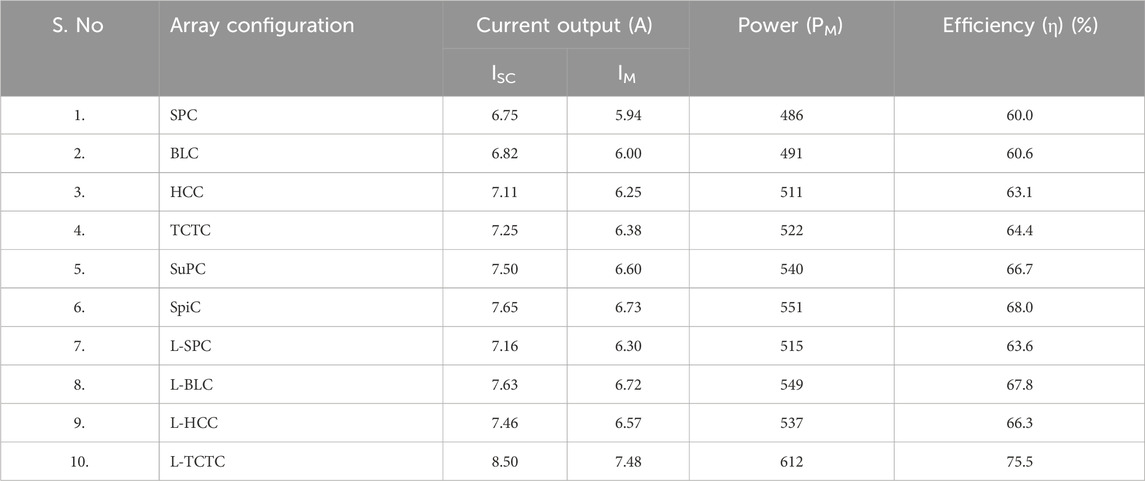
Table 8. Performance under the L-W shading condition.
The LBLC outperforms SuDoKu and generates almost the same power as the SpiC. The LHCC generates more power than the HCC and nearly the same power as the SuPC. Figure 13 depicts the characteristic curves of all array configurations under the L-W shading pattern. Because of the presence of the partial shade, the curves of conventional approaches have many LMPPs.
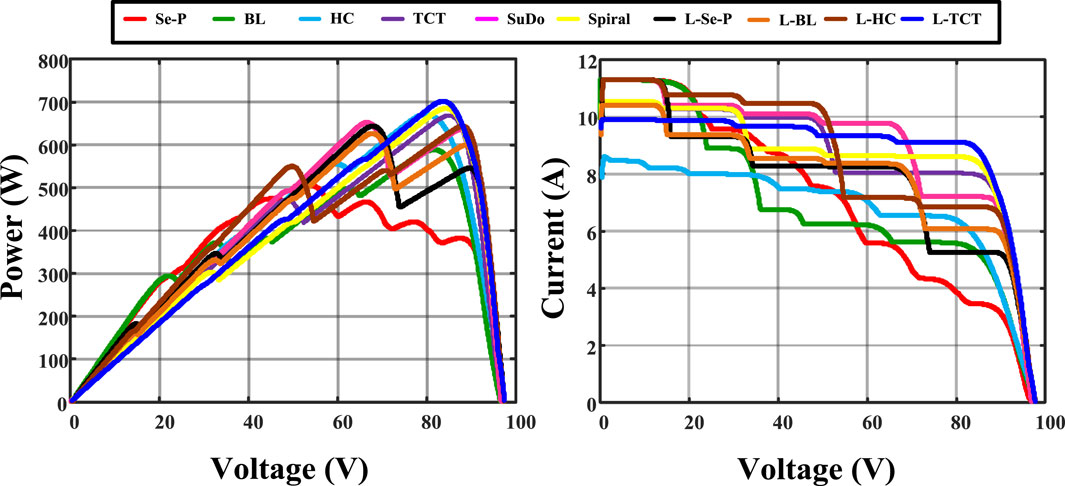
Figure 13. PV array characteristic curves under the L-W shading pattern.
The proposed L-shaped hybrid array configuration’s performance is validated by six different types of shading patterns. The corresponding results and characteristic curves were obtained successfully. The performance comparative chart is shown in Figure 14.
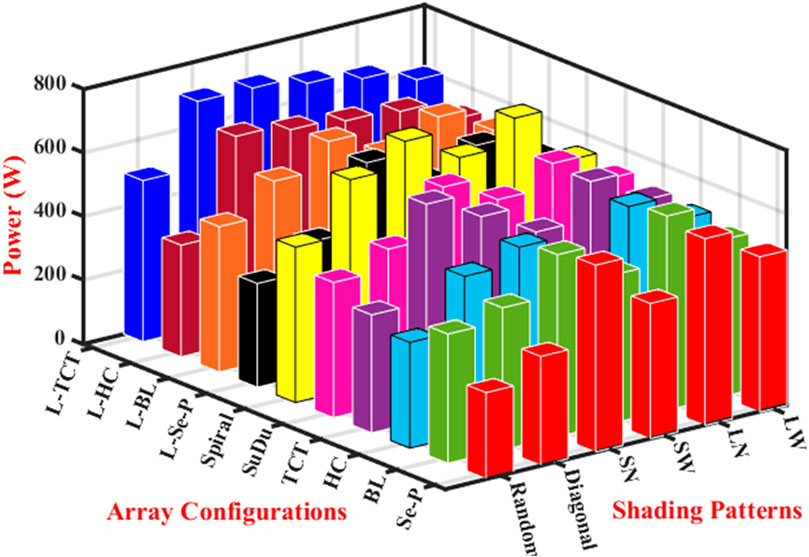
Figure 14. Performance comparison chart.
The proposed L-shaped hybrid configuration’s efficiency resulted in increased power output in all scenarios of shaded patterns. One of the observations in this work is that the execution of the proposed method in the series–parallel configuration in some shading conditions failed to disperse the shade. On the other hand, the proposed solution for the all-other array configuration has operated the PV array with the expected power enhancement. The individual power enhancement of each conventional and corresponding hybrid configuration was analyzed to observe the effectiveness. As per the expectation, all the proposed techniques under the shading conditions outperform the conventional array configuration. The corresponding output comparison of each array configuration is shown in Figure 15.
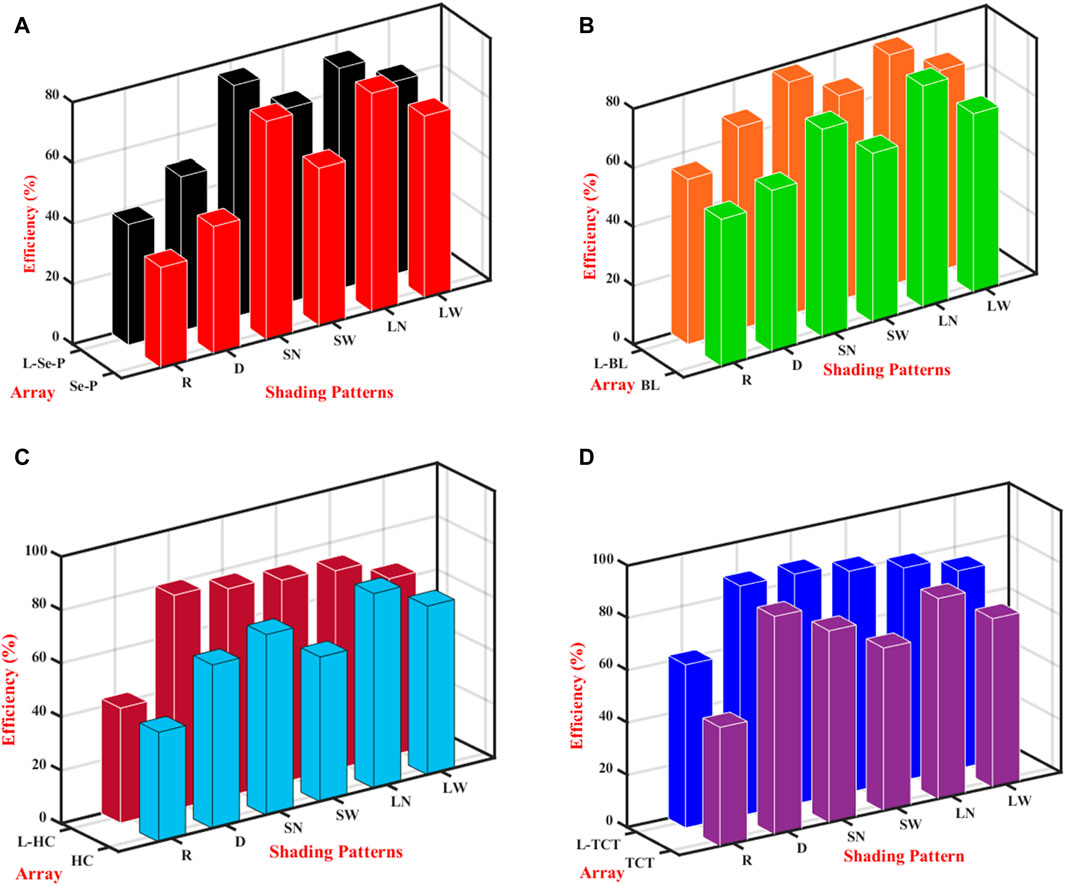
Figure 15. Efficiency comparison of (A) SPC vs. LSPC, (B) BLC vs. LBLC, (C) HCC vs. LHCC, and (D) TCTC vs. L-TCTC.
4 Conclusion
An L-shaped hybrid array configuration is developed in this work to lessen the effect of the partial shade phenomenon in the PV array. This work is a further extension of the LsPAC proposed earlier. The L-shaped array configuration is created in this work for the 9 × 9 PV array. Then, array interconnections are provided for conventional array configurations such as Se-P, TCT, HC, and BL. The main observations from the proposed L-shaped hybrid array structure are that it outperforms conventional array configurations in terms of power conversion rate, shade dispersion rate, and smoothening of characteristic curves. By comparing the output results of all array configurations under the six kinds of shading patterns, it was found that the proposed method generates more power than the conventional configurations, and in some cases, it generates more power than the recently developed configurations like SuDoKu and spiral array configurations. The mismatch losses between the PV rows were considerably reduced. This method is more suitable for building the integrated PV system where the PV array configuration is complex, structured, and interconnected. It gives consistent power enhancement on the PV array under any kind of defect. In addition, this method is easy and inexpensive to implement.
Data availability statement
The raw data supporting the conclusions of this article will be made available by the authors, without undue reservation.
Author contributions
BA: conceptualization, funding acquisition, investigation, methodology, project administration, resources, supervision, validation, and writing–review and editing. SD conceptualization, methodology, validation, visualization, and writing–original draft. PB: formal analysis, funding acquisition, investigation, project administration, supervision, and writing–review and editing. ST: data curation, funding acquisition, project administration, resources, software, supervision, validation, and writing–review and editing.
Funding
The authors declare that no financial support was received for the research, authorship, and/or publication of this article.
Conflict of interest
The authors declare that the research was conducted in the absence of any commercial or financial relationships that could be construed as a potential conflict of interest.
The authors declared that they were an editorial board member of Frontiers, at the time of submission. This had no impact on the peer review process and the final decision.
Publisher’s note
All claims expressed in this article are solely those of the authors and do not necessarily represent those of their affiliated organizations, or those of the publisher, the editors, and the reviewers. Any product that may be evaluated in this article, or claim that may be made by its manufacturer, is not guaranteed or endorsed by the publisher.
References
Aghaei, M., Kumar, N. M., Eskandari, A., Ahmed, H., de Oliveira, A. K. V., and Chopra, S. S. (2020). “Solar PV systems design and monitoring,” in Photovoltaic solar energy conversion (Elsevier), 117–145. doi:10.1016/B978-0-12-819610-6.00005-3
Aljafari, B., Balachandran, P. K., Samithas, D., and Thanikanti, S. B. (2023). Solar photovoltaic converter controller using opposition-based reinforcement learning with butterfly optimization algorithm under partial shading conditions. Environ. Sci. Pollut. Res. 30 (28), 72617–72640. doi:10.1007/s11356-023-27261-1
Aljafari, B., Balachandran, P. K., Samithas, D., Thanikanti, S. B., and Nwulu, N. I. (2024). Modeling and simulation of a Renzoku puzzle pattern-based PV array configuration for a partially shaded PV system. Front. Energy Res. 12 (Mar). doi:10.3389/fenrg.2024.1335111
Alwar, S., Samithas, D., Boominathan, M. S., Balachandran, P. K., and Mihet-Popa, L. (2022). Performance analysis of thermal image processing-based photovoltaic fault detection and PV array reconfiguration—a detailed experimentation. Energies (Basel) 15 (22), 8450. doi:10.3390/en15228450
Babu, T. S., Ram, J. P., Dragicevic, T., Miyatake, M., Blaabjerg, F., and Rajasekar, N. (2018). Particle swarm optimization based solar PV array reconfiguration of the maximum power extraction under partial shading conditions. IEEE Trans. Sustain Energy 9 (1), 74–85. doi:10.1109/TSTE.2017.2714905
Bryant, S. T., Straker, K., and Wrigley, C. (2024). The need for sectoral transition design: a case of the shift to renewable energy. Technol. Forecast Soc. Change 198, 122930. doi:10.1016/j.techfore.2023.122930
Cherukuri, S. K., Balachandran, P. K., Kaniganti, K. R., Buddi, M. K., Butti, D., Devakirubakaran, S., et al. (2021). Power enhancement in partial shaded photovoltaic system using spiral pattern array configuration scheme. IEEE Access 9, 123103–123116. doi:10.1109/ACCESS.2021.3109248
Devakirubakaran, S., and Bharatiraja, C. (2023). “A novel fused fibonacci-geometric number pattern-based PV array configuration for mitigating the mismatch losses,” in IEEE IAS global conference on renewable energy and hydrogen technologies (GlobConHT), male, Maldives, 1–6. doi:10.1109/GlobConHT56829.2023.10087573
Devakirubakaran, S., Verma, R., Bharatiraja, C., and Mihet-Popa, L. (2023). Performance evaluation of static PV array configurations for mitigating mismatch losses. IEEE Access, 1. doi:10.1109/ACCESS.2023.3274684
Dhanalakshmi, B., and Rajasekar, N. (2018a). Dominance square based array reconfiguration scheme for power loss reduction in solar PhotoVoltaic (PV) systems. Energy Convers. Manag. 156, 84–102. doi:10.1016/j.enconman.2017.10.080
Dhanalakshmi, B., and Rajasekar, N. (2018b). A novel Competence Square based PV array reconfiguration technique for solar PV maximum power extraction. Energy Convers. Manag. 174, 897–912. doi:10.1016/j.enconman.2018.08.077
Durango-Flórez, M., González-Montoya, D., Trejos-Grisales, L. A., and Ramos-Paja, C. A. (2022). PV array reconfiguration based on genetic algorithm for maximum power extraction and energy impact analysis. Sustainability 14 (7), 3764. doi:10.3390/su14073764
Lappalainen, K., and Valkealahti, S. (2017a). Effects of irradiance transition characteristics on the mismatch losses of different electrical PV array configurations. IET Renew. Power Gener. 11 (2), 248–254. doi:10.1049/iet-rpg.2016.0590
Lappalainen, K., and Valkealahti, S. (2017b). Photovoltaic mismatch losses caused by moving clouds. Sol. Energy 158, 455–461. doi:10.1016/j.solener.2017.10.001
Ma, T., Gu, W., Shen, L., and Li, M. (2019). An improved and comprehensive mathematical model for solar photovoltaic modules under real operating conditions. Sol. Energy 184, 292–304. doi:10.1016/j.solener.2019.03.089
Mohammadnejad, S., Khalafi, A., and Ahmadi, S. M. (2016). Mathematical analysis of total-cross-tied photovoltaic array under partial shading condition and its comparison with other configurations. Sol. Energy 133, 501–511. doi:10.1016/j.solener.2016.03.058
Mohapatra, A., Nayak, B., Das, P., and Mohanty, K. B. (2017). A review on MPPT techniques of PV system under partial shading condition. Renew. Sustain. Energy Rev. 80, 854–867. doi:10.1016/j.rser.2017.05.083
Nguyen, X. H., and Nguyen, M. P. (2015). Mathematical modeling of photovoltaic cell/module/arrays with tags in Matlab/Simulink. Environ. Syst. Res. 4 (1), 24. doi:10.1186/s40068-015-0047-9
Pendem, S. R., and Mikkili, S. (2018). Modeling, simulation and performance analysis of solar PV array configurations (Series, Series–Parallel and Honey-Comb) to extract maximum power under Partial Shading Conditions. Energy Rep. 4, 274–287. doi:10.1016/j.egyr.2018.03.003
Prasad, T. N., Devakirubakaran, S., Muthubalaji, S., Srinivasan, S., Karthikeyan, B., Palanisamy, R., et al. (2022). Power management in hybrid ANFIS PID based AC–DC microgrids with EHO based cost optimized droop control strategy. Energy Rep. 8, 15081–15094. doi:10.1016/j.egyr.2022.11.014
Prince Winston, D., Ganesan, K., K. B, P., Samithas, D., and Baladhanautham, C. B. (2020a). Experimental investigation on output power enhancement of partial shaded solar photovoltaic system. Energy Sources, Part A Recovery, Util. Environ. Eff., 1–17. doi:10.1080/15567036.2020.1779872
Prince Winston, D., Kumaravel, S., Praveen Kumar, B., and Devakirubakaran, S. (2020b). Performance improvement of solar PV array topologies during various partial shading conditions. Sol. Energy 196, 228–242. doi:10.1016/j.solener.2019.12.007
Ramana, V. V., Mudlapur, A., Damodaran, R. V., Venkatesaperumal, B., and Mishra, S. (2019). Global peak tracking of photovoltaic array under mismatching conditions using current control. IEEE Trans. Energy Convers. 34 (1), 313–320. doi:10.1109/TEC.2018.2873667
Ramasamy, S., Baccoli, R., Meo, S., Gatto, G., and Kumar, A. (2023). Neutral point clamped non-isolated three phase grid-integrated PV inverter topologies for leakage current reduction. Int. Rev. Electr. Eng. 18 (2), 88. doi:10.15866/iree.v18i2.23629
Ramasamy, S., Gatto, G., and Kumar, A. (2022). “Various non-isolated three phase grid-integrated PV inverter topologies for leakage current reduction - a simulation-based study,” in 2022 IEEE international power and renewable energy conference (IPRECON). Kollam, India, 1–6. doi:10.1109/IPRECON55716.2022.10059530
Sagar, G., Pathak, D., Gaur, P., and Jain, V. (2020). A Su Do Ku puzzle based shade dispersion for maximum power enhancement of partially shaded hybrid bridge-link-total-cross-tied PV array. Sol. Energy 204, 161–180. doi:10.1016/j.solener.2020.04.054
Srinivasan, A., Devakirubakaran, S., and Meenakshi Sundaram, B. (2020). Mitigation of mismatch losses in solar PV system – two-step reconfiguration approach. Sol. Energy 206, 640–654. doi:10.1016/j.solener.2020.06.004
Srinivasan, A., Devakirubakaran, S., Sundaram, B. M., Balachandran, P. K., Cherukuri, S. K., Winston, D. P., et al. (2021). L-shape propagated array configuration with dynamic reconfiguration algorithm for enhancing energy conversion rate of partial shaded photovoltaic systems. IEEE Access 9, 97661–97674. doi:10.1109/ACCESS.2021.3094736
Thanikanti, S. B., K. B, P., S, D., Aljafari, B., and Colak, I. (2023). A dynamic mismatch loss mitigation algorithm with dual input dual output converter for solar PV systems. Sol. Energy Mater. Sol. Cells 251, 112163. doi:10.1016/j.solmat.2022.112163
Viebahn, P., Soukup, O., Samadi, S., Teubler, J., Wiesen, K., and Ritthoff, M. (2015). Assessing the need for critical minerals to shift the German energy system towards a high proportion of renewables. Renew. Sustain. Energy Rev. 49, 655–671. doi:10.1016/j.rser.2015.04.070
Wang, F., Zhuang, L., Cheng, S., Zhang, Y., and Cheng, S. (2024). Spatiotemporal variation and convergence analysis of China’s regional energy security. Renew. Sustain. Energy Rev. 189, 113923. doi:10.1016/j.rser.2023.113923
Yang, Y., Campana, P. E., and Yan, J. (2020). Potential of unsubsidized distributed solar PV to replace coal-fired power plants, and profits classification in Chinese cities. Renew. Sustain. Energy Rev. 131, 109967. doi:10.1016/j.rser.2020.109967
Keywords: bridge-linked, honeycomb, mismatch loss, partial shading, photovoltaic reconfiguration, total cross-tied
Citation: Aljafari B, Devakirubakaran S, Balachandran PK and Thanikanti SB (2024) Mitigation of mismatch losses in solar PV systems: a hybrid L-shaped propagated array configuration approach. Front. Energy Res. 12:1432834. doi: 10.3389/fenrg.2024.1432834
Received: 14 May 2024; Accepted: 29 July 2024;
Published: 15 August 2024.
Edited by:
Sudhakar Kumarasamy, Universiti Malaysia Pahang, MalaysiaCopyright © 2024 Aljafari, Devakirubakaran, Balachandran and Thanikanti. This is an open-access article distributed under the terms of the Creative Commons Attribution License (CC BY). The use, distribution or reproduction in other forums is permitted, provided the original author(s) and the copyright owner(s) are credited and that the original publication in this journal is cited, in accordance with accepted academic practice. No use, distribution or reproduction is permitted which does not comply with these terms.
*Correspondence: S. Devakirubakaran, a2lydWJhdGhhc0BnbWFpbC5jb20=