 Deng Zhengwan1
 Gao Ningyu
- 1Department of Electronics and Information, Jiangsu Vocational College of Business, Nantong, Jiangsu, China
- 2School of Electrical Engineering, Nantong University, Nantong, Jiangsu, China
The control strategy of a distributed photovoltaic (PV) power generation system within a microgrid consists of an inner-loop controller and an outer-loop controller. The inner-loop controller is divided into two types, namely, the maximum power point tracking (MPPT) control strategy and DC bus voltage support strategy. Switching between these two control strategies results in issues such as DC bus overvoltage, system oscillations, or even PV system failure. An improved droop control strategy with a novel inner-loop controller is proposed, incorporating an output power derivative regulator. The control system unifies MPPT and DC bus voltage support strategy without switching the controller structure. A simulation model is built to validate the effectiveness of the proposed control strategy, and the results show that the ripple of DC bus voltage decreases by more than 60%.
1 Introduction
The photovoltaic (PV) power generation system can reduce fossil energy consumption and carbon emissions (Manoj Kumar et al., 2023; Dhinesh and Vijayakumar, 2022). The installed capacity of PV systems has the most spectacular growth all over the world. Because of the features of microgrids and PV systems, it is essential for PV systems to be connected to microgrids through power electronic devices on a large scale (Hu et al., 2022; Shao et al., 2023).
In order to maximize the utilization of solar energy, most available PV systems always adopt the maximum power point tracking (MPPT) control strategy (Xiong et al., 2021; Xuan et al., 2022). Due to the volatility of PV power, which creates an imbalance between generation and local load power, and the lack of DC bus voltage support, additional energy storage devices are required (Shen et al., 2023). As high-density distributed PV systems with increasing capacity are connected to microgrids, there are still problems such as DC bus overvoltage and undervoltage, which result in energy storage devices being overcharged or undercharged (Hadjidj et al., 2019; Xiong et al., 2020). While increasing the capacity of energy storage devices may solve the problem, it also leads to higher maintenance costs.
In order to apply MPPT, the PV controller requires steady and reliable DC bus voltage with small fluctuation and high capacity for proper functioning (Shavolkin et al., 2023; Raj and Kos, 2022; Harag et al., 2022). In island mode, the microgrid is disconnected from the major power grid, so it loses the reliable and stable DC voltage support ability from the bulk power grid. Thus, the power balance between the local load and power generation should be governed within the microgrid itself (Rezaei et al., 2022; Liu et al., 2023). To some extent, a high-capacity energy storage device in the microgrid can support the DC bus voltage (He et al., 2022). Nevertheless, energy storage devices increase construction and maintenance costs, and there are still problems such as overcharging and undercharging (De et al., 2023).
Cai et al. (2018) proposed a control strategy for PV systems in the island mode, which consists of two control loops. The inner control loop is the output voltage loop, and the outer control loop is divided into two categories, namely, MPPT control strategy and DC bus voltage support strategy. When the charging and discharging powers of energy storage devices and the load and output powers of PV systems are unbalanced, the outer loop adopts the DC bus voltage support strategy. Conversely, when these are balanced, the outer loop adopts MPPT. However, switching between MPPT and DC bus voltage support strategies will lead to voltage and power oscillations and may even cause the PV system to crash.
Thus, an advanced and reliable control strategy for PV should meet the following criteria. In island mode, a steady DC bus voltage should be achieved without requiring additional efforts in software and hardware design (Li et al., 2023). In grid-connected mode, PV applies MPPT to maximize the utilization of solar energy (Shubham Kumar and Anshul, 2023). The control strategy can implement MPPT and DC bus voltage support without switching the control configurations (Vijayshree and Sumathi, 2023), and for distributed PV systems in microgrids, the control strategy algorithm is decentralized to reduce the influence of communication systems (Zhu et al., 2022).
The mathematical formulas for describing photovoltaic arrays tend to be nonlinear. It can be divided into two regions, namely, region I and region II. In region I, dPpv/dvpv is positive. Ppv is the output power of the PV array, and vpv is the output voltage of the PV array. In region II, dPpv/dvpv is negative; as Ppv increases beyond the load power, vpv decreases to maintain a steady DC bus voltage. On the basis of theoretical analysis, an improved droop control strategy is proposed.
The proposed control strategy also consists of two loops. The outer control loop is the droop control loop, and the inner control loop is used to control dPpv/dvpv. By controlling dPpv/dvpv to be 0, the proposed control strategy becomes equivalent to MPPT. By controlling dPpv/dvpv to be negative, the proposed control strategy becomes equivalent to the DC bus voltage support strategy. Thus, with the novel control strategy, the PV system can switch control targets naturally without switching the control strategy.
Since dPpv/dvpv and Ppv tend to be nonlinear, the droop coefficients for each distributed PV change to distribute the local power balanced to each PV. A parametric design method for droop coefficients is also proposed.
To verify the feasibility of the proposed control strategy, a simulation model with three distributed PV systems is built, and the results show its effectiveness.
2 PV model
2.1 Mathematics model of photovoltaic arrays
PVs are always connected to the DC bus through a DC/DC converter. The DC/DC converter adopts a control strategy with two control loops, and the outer-loop controller applies MPPT, the inner-loop controller is the output voltage of the photovoltaic array controller. Figure 1 shows the structure diagram of the PV.
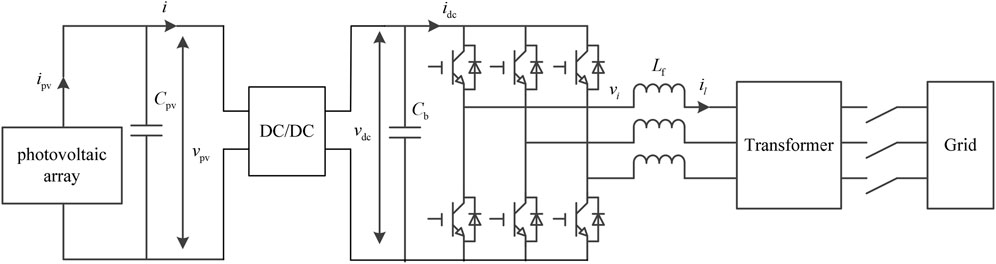
Figure 1. Structure diagram of the PV system.
Here, ipv and vpv are the output current and output voltage of the photovoltaic array. vdc and idc are the DC bus voltage and the DC bus current, respectively. Lf is the filter inductance. Cpv and Cb are the output capacitance and DC bus capacitance, respectively. vi and ii are the output voltage and output current of the DC/AC converter, respectively.
The DC/DC converter can adopt the Boost converter if the serial number of photovoltaic arrays is relatively small, and the DC/DC converter can adopt the Buck converter if the serial number of photovoltaic arrays is relatively large, and the DC/DC converter can adopt the Buck/Boost converter, if the serial number of photovoltaic arrays is reasonable.
The output current of the PV is expressed as
where Np is the number of parallel photovoltaic arrays and Ns is the number of serial photovoltaic arrays. Voc,n and Isc,n are, respectively, the open-circuit voltage and short-circuit current of photovoltaic arrays at 298.16 K and 1,000 W/m2. a is an equivalent constant of the ideal diode. Vt in Equation 1 is the thermal voltage of the photovoltaic panel, and it is expressed as
where k is the Boltzmann’s constant, T is the environmental temperature, q is the number of elementary charge, and N is the serial number of the photovoltaic power generation unit.
Based on Equations 1, 2, the output power of photovoltaic arrays is expressed as
The relational expression of the output voltage ripple and the output capacitance is
According to Equation 4, the lager capacitance can reduce the output voltage ripple.
2.2 Control strategy of the PV
The PV system operates in three different modes, namely, “islanding mode,” “grid-connected mode,” and “switching mode.”
In switching mode, once the interconnecting tie of the PV and large power grid breaks, the PV system should switch its operation mode from grid-connected mode to islanding mode. After the fault is cleared, the PV system should switch back to grid-connected mode.
In grid-connected mode, with the support of voltage and frequency from bulk power systems, the PV system always adopts MPPT. In islanding mode, due to the lack of DC bus voltage support, the PV system should be configured with energy storage devices to adopt MPPT. There is still a risk of overcharging energy storage devices if Ppv is larger than the local load and the charging power of the energy storage device, leading to DC bus overvoltage and even system failure. In addition, incorporating the energy storage devices increases the construction and maintenance costs.
Thus, in islanding mode, the control strategy of the PV system can be divided into two categories, namely, MPPT and DC bus voltage support strategy. According to the operating condition, the control system switches the control strategy to meet the performance requirement. Figure 2 shows the control strategy of the PV system.

Figure 2. Control strategy.
As shown in Figure 2, the control system of the PV needs to switch between the two types of control strategies according to the operating condition. The construction of the control system is complicated, and the hardware and software costs increase. The toughest problems caused by switching control strategies are voltage and power fluctuations, which result in poor reliability of the control system. The severe voltage and power fluctuations will result in PV system failure.
Here, d is the duty cycle of the DC/DC converter, iload is the load current,
2.3 Output characteristics of photovoltaic arrays
Figure 3 shows the schematic diagram describing Ppv varying with vpv of the PV array.
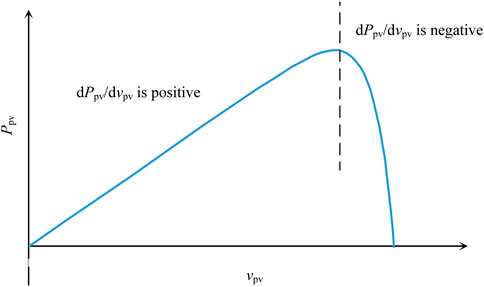
Figure 3. Output characteristics of the photovoltaic array.
As shown in Figure 3, it is divided into two regions, namely, region I and region II. In region I, dPpv/dvpv is positive, and in region II, dPpv/dvpv is negative. MPPT is equivalent to dPpv/dvpv = 0.
As the local load power increases, the DC bus voltage decreases. While in region II, as vpv decreases, Ppv increases. So, the local load power and Ppv are balanced again. In region I, as vpv decreases, Ppv decreases, which results in a worse decrease in DC bus voltage. Hence, region II is more stable than region I. By controlling dPpv/dvpv to be negative, the DC bus voltage support strategy is achieved.
3 Proposed control strategy
3.1 dPpv/dvpv
Based on Equation 3, dPpv/dvpv can be calculated using the micro-increment of conductance dipv/dvpv, and it is expressed as
A low-pass filter is adopted to reduce the influence of noise on ipv, vpv, and Ppv. In addition, the micro-increments of ipv and vpv are calculated using the low-pass filter. The output voltage and output current of the low-pass filter are expressed as
where s is the differential operator and ipv(s) and vpv(s) are Laplace transform from ipv(t) and vpv(t), respectively. T is the time constant of the low-pass filter. if(s) is the output of the low-pass filter for ipv(s). vf(s) is the output of the low-pass filter for vpv(s).
The deviations from Equations 6, 7 are expressed as
According to Equations 8, 9 and inverse Laplace transformation theory, dif/dvf is expressed as
Based on Equation 10, the time constant of the low-pass filter has no influence on dipv/dvpv. Thus, the time constant of the low-pass filter is designed to reduce the noise. T is set based on the cut-off frequency of the low-pass filter. The cut-off frequency is 1,000 Hz, so T is equal to 1/2000π.
According to Equations 5, 10, dPpv/dvpv is expressed as
According to Equation 11, Figure 4 shows the schematic diagram illustrating the computational method of dPpv/dvpv.
Figure 4. Schematic diagram illustrating the computational method of dPpv/dvpv.
In Figure 4, the limit of dPpv/dvpv is equal to y (voc_i).
3.2 Improved droop control
To distribute the local power to multiple PV systems, an improved droop control strategy is proposed. It consists of two control loops, namely, the inner-loop controller, which adopts the dPpv/dvpv control strategy, and the outer-loop controller, which adopts droop control with adaptive droop coefficients.
Figure 5 shows the schematic diagram of the improved droop control strategy for the PV system.
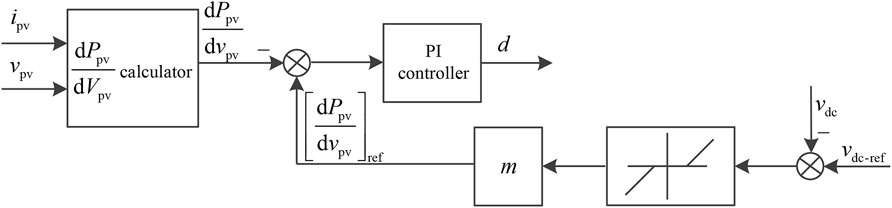
Figure 5. Improved control strategy of the PV system.
Here, [dPpv/dvpv]ref is the input reference of the inner-loop controller, and it is expressed as
where (dPpv/dvpv)* is the reference value of dPpv/dvpv. If (dPpv/dvpv)* is equal to 0, the proposed control system of the PV is equivalent to MPPT for the maximum utilization of solar energy, and m is the droop coefficient. vdc_ref is the reference value of DC bus voltage.
As shown in Figure 5, if the difference between the real-time vdc and vdc_ref is smaller than the dead band, [dPpv/dvpv]ref is 0. If PLoad is smaller than Ppv−Pc, vdc decreases; thus, vdc-vdc_ref is negative, which leads to [dPpv/dvpv]ref being negative. Hence, the control system of the PV is equivalent to the DC bus voltage support strategy.
Because of line impedance, power allocation among all PV systems can have errors when using the traditional droop control. To achieve accurate power allocation, a controller with a consensus algorithm in the second layer is necessary. Using the simplified and linear model affects the accuracy of the control system, but power allocation in the first layer is implemented.
3.3 Multiple operating modes of PV
In grid-connected mode, the DC bus voltage is adjusted using the grid-connected converter, and the DC/DC converter adopts MPPT. Thus, (dPpv/dvpv)* is set to 0.
In isolating mode, the comparison expressions between the local load power PLoad, Ppv, the charging power of energy storage devices Pc, and the discharging power of energy storage devices PD are presented as follows:
Once PLoad < Ppv−Pc, Ppv is excessive. Thus, to obtain a steady DC bus voltage, Ppv should decrease, and dPpv/dvpv is controlled to be negative.
Once Ppv−Pc < PLoad < Ppv + PD, the DC bus voltage is supported by energy storage devices, dPpv/dvpv is controlled to be 0 so that MPPT is adopted.
Once PLoad > Ppv + PD, dPpv/dvpv is controlled to be 0 so that MPPT is adopted. If the DC bus voltage continues to decrease, the fractional local load should be cut off to obtain a steady and limited DC bus voltage.
3.4 Calculation method of the droop coefficient
The output power of each PV system to support the local load is dependent on the droop coefficients. To simplify the analysis and calculation, the relationship between Ppv and dPpv/dvpv of each PV system is simplified as a linear relation, which is expressed as
where Pmax_i is the maximum output power of the ith PV, voc_i is the open-circuit output voltage of the ith PV, y (voc_i) is dPpv/dvpv when the ith PV is an open circuit.
The control system should distribute local power to each PV system as a rated ratio, which is expressed as
By applying MPPT and according to Equations 12, 13, with dPpv/dvpv = 0, Equation 14 can be expressed as
where Δv is expressed as
According to Equations 15, 16, the droop coefficient of each PV system is expressed as
where mi is the droop coefficient of the ith PV and udc_max is the upper limit value of DC bus voltage.
4 Parameters of the control system
4.1 Proposed control system
Figure 6 shows the whole control system. The inner-loop controller of PV applies a proportional–integral (PI) controller, while the outer-loop controller employs the droop control strategy. And m in Figure 6 is calculated by Equation 17.
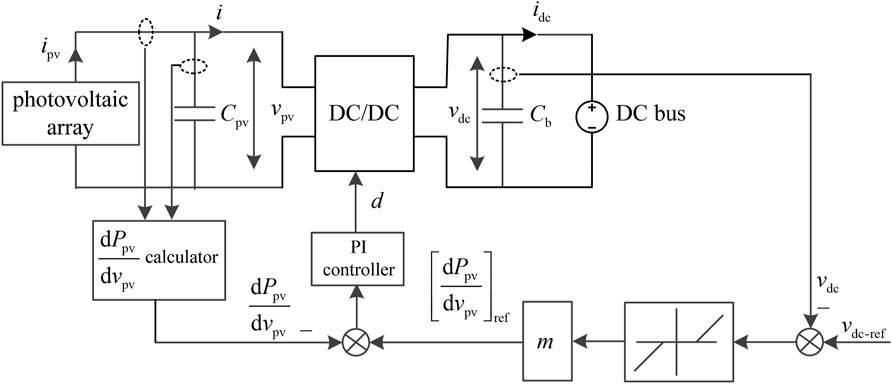
Figure 6. Whole control system.
4.2 Parameter design method
Figure 7 shows the small-signal model of the inner-loop controller.
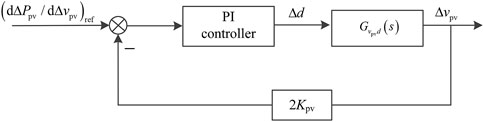
Figure 7. Small-signal model of the inner-loop controller.
Here,
The small-signal model of the Buck converter is expressed as
where L is the inductance of the Buck converter, d is the duty cycle of IGBT in the Buck converter, C is the output capacitor in the Buck converter, R is the equivalent load impedance, Cpv is the output capacitor of the photovoltaic array, and Δd is the variation in the duty cycle.
According to Equation 5, the small-signal model of the photovoltaic array is expressed as
According to Equations 19–21, the transfer function between Δd and Δvpv is achieved by Laplace transform, which is expressed as
According to Equations 22, 23, the transfer function between Δvpv and (dPpv/dvpv)ref is expressed as
where T1(s) is the transfer function of the PI controller shown in Figure 6, and it is expressed as
where KP1 and KI1 are the proportional and integral coefficients of the inner-loop controller, respectively.
In this paper, the phase margin of the inner-loop controller is set to 76°, and the bandwidth of the inner-loop controller is set to 580 Hz. And according to the tranfer function expressed by Equations 24, 25 is expressed as
5 Analysis of the results
5.1 Parameters of the simulation model
To verify the proposed control strategy, a simulation model is built. The parameters of the distributed PV system are shown in Table 1. The output capacitance of each PV system is 2,000 μF, the equivalent impedance of the transmission line is 0.002 Ω, the equivalent inductance of the transmission line is 0.2 mH, the output capacitance of the DC/DC converter is 10,000 μF, the rated DC bus voltage is 550 V, and the maximum charging and discharging powers are both 280 kW.
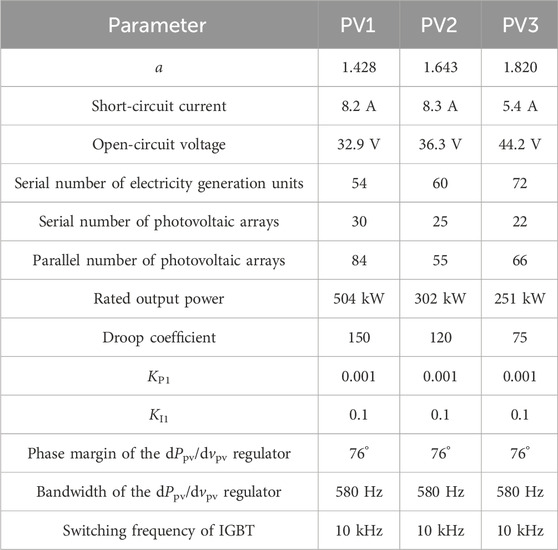
Table 1. Parameters of distributed PV systems.
5.2 Influence of load in island mode
To verify the DC bus voltage support capability of the proposed control strategy, the DC bus voltage support capability of energy storage devices is neglected. The local load is set to 706 kW in the first stage, and the load impedance is 0.46 Ω. The local load is set to 899 kW in the second stage, and the load impedance is 0.35 Ω. The local load is set to 1,038 kW in the third stage, and the load impedance is 0.24 Ω.
Figure 8 shows the response to a step change in load: a) DC bus voltage waveform, b) output power waveform of each PV system, and c) output voltage waveform of each PV system.
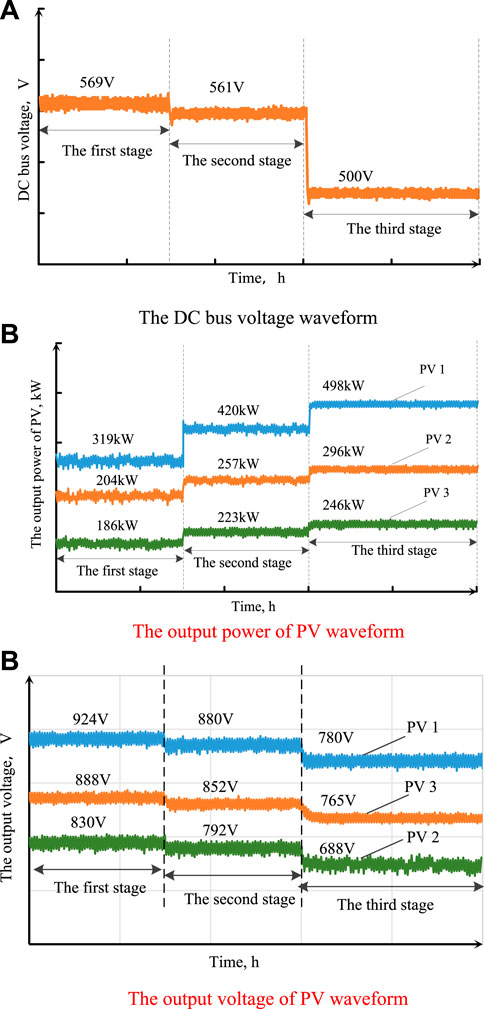
Figure 8. Operation performance of the PV system under different loads. (A) DC bus voltage of the waveform, (B) output power of the PV waveform, and (C) output voltage of the PV waveform.
As shown in Figure 8, in the first and second stages, the local power is less than the maximum output power of PV, so PV applies the DC bus support strategy. Moreover, since dPpv/dvpv is controlled to be negative, the output voltage of the photovoltaic array is relatively high. In the third stage, the local load power is more than the maximum output power of PV, so PV applies MPPT, and the DC bus voltage is maintained at 500 V.
In addition, the droop coefficients of each distributed PV system are designed as the rated output power ratio, so the output power of each distributed PV is always 1.67:1:0.83.
5.3 Influence of irradiance in island mode
The local load is set as a constant and equal to 0.6 Ω. In the first stage, irradiance is set to 600 W/m2. In the second stage, irradiance is set to 800 W/m2. In the third stage, irradiance is set to 1,000 W/m2. Figure 9 shows the response to a step change in irradiance: a) DC bus voltage waveform, b) output voltage waveform of each PV, and c) output power waveform of each PV.
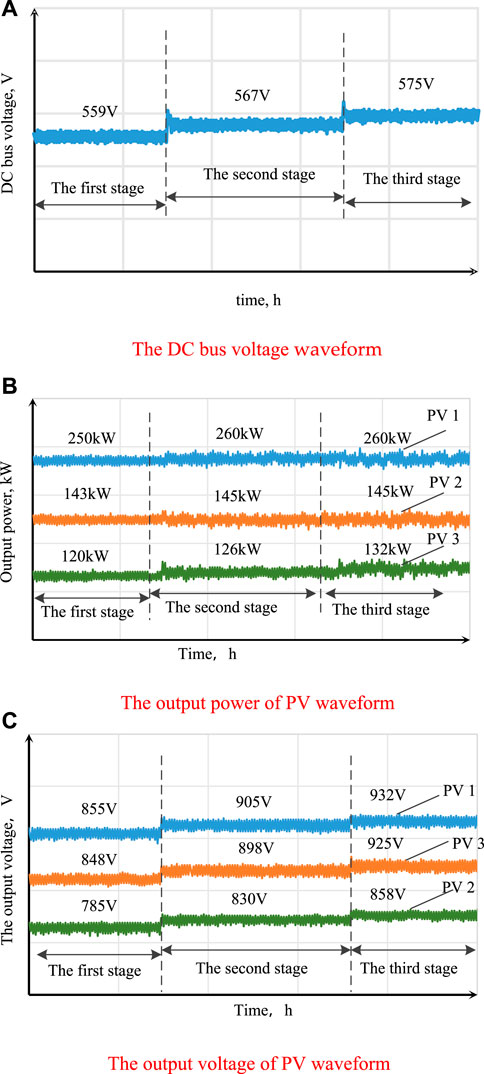
Figure 9. Operation performance of the PV system under different irradiance values. (A) DC bus voltage of the waveform, (B) output power of the PV waveform, and (C) output voltage of the PV waveform.
As shown in Figure 9, the local load power is smaller than the maximum output power of PV, so the control strategy of PV becomes equivalent to the DC bus voltage support strategy to maintain a steady DC bus voltage.
Since PV operates in region II, dPpv/dvpv is negative. Thus, the output voltage increases as the output power decreases.
5.4 Performance of the improved control strategy
The initial state-of-charge of energy storage is set to 20% to consider the influence of the energy storage system. Furthermore, the local load power is set to 605 kW in the first stage, it is set to 316 kW in the second stage, and it is reset to 605 kW in the third stage.
By the proposed control strategy, in the first and third stages, the local load power and the charging power of the energy storage device are more than the maximum output power of the PV, so the inner-loop controller adjusts dPpv/dvpv to be 0, which is equivalent to MPPT. In the second stage, the local load power and the charging power of the energy storage device are less than the maximum output power of the PV, so the inner-loop controller adjusts dPpv/dvpv to be a negative value, which is equivalent to the DC bus voltage support strategy.
By the traditional control strategy, in the first and third stages, the inner-loop controller applies MPPT, and in the second stage, the inner-loop controller applies the DC bus voltage support strategy.
Hence, the proposed control strategy adjusts dPpv/dvpv to obtain a different control objective, while the traditional control strategy switches the control system to obtain a different control objective.
Figure 10 shows the DC bus voltage waveform using the proposed and traditional control strategies.
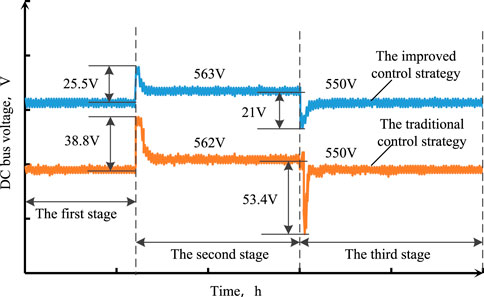
Figure 10. DC bus voltage waveform.
Figure 10 shows that both the improved and traditional control strategies can maintain the stability of DC bus voltage. In addition, for both control strategies, the ripples of DC bus voltage satisfy PV system requirements. With the proposed control strategy, the ripple of DC bus voltage is relatively small, thereby decreasing the influence of switching the control system on the PV system.
6 Conclusion
An improved droop control strategy for distributed PV systems is proposed; the inner-loop controller adjusts dPpv/dvpv, and the outer-loop controller applies droop control with adaptive droop coefficients to allocate local power scientifically to each distributed PV system. Using the proposed inner-loop controller, the PV system can achieve the maximum output power and provide DC bus support without changing the control configurations.
The proposed inner-loop controller can suppress the DC bus voltage oscillation. In the inner-loop controller, if dPpv/dvpv is regulated to be 0, the inner-loop controller is equivalent to MPPT. If dPpv/dvpv is regulated to be a negative value, the inner-loop controller is equivalent to the DC bus voltage support strategy. Using the proposed droop control strategy, both the maximum available output power of distributed PV systems and the steady DC bus voltage can be obtained.
Data availability statement
The original contributions presented in the study are included in the article/Supplementary Material; further inquiries can be directed to the corresponding author.
Author contributions
DZ: conceptualization, methodology, validation, writing–original draft, and writing–review and editing. GN: data curation, formal analysis, funding acquisition, resources, writing–original draft, and writing–review and editing. ZY: conceptualization, formal analysis, software, supervision, validation, and writing–original draft.
Funding
The author(s) declare that financial support was received for the research, authorship, and/or publication of this article. This research was funded by the Nantong Natural Science Foundation Project (grant number JCZ2023029) and the Nantong City Social Livelihood Science and Technology Project (grant number MS2023062).
Conflict of interest
The authors declare that the research was conducted in the absence of any commercial or financial relationships that could be construed as a potential conflict of interest.
Publisher’s note
All claims expressed in this article are solely those of the authors and do not necessarily represent those of their affiliated organizations, or those of the publisher, the editors, and the reviewers. Any product that may be evaluated in this article, or claim that may be made by its manufacturer, is not guaranteed or endorsed by the publisher.
References
Cai, H., Xiang, J., and Wei, W. (2018). Decentralized coordination control of multiple photovoltaic sources for DC bus voltage regulating and power sharing. IEEE Trans. industrial Electron. 65 (7), 5601–5610. doi:10.1109/tie.2017.2779412
De, P. J., Ruy, I., Galhardo, B., Costa, T., Pinho, J., Williamson, S., et al. (2023). Influence of photovoltaic microgeneration on the demand profile and its effects on the grid power quality. Electr. Power Syst. Res. 214 (Jan.Pt.B), 1–8. doi:10.1016/j.epsr.2022.108935
Dhinesh, V., and Vijayakumar, G. (2022). A switched quasi Z-source three-port (SqZSTP) DC-DC converter for a photovoltaic power generation system. Semicond. Sci. Technol. 37, 045014–45014.22. doi:10.1088/1361-6641/ac419d
Hadjidj, S., Bibi-Triki, N., and Faouzi, D. (2019). Analysis of the reliability of photovoltaic-micro-wind based hybrid power system with battery storage for optimized electricity generation at Tlemcen, north west Algeria. Archives Thermodyn. 40 (1), 161–185.
Harag, N., Imanaka, M., Kurimoto, M., Sugimoto, S., Bevrani, H., and Kato, T. (2022). Autonomous dual active power-frequency control in power system with small-scale photovoltaic power generation. J. Mod. Power Syst. Clean Energy 10 (04), 941–953. doi:10.35833/mpce.2020.000700
He, H., Lu, Z., Guo, X., Shi, C., Jia, D., Chen, C., et al. (2022). Optimized control strategy for photovoltaic hydrogen generation system with particle swarm algorithm. Energies 15 (4), 1472–1472.17. doi:10.3390/en15041472
Hu, Z., Cao, Wu, Sha, J., and Minhui, Q. (2022). “Improved frequency response model for power system with photovoltaic generation,” in 2022 IEEE 5th international electrical and energy conference (CIEEC), nangjing, China, 2929–2933. doi:10.1109/CIEEC54735.2022.9846523
Li, F., Yu, Y., and Yue, S. (2023). Study on characteristics of photovoltaic and photothermal coupling compressed air energy storage system. Trans. Institution Chem. Eng. Process Saf. Environ. Prot. 178, 147–155.
Liu, L., Zhai, R., Hu, Y., and Liu, S. (2023). Operation performance analysis of a novel renewable energy-driven multienergy supply system based on wind, photovoltaic, concentrating solar power, proton exchange membrane electrolyzers, and proton exchange membrane fuel cell. Energy Technol. Gener. Convers. Storage, Distrib. 11, 2–17. doi:10.1002/ente.202300291
Manoj Kumar, S., Chittaranjan, P., and Kaur, C. R. (2023). A computational intelligence based maximum power point tracking for photovoltaic power generation system with small-signal analysis. Optim. Control Appl. Methods 44 (2), 617–636. doi:10.1002/oca.2798
Raj, R., and Kos, A. (2022). A novel method of islanding detection in a distributed power generation system integrated with photovoltaic-array. Przeglad Elektrotechniczny 98 (7), 88–94.
Rezaei, J., Golshan, M. E. H., and Alhelou, H. H. (2022). Impacts of integration of very large-scale photovoltaic power plants on rotor angle and frequency stability of power system. IET Renew. power Gener. 16 (11), 2384–2401. doi:10.1049/rpg2.12529
Shao, B., Qi, X., Xiong, L., Wang, L., Yang, Y., Chen, Z., et al. (2023). Power coupling analysis and improved decoupling control for the VSC connected to a weak AC grid. Int. J. Electr. Power and Energy Syst. 145, 108645, Feb. doi:10.1016/j.ijepes.2022.108645
Shavolkin, O., Shvedchykova, I., Kolcun, M., Dusan, M., and Svitlana, D. (2023). Implementation of planned power generation for a grid-tied photovoltaic system with a storage battery for self-consumption of local object. Przeglad Elektrotechniczny 99 (1), 18–27. doi:10.15199/48.2023.01.04
Shen, Fu, Zhang, Y., Qiu, G., Yang, Z., Li, S., and Yang, G. (2023). Generalized discrete-time equivalent model for interfacing the grid-connected photovoltaic system. IET generation, Transm. and distribution 17 (5), 1070–1080. doi:10.1049/gtd2.12656
Shubham Kumar, S., and Anshul, A. (2023). A comparative analysis of artificial neural network algorithms to enhance the power quality of photovoltaic distributed generation system based on metrological parameters. Mapan J. Metrology Soc. India 38 (3), 607–618. doi:10.1007/s12647-023-00649-7
Vijayshree, G., and Sumathi, S. (2023). Power quality improvement in distributed generation system under varying load conditions using PWM and hysteresis controller. Przeglad Elektrotechniczny 99 (3), 142–147.
Xiong, L., Liu, X., Zhang, D., and Liu, Y. (2021). Rapid power compensation-based frequency response strategy for low-inertia power systems. IEEE J. Emerg. Sel. Top. Power Electron. 9 (4), 4500–4513. doi:10.1109/jestpe.2020.3032063
Xiong, L., Liu, X., Zhao, C., and Zhuo, F. (2020). A fast and robust real-time detection algorithm of decaying DC transient and harmonic components in three-phase systems. IEEE Trans. Power Electron. 35 (4), 3332–3336. doi:10.1109/tpel.2019.2940891
Xuan, Y., Sun, Ke, Wang, J., Yin, J., Fang, X., and Wang, G. (2022). Optimal allocation of energy storage capacity of high-permeability photovoltaic power generation system based on elastic neural network. J. Nanoelectron. Optoelectron. 17 (12), 1641–1647. doi:10.1166/jno.2022.3351
Keywords: output power differential control strategy, distributed photovoltaic power generation system, droop control, maximum power point tracking, DC bus voltage support strategy
Citation: Zhengwan D, Ningyu G and Yali Z (2024) Improved droop control strategy for distributed photovoltaic power generation systems. Front. Energy Res. 12:1430580. doi: 10.3389/fenrg.2024.1430580
Received: 10 May 2024; Accepted: 16 August 2024;
Published: 30 August 2024.
Edited by:
Yonghui Liu, Hong Kong Polytechnic University, Hong Kong SAR, ChinaReviewed by:
Chaoran Zhuo, Xi’an University of Technology, ChinaCencen Hong, Nanjing Institute of Technology (NJIT), China
Huimin Wang, Zhejiang Sci-Tech University, China
Kenneth E. Okedu, Melbourne Institute of Technology, Australia
Copyright © 2024 Zhengwan, Ningyu and Yali. This is an open-access article distributed under the terms of the Creative Commons Attribution License (CC BY). The use, distribution or reproduction in other forums is permitted, provided the original author(s) and the copyright owner(s) are credited and that the original publication in this journal is cited, in accordance with accepted academic practice. No use, distribution or reproduction is permitted which does not comply with these terms.
*Correspondence: Gao Ningyu, Z2FvX25pbmd5dV9udHVAMTYzLmNvbQ==