 Wentao Feng
 Bingyan Deng1
- 1State Grid Sichuan Information & Telecommunication Company, Chengdu, China
- 2School of Mechanical and Electrical Engineering, University of Electronic Science and Technology of China, Chengdu, China
The integration of stochastic and intermittent distributed PVs brings great challenges for power system operation. Precise net load forecasting performs a critical factor in dependable operation and dispensing. An approach to probabilistic net load prediction is introduced for sparse variant Gaussian process based algorithms. The forecasting of the net load is transferred to a regression problem and solved by the sparse variational Gaussian process (SVPG) method to provide uncertainty quantification results. The proposed method can capture the uncertainties caused by the customer and PVs and provide effective inductive reasoning. The results obtained using real-world data show that the proposed method outperforms other best-of-breed algorithms.
1 Introduction
Distributed generation such as photovoltaic (PV) has become an important component with the increasing demand for low-carbon power systems (Zhu et al., 2023). In addition, electric vehicles are becoming increasingly popular around the world due to their clean and economic properties (Cao et al., 2020a; Dhawale et al., 2024). The adjustability of EV power enables them to be the focus of research in load management. However, the intermittent nature of PVs and the uncertainty of the commuting and charging behaviors of EV bring more uncertainties to both the generation and demand sides, which pose great challenges for a reliable and safe operation of power systems (Cao et al., 2020b; Xiong et al., 2021).
Accurate load forecasting contributes to the reliability and security of smart grid performance. (Zhao et al., 2023; Zulfiqar et al., 2023; Zhao et al., 2024). Conventional load forecasting researches focus on forecasting the aggregate load demand in a given area based on historical load demand data, weather and geographic information, which can be divided into two subcategories: point forecasting methods and probabilistic methods. Various point forecasting methods have been proposed. A short-term loading prediction model based on multivariate linear regression is presented in Saber and Alam, (2017). In the face of complicated nonlinear systems, multivariate linear regression approaches possibly fail to provide high-precision forecasting results. An autonomy regressive integrative moving averaging (ARIMA)-based intradaily load predicting model is introduced (Cao et al., 2015). The principle of the ARIMA method is to build a model by using the historical load data sampled in the previous period. The primal loading is considered as a stochastic variation of the model, and the variation procedure of those primal loads is derived from the statistical laws (Taieb et al., 2016). However, the ARIMA method does not deal well with time-series data with high randomness and non-stationary features. Neural network (NN)-based approaches have been extensively employed in the literature for load prediction in recent years for the power of their nonlinear matching capacity. A load forecasting method combining the backpropagation NN (BPNN) and radial basis function NN is proposed for day-ahead load prediction. Xu et al. (2018) proposes a NN based load forecasting model and adopts an enhanced Levenberg-Marquardt method for training the NN. The NNs utilized in the aforementioned studies are fully-connected, which ignores the temporal correlation between input data that contains valuable information. Recurrent NN is a kind of network structure that has the ability of memory. It considers both the current input and what it learned previously when utilized for prediction. Various RNNs have been proposed, such as long-short term memory (LSTM), just-another net (Gao et al., 2018), and gated recurrent unit. Among them, LSTM is the most widely used. An LSTM-based short-term residential load forecasting method is proposed. An ensemble load forecasting method based on LSTM is developed in (Tan et al., 2020). Simulation tests demonstrate that the proposed method can achieve state-of-the-art performance on open datasets. In addition to the methods mentioned above, extreme learning machines (Li et al., 2023) and k-nearest neighbor methods (Prasad et al., 2023) are also employed to forecast loads and obtain gratifying outcomes.
Those approaches are point predictions where only one value is supplied at each step. However, due to increasing penetration of renewable energy sources and competitive markets, point forecasting approaches are becoming obsolescent and probabilistic prediction approaches are growing in necessity for system operators. Probabilistic prediction approaches allow quantification of indeterminacy through interaction intervals, quantity, or probability density functions, enabling applications in unit commitment, dependability programming, and competitive tendering in the electricity market. The various probabilistic prediction approaches presented can be classified into two types (Feng et al., 2020): one-step approaches (He et al., 2016; Zhang et al., 2019) and two-step approaches (Xie and Hong, 2018; Wang et al., 2019).
While there are extensive researches on load prediction, there are very rarely researches on the prediction of net load, which is defined as the discrepancy between electricity consumption and power generation. The reliability and security of smart grid operations can be increased by accurately predicting net loads. However, net load forecasting is fraught with substantially more challenges than conventional load forecasting due to the intermittency and stochastic character of renewable energy. Over the past several years, a couple of researches have concentrated on the prediction of net loads. (Liu et al., 2014; Kaur et al., 2016; Sepasi et al., 2017; Wang et al., 2018; Sun et al., 2020). Liu et al. (2014) presents a BPNN-based point prediction approach for net loads. The performance comparison between the combined net load predicting model and the additive model is provided in Kaur et al. (2016). A complex-valued NN-based net load prediction model is proposed in Sepasi et al. (2017). The above studies belong to the deterministic net load forecasting methods, which cannot capture the multiple uncertainties caused by the behind-meter PV and load demand. Probabilistic forecasting methods Wang et al. (2018) are proposed to quantify the uncertainties. The work (Sun et al., 2020) presents a Probability forecasting model which is supported by Bayesian theoretic and LSTM. Experimental findings indicate that excellent properties can be obtained with both determination and probability Metrics. Although LSTM alleviates the gradient explosion problem via the introduction of the gate mechanism, it cannot calculate in parallel, which unusually leads to a long calculation time.
Sparse Gaussian processes (SGP) fit complex non-linear relationships using flexible probabilistic models to accurately predict future data. In this context, an algorithm of sparsely variant Gaussian process based probabilistic net load forecasting model is introduced. The forecasting of load demand is cast to a regression problem and the sparse variational Gaussian process (SVPG) (Hu et al., 2024) method is applied to estimate the prediction values as well as to provide the uncertainty quantification. Comparative tests using real field data among various point and probabilistic forecasting methods illustrate the superior performance of the proposed method in terms of both deterministic and probabilistic results. The main contributions are as follows:
1) A prediction model based on a sparse variational Gaussian process is constructed;
2) The proposed SVGP model accurately captures load uncertainty;
3) The proposed SVGP model gives excellent performance in both point load prediction and probabilistic prediction.
The rest of the paper is formulated as follows: the problem formulation and proposed method are given in Section Ⅱ, followed by simulation results in Section Ⅲ. Section Ⅳ concludes this paper.
2 Proposed methodology
In this section, the probabilistic load predicting issue is firstly presented, followed by detailed information on the Gaussian process regression method and the SVPG regression method. Finally, the details of the training procedure are provided.
2.1 Formulation of the probabilistic load predicting issue
In power systems, the net load data captured by intelligent meters is typically considered as a time series
2.2 Gaussian process regression
Assuming that
where
where
Then the prior distribution of y can be acquired as (5):
and Joint distributed of observations y and forecast value
The posterior distribution of the forecast values will then be represented as
where
If we can obtain all the hyper-parameter Θ, which contains the parameters σn in Gaussian white noise ε and the parameters σ in kernel function K(·), The mean and variance of the testing sites are obtained based on (8) and (9), respectively. Generally, the most used method to obtain hyper-parameters of GPR is a maximum likelihood estimate based on a gradient that makes the negative logarithm marginal likelihood
The hyper-parameters are updated based on gradient according to (10) until finding the optimal in (11). Where there is a drawback that the complexity of this training process is O(N3), which means it will take a lot of time to train the model and it is not suitable for the scenario in which the data is large.
2.3 Sparse variational Gaussian process regression
To solve the problem above, a useful method called sparse Gaussian process regression (SGPR) is proposed. SGPR can reduce the complexity of the training process to O(NM2) (M << N) by introducing M auxiliary inputs Z∈RM×Q and the corresponding outputs u∈RM×1 to approximate the original N-dimensional Gaussian process. And the joint density of y, f and u is:
In (12) the joint density is factorized into GP prior and likelihood where the likelihood can be expressed as (13):
and GP prior can be factorized into the prior p(u|Z) and conditional p(f |u; X, Z) (14):
and the prior and conditional parts can be expressed as (15, 16):
where Knn, Knm, Kmn and Kmm represent K(X,X), K(X,Z), K(Z,X) and K(Z,Z), respectively.
An approximate posterior q(f,u) = p(f|u)q(u) is introduced to replace the true posterior p(f,u), where q(u) = N(µ,Σ). Variational inference seeks the variational posterior by minimizing the Kullback-Leibler divergence between variational posterior q and true posterior p, where a lower Kullback-Leibler divergence represents a closer similarity between two distributions. Equivalently, we can maximize the evidence lower bound (ELBO) to seek the variational posterior:
where p(y, f, u) is expressed in (12) and q(u, f) is the variational posterior. And the ELBO can be simplified from (17) as (18):
where the latter part can be expressed as (19):
So, the ELBO can be simplified as (20):
The Gaussian marginal likelihood q(f) can be expressed as (21):
where p(f |u) is expressed in (20) and q(u) = N(µ,Σ), so the µ’ and Σ′ be calculated as (22, 23):
All parts in (20) are known, so we can calculate the ELBO and then obtain all the hyper-parameters by maximizing the ELBO. Besides the model hyper-parameter Θ which is the same as that in GPR, there is another kind of parameters called variational parameters θ, which contain the mean µ and variance Σ of variational posterior q(u) and the auxiliary inputs Z. All the hyper-parameters can be expressed as (24, 25):
After obtaining both the model and variational parameters, we can predict the new points via as (26).
where q(f *) is the distribution of new points.
The detailed training and testing procedure of the proposed algorithm is shown in Algorithm 1.
Algorithm 1.Details of the training and test procedure.
Require: train data-set: Tr=(X,Y); test data-set: Te=(X*,Y*)
Require: model parameters: Θ; variational parameters: θ; training iterations: T; amount of sparse point: m
1: procedure Train(Tr, Θ, θ, T)
2: Initialize all parameters
3: for epoch t = 1,2, … T do
4: obtain the variational posterior q(u) according to the variational parameters µ and Σ
5: obtain the conditional p(f |u;X,Z) according to (16)
6: obtain the marginal q(f) according to (21)
7: obtain the ELBO LSGPR according to (20)
8: update model parameters:
9: update variational parameters:
10: end
11: end procedure
12: procedure Test(Te, Θ,θ)
13: obtain marginal q(f*) of test point according to (26)
14: end procedure
3 Case study
3.1 Data description
Comparative numerical testing is performed with authentic on-site smart meter data. These data have been measured on the Ausgrid distribution network which contains load demand and photovoltaic (PV) generation data from 300 residential households (Ausgrid 2014, 2015). The time period for recording values is 0.5 h. The purpose of this research is to provide a probabilistic prediction of the net load, which is derived by adding the differential of each consumer’s load demand and PV production. The reader is directed to Ausgrid 2014, 2015 for additional details about the dataset.
Since the dataset contains some low-quality data (Ratnam et al., 2017), we delete some original data for better illustration and fair comparison. The data are divided into the training samples and test samples, which contain 11,739 and 480 pairs of data, respectively. The training samples have been applied to train the predictive models while the testing samples have been performed to estimate the performance of the different models. The net load of the training and testing sets are shown in Figures 1, 2, respectively. The characteristics picked comprise the below variables: 1) the time index, which includes messages for hour of the day, day of the week, and month of the year. A single coding technique is employed in this research to encode the time message; 2) the historical load demand data, which include load data from the previous 2 days with the same time-steps; 3) the historical PV generation data, which contain data on PV generation at the same point in time for the last 3 days and 1 week ago on the same day.
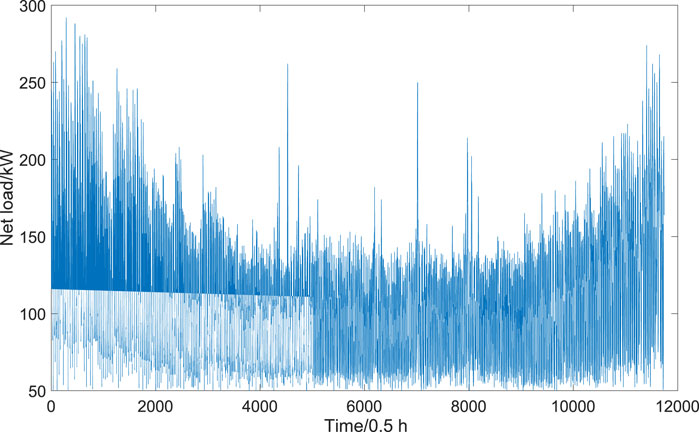
Figure 1. Net load of the training set.
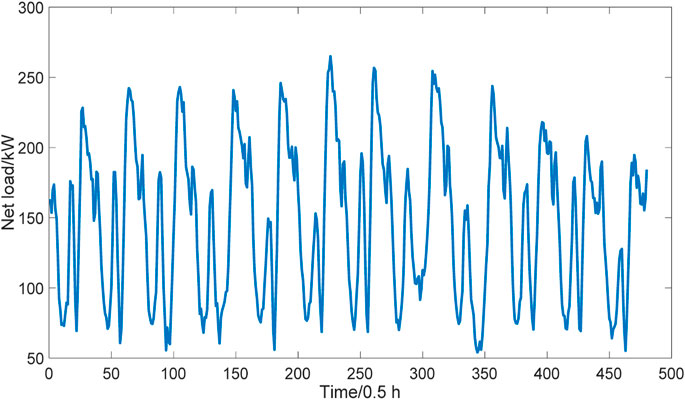
Figure 2. Net load of the test set.
3.2 Experimental setup
Comparative tests among a series of load forecasting methods are carried out to access the performance of the proposed approach. Comparison methods fall into two categories: point prediction approaches and probabilistic approaches. The point prediction approaches involve: 1) multiple linear regression (MLR); 2) support vector regression (SVR), where RBF is specified to be the kernel function with hyper parameters adjusted following the grid search approach.; 3) back-propagation neural network (BPNN), where a three-layer model is built. The numbers of the hidden layers are 64, 64, and 32, respectively; 4) LSTM method, where a model with two hidden layer is built. The hidden nodes of the two hidden layer are set to 30 and 30, respectively. For the probabilistic forecasting method, quantile regression (QR) is selected as the benchmark method.
3.3 Evaluation metrics
In order to assess the performance of various approaches for point prediction results, three extensively adopted deterministic prediction assessment metrics and two probabilistic prediction metrics are adopted in this research.
3.3.1 Metrics for deterministic prediction
Three point forecasting metrics are utilized, that are, mean absolute error (MAE), root mean square error (RMSE), and mean absolute percentage error (MAPE) which present as (27–29):
where
3.3.2 Metrics for probabilistic prediction
Two probabilistic prediction metrics are employed in this study, that is, Pinball loss and PINAW. The most commonly used metrics for evaluating probability forecasting results are reliability, sharpness and resolution. Pinball is a comprehensive metric which allows for the assessment of the aforementioned metrics, where the definition of the metrics is (30):
where
PINAW is a measurement of the prediction horizon width which is determined as (31):
where
3.4 Point forecasting results
To illustrate the superiority of the proposed model, several approaches will be employed in this section for comparison. The MAE, MAPE and RMSE of each prediction approach are displayed in Table 1. The results of QR are forecasting values when the quantile is set to 50%. The units of MAE and RMSE are kW and of MAPE is PU. The best performance cases of each metrics are shown in bold. That when the proposed method is utilized, its performance outperforms that of the LR method by 24.7%, 24.4%, and 22.7% in MAE, MAPE, and RMSE, respectively. The BPNN achieves better performance than the LR method owing to its strong nonlinear approximation capability. However, since BPNN ignores the temporal relationship between the input data, the performance of BPNN is worse than the proposed approach. LSTM has high computational complexity and requires a large amount of training data. SVR requires a high time during the training process and cannot handle the linear problem perfectly The performance of the proposed approach also outperforms that obtained by a kernel based SVR method and a recurrent NN based LSTM method, and demonstrating its effectiveness.
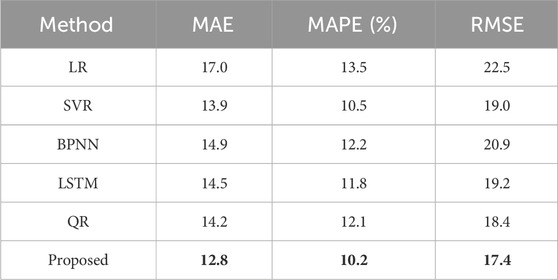
Table 1. Point forecasting results of different forecasting models.
For analyzing the performing of the proposed model additionally, the prediction results for different approaches for 100–200 instants in the test set are displayed in Figure 3. The proposed approach is the one that comes nearest to the real load values, which demonstrates the supremacy of the proposed approach. The predicted results for each approach at peak values, which are more difficult to predict, are shown in Figure 4. It can be observed from the figure that the peak value is difficult to predict for all methods owing to the high uncertainty. The deviation between the real net load and the value forecasted by the LR method is even larger than 10% of the real value. The BPNN tends to over-predict the peak value and has large fluctuations. The SVR and LSTM also fail to provide accurate forecasting values at the peak of the curve. The predicted values derived from the presented methodology appear to be the closest to the actual values, demonstrating the excellence of the proposed methodology.

Figure 3. Point prediction results for different approaches.
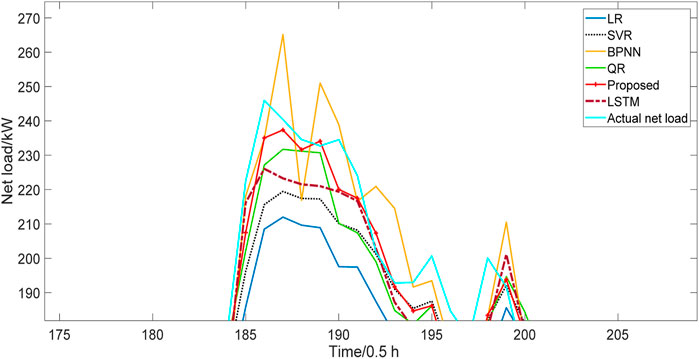
Figure 4. Prediction results for different approaches at the curve peak in Figure 3.
The PINAW is a metric to evaluate the width of the forecasting interval. That the PINAW achieved by the proposed method is 18.4% lower than that of the QR method, demonstrating that the proposed method can achieve a better performance with narrower forecasting interval.
To further evaluate the uncertainty quantification capability of various methods, the PINAW obtained by different methods under different quantiles are listed in Table 3. It can be observed from the table that the width of the forecasting interval increases when we gradually improve the confidence level. However, the forecasting intervals obtained by the proposed method are always narrower than that of the QR method. The PINAW of the proposed method is 12.8%, 15.1%, 22.0%, and 18.4% lower than that of the QR method when the quantile is set to 60%, 70%, 80%, and 90%, respectively. This further illustrates the strength of the proposed model.
The predicted intervals for 100–200 instants in the test set for the various approaches are shown in Figure 5 when the quantile is configured as 70%, 80%, 90%, 95%, separately. It can be observed from Figure 5A that the physical net loads for some valley values fall outside the 95% credibility intervals of the QR approach, while the prediction intervals of the proposed approach will be capable of covering majority of the prediction intervals, demonstrating a higher reliability of the proposed method. Visually inspecting the probabilistic results of the two methods, the width of the proposed model is narrower than the QR approach under various quantile settings. This is consistent with the results shown in Table 2, 3, illustrating a better sharpness of the proposed method. From the perspective of the resolution, the width of the forecasting interval should be different at different periods of the curve. The forecasting interval is narrow at the rising and falling stage of the curve, while the width is large at the peak and valley of the curve. Since the value of the net load at the curve valley is mainly decided by the PV generation, which has larger uncertainty than the load demand, the width of the interval is the largest at the curve valley. This can be observed from both figures. However, the presented approach catches the uncertainty at the peak curve with a narrower interval, illustrating its effectiveness.
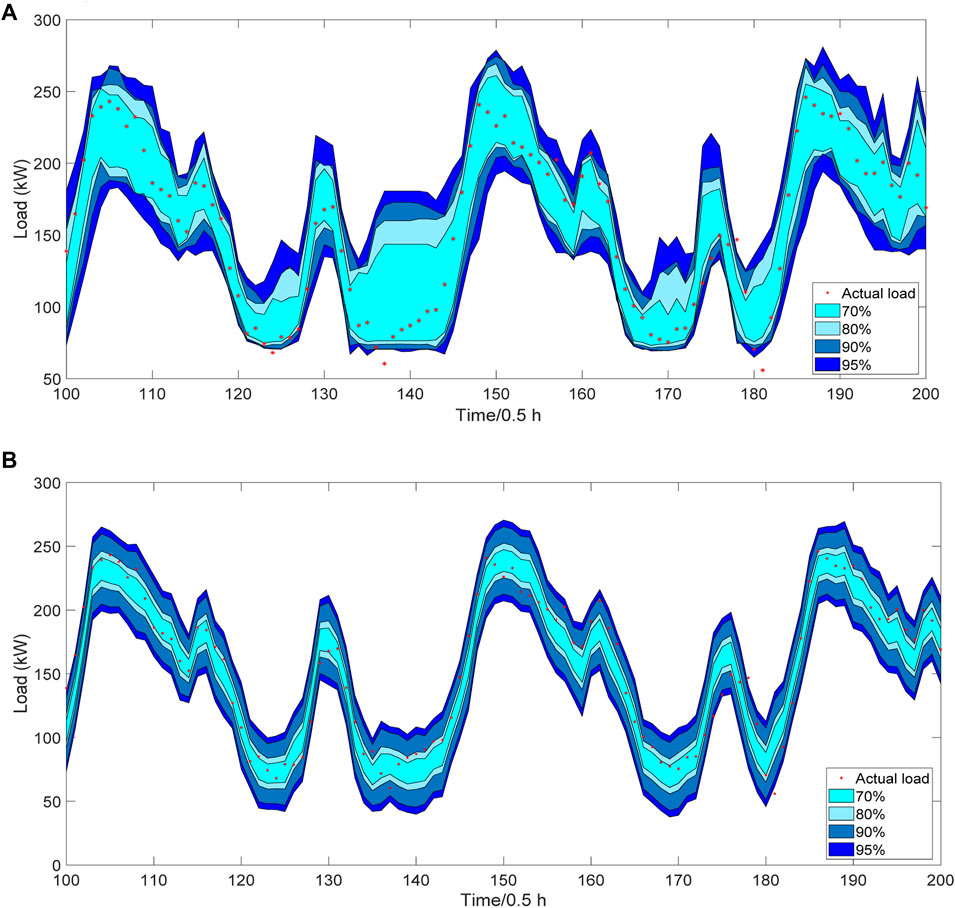
Figure 5. Forecasting intervals of different methods. (A) QR. (B) proposed method.
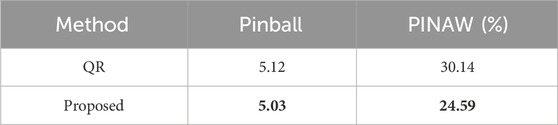
Table 2. Probabilistic forecasting results of different methods.

Table 3. The PINAW achieved by various methods under different confidence levels.
The prediction from various approaches at different stages of the load profile is shown in Figure 6 for deeper validation of the capability of the proposed approach. The forecasting results of different methods at the rising and falling period of the load curve are shown in Figures 6A,B. The forecasting values of various methods are not far from the actual net load at the falling stage. In addition, the density curve of the proposed method is relatively steep, demonstrating that the uncertainty level is low at the falling stage of the curve. The forecasting results of different methods at the curve peak are shown in Figure 6C. All the methods tend to underestimate the net load. The predicted values of QR and the proposed approach in the test set are more similar to the actual values as compared to the other methods. The proposed methodology quantifies the unpredictability of the net load, which provides informative implications for the system operator’s planning. Visually inspecting the forecasting results at curve valley in Figure 6D, all methods tend to overestimate the net load. By contrast, the presented approach catches the uncertainty caused by the PV generation, which is curial for the operation of power systems.
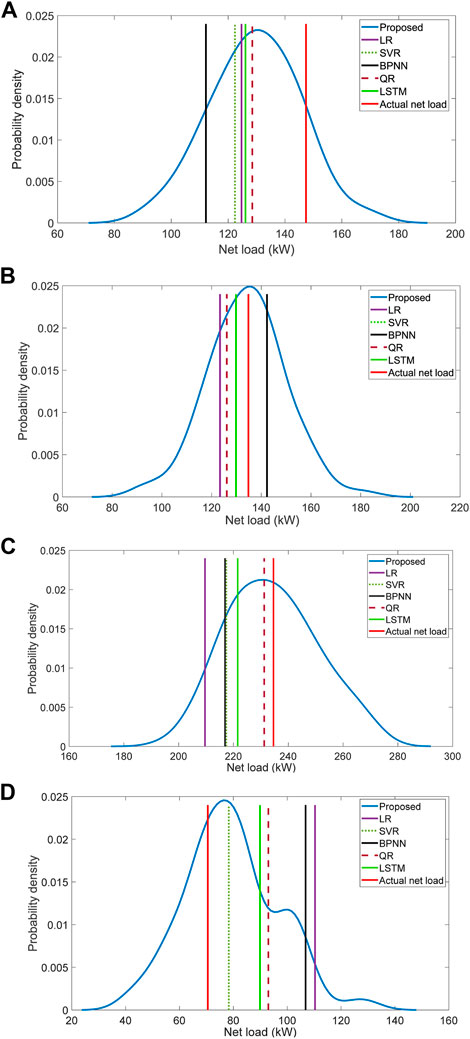
Figure 6. Forecasting results at different periods of the load curve. (A) Forecasting results at the rising stage of the curve. (B) Forecasting results at the falling stage of the curve. (C) Forecasting results at the curve peak. (D) Forecasting results at the curve valley.
4 Conclusion
This paper proposes a probabilistic prediction model for the prediction of net load based on a SVPG regression algorithm. Comparative tests with several point forecasting and probabilistic forecasting methods utilizing real-world historical data illustrate that: 1) the proposed model can achieve better point forecasting results than benchmarking methods. The performance achieved by the proposed approach can at most outperform that of other methods by 21.8%, 20.0%, and 19.6% in MAE, MAPE, and RMSE, respectively; 2) the proposed approach has better uncertainty quantification capability compared to the baseline methodology. It is more reliable and its PINAW value is 22.0% lower than the benchmark method at most. In our future research, how to obtain predictions quickly and accurately becomes the focus of the study.
Data availability statement
The original contributions presented in the study are included in the article/Supplementary material, further inquiries can be directed to the corresponding author.
Author contributions
WF: Conceptualization, Investigation, Methodology, Software, Supervision, Writing–original draft, Writing–review and editing. BD: Conceptualization, Data curation, Investigation, Methodology, Writing–original draft. TC: Investigation, Methodology, Software, Writing–original draft. ZZ: Conceptualization, Data curation, Investigation, Writing–original draft. YF: Formal Analysis, Investigation, Project administration, Software, Writing–original draft. YZ: Data curation, Methodology, Software, Writing–review and editing. LZ: Conceptualization, Data curation, Formal Analysis, Investigation, Methodology, Software, Writing–original draft. ZJ: Investigation, Methodology, Validation, Writing–original draft, Writing–review and editing, Data curation.
Funding
The author(s) declare that financial support was received for the research, authorship, and/or publication of this article. This work was supported by the Science and Technology Project of State Grid Sichuan Electric Power Company (B7194723R001).
Conflict of interest
Authors WF, BD, TC, ZiZ, YF, YZ, and LZ were employed by State Grid Sichuan Information & Telecommunication Company.
The remaining authors declare that the research was conducted in the absence of any commercial or financial relationships that could be construed as a potential conflict of interest.
The authors declare that this study received funding from State Grid Sichuan Electric Power Company. The funder had the following involvement in the study: study design, data collection and analysis.
Publisher’s note
All claims expressed in this article are solely those of the authors and do not necessarily represent those of their affiliated organizations, or those of the publisher, the editors and the reviewers. Any product that may be evaluated in this article, or claim that may be made by its manufacturer, is not guaranteed or endorsed by the publisher.
References
Ausgrid 2014 (2015). Solar home electricity data [DB/OL]. Available at: https://www.ausgrid.com.au/-/media/Documents/Reports-andResearch/Solar-Home-Electricity-Data/20112012-Solar-homeelectricity-data-v2.
Cao, D., Hu, W. H., Zhao, J. B., Huang, Q., Chen, Z., and Blaabjerg, F. (2020b). A multi-agent deep reinforcement learning based voltage regulation using coordinated PV inverters. IEEE Trans. Power Syst. 35 (5), 4120–4123. doi:10.1109/tpwrs.2020.3000652
Cao, D., Hu, W. H., Zhao, J. B., Zhang, G. Z., Zhang, B., Liu, Z., et al. (2020a). Reinforcement learning and its applications in modern power and energy systems: a review. J. Mod. Power Syst. and Clean Energy 8 (6), 1029–1042. doi:10.35833/mpce.2020.000552
Cao, X., Dong, S., Wu, Z., and Jing, Y. (2015). “A data-driven hybrid optimization model for short-term residential load forecasting, in ”Proceeding IEEE international conference on computer and information Technology; ubiquitous computing and communications; dependable, autonomic and secure computing; pervasive intelligence and computing, Liverpool, UK, October 26-28, 2015 (IEEE), 283–287.
Dhawale, P. G., Kamboj, V. K., Bath, S. K., Raboaca, M. S., and Filote, C. (2024). Integrating renewable energy and plug-in electric vehicles into security constrained unit commitment for hybrid power systems. Energy Rep. 11, 2035–2048. doi:10.1016/j.egyr.2024.01.027
Feng, C., Sun, M., and Zhang, J. (2020). Reinforced deterministic and probabilistic load forecasting via $Q$ -learning dynamic model selection. IEEE Trans. Smart Grid 11 (2), 1377–1386. doi:10.1109/tsg.2019.2937338
Gao, X. Y., Wang, Y., Gao, Y., Sun, C. Z., Xiang, W., and Yue, Y. M. (2018). Short-term load forecasting model of GRU network based on deep learning framework. 2018 2nd IEEE Conf. Energy Internet and Energy Syst. Integration EI2, 1–4. doi:10.1109/EI2.2018.8582419
He, Y., Xu, Q., Wan, J., and Yang, S. (2016). Short-term power load probability density forecasting based on quantile regression neural network and triangle kernel function. Energy 114, 498–512. doi:10.1016/j.energy.2016.08.023
Hong, T., and Shu, F. (2016). Probabilistic electric load forecasting: a tutorial review. Int. J. Forecast. 32 (3), 914–938. doi:10.1016/j.ijforecast.2015.11.011
Hu, J. X., Hu, W. H., Cao, D., Sun, X. W., Chen, J. J., Huang, Y. H., et al. (2024). Probabilistic net load forecasting based on transformer network and Gaussian process-enabled residual modeling learning method. Renew. Energy 225, 120253. doi:10.1016/j.renene.2024.120253
Kaur, A., Nonnenmacher, L., and Coimbra, C. F. (2016). Net load forecasting for high renewable energy penetration grids. Energy 114, 1073–1084. doi:10.1016/j.energy.2016.08.067
Kong, W. C., Dong, Z. Y., Jia, Y., Hill, D. J., Xu, Y., and Zhang, Y. (2017). Short-term residential load forecasting based on LSTM recurrent neural network. IEEE Trans. Smart Grid 10 (1), 841–851. doi:10.1109/tsg.2017.2753802
Li, S. Y., Ma, H. Y., Zhang, Y. D., Wang, S., Guo, R., He, W., et al. (2023). Emergency evacuation risk assessment method for educational buildings based on improved extreme learning machine. Reliab. Eng. Syst. Saf. 238, 109454. doi:10.1016/j.ress.2023.109454
Liu, J., Dong, C., Liu, G. Y., and Yu, J. L. (2014) “Short-term net feeder load forecasting of microgrid considering weather conditions,” in 2014 IEEE international energy conference (ENERGYCON), 1205–1209.
Prasad, R. K., Sarmah, R., Chakraborty, S., and Sarmah, S. (2023). NNVDC: a new versatile density-based clustering method using k-Nearest Neighbors. Expert Syst. Appl. 227, 120250. doi:10.1016/j.eswa.2023.120250
Ratnam, E. L., Weller, S. R., Kellett, C. M., and Murray, A. T. (2017). Residential load and rooftop PV generation: an Australian distribution network dataset. Sustain. Energy 36 (8), 787–806. doi:10.1080/14786451.2015.1100196
Saber, A. Y., and Alam, A. K. M. R. (2017). “Short term load forecasting using multiple linear regression for big data,” in 2017 IEEE symposium series on computational intelligence (SSCI), 1–6.
Sepasi, S., Reihani, E., Howlader, A. M., Roose, L. R., and Matsuura, M. M. (2017). Very short term load forecasting of a distribution system with high PV penetration. Renew. Energy 106, 142–148. doi:10.1016/j.renene.2017.01.019
Sun, M., Zhang, T., Wang, Y., Strbac, G., and Kang, C. (2020). Using Bayesian deep learning to capture uncertainty for residential net load forecasting. IEEE Trans. Power Syst. 35 (1), 188–201. doi:10.1109/tpwrs.2019.2924294
Taieb, S. B., Huser, R., Hyndman, R. J., and Genton, M. G. (2016). Forecasting uncertainty in electricity smart meter data by boosting additive quantile regression. IEEE Trans. Smart Grid 7 (5), 2448–2455. doi:10.1109/tsg.2016.2527820
Tan, M., Yuan, S., Li, S., Su, Y., Li, H., and He, F. (2020). Ultra-short-term industrial power demand forecasting using LSTM based hybrid ensemble learning. IEEE Trans. Power Syst. 35 (4), 2937–2948. doi:10.1109/tpwrs.2019.2963109
Wang, Y., Zhang, N., Chen, Q., Kirschen, D. S., Li, P., and Xia, Q. (2018). Data driven probabilistic net load forecasting with high penetration of behind the-meter PV. IEEE Trans. Power Syst. 33 (3), 3255–3264. doi:10.1109/tpwrs.2017.2762599
Wang, Y., Zhang, N., Tan, Y., Hong, T., Kirschen, D. S., and Kang, C. (2019). Combining probabilistic load forecasts. IEEE Trans. Smart Grid 10 (4), 3664–3674. doi:10.1109/tsg.2018.2833869
Xie, J. R., and Hong, T. (2018). Temperature scenario generation for probabilistic load forecasting. IEEE Trans. Smart Grid 9 (3), 1–1687. doi:10.1109/tsg.2016.2597178
Xiong, L. S., Liu, X. K., Zhang, D. H., and Liu, Y. H. (2021). Rapid power compensation-based frequency response strategy for low-inertia power systems. IEEE J. Emerg. and Sel. Top. Power Electron. 9 (4), 4500–4513. doi:10.1109/jestpe.2020.3032063
Xu, F., Cun, X., Yan, M., Yuan, H., Wang, Y., and Lai, L. (2018). Power market load forecasting on neural network with beneficial correlated regularization. IEEE Trans. Industrial Inf. 14 (11), 5050–5059. doi:10.1109/tii.2017.2789297
Zhang, W., Quan, H., and Srinivasan, D. (2019). An improved quantile regression neural network for probabilistic load forecasting. IEEE Trans. Smart Grid 10 (4), 4425–4434. doi:10.1109/tsg.2018.2859749
Zhao, P. F., Cao, D., Hu, W. H., Huang, Y. H., Hao, M., Chen, Z., et al. (2023). Geometric loss-enabled complex neural network for multi-energy load forecasting in integrated energy systems. IEEE Trans. Power Syst., 1–13. doi:10.1109/tpwrs.2023.3345328
Zhao, P. F., Hu, W. H., Cao, D., Zhang, Z. Y., Huang, Y. H., Dai, L. C., et al. (2024). Probabilistic multienergy load forecasting based on hybrid attention-enabled transformer network and Gaussian process-aided residual learning. IEEE Trans. Industrial Inf. 20, 8379–8393. doi:10.1109/tii.2024.3366946
Zhu, X. X., Xue, J. F., Hu, M., Liu, Z. T., Gao, X. X., and Huang, W. J. (2023). Low-carbon economy dispatching of integrated energy system with P2G-HGT coupling wind power absorption based on stepped Carbon emission trading. Energy Rep. 10, 1753–1764. doi:10.1016/j.egyr.2023.08.023
Keywords: net load forecasting, power system, Gaussian process, uncertainties, probabilistic forecasting
Citation: Feng W, Deng B, Chen T, Zhang Z, Fu Y, Zheng Y, Zhang L and Jing Z (2024) Probabilistic net load forecasting based on sparse variational Gaussian process regression. Front. Energy Res. 12:1429241. doi: 10.3389/fenrg.2024.1429241
Received: 07 May 2024; Accepted: 12 June 2024;
Published: 12 September 2024.
Edited by:
Yonghui Liu, Hong Kong Polytechnic University, Hong Kong, SAR ChinaReviewed by:
Bi Liu, Sichuan Agricultural University, ChinaXiaokang Liu, Polytechnic University of Milan, Italy
Bin Zhang, Aalborg University, Denmark
Copyright © 2024 Feng, Deng, Chen, Zhang, Fu, Zheng, Zhang and Jing. This is an open-access article distributed under the terms of the Creative Commons Attribution License (CC BY). The use, distribution or reproduction in other forums is permitted, provided the original author(s) and the copyright owner(s) are credited and that the original publication in this journal is cited, in accordance with accepted academic practice. No use, distribution or reproduction is permitted which does not comply with these terms.
*Correspondence: Wentao Feng, MTE3OTYyMzk5MUBxcS5jb20=