 Wentao Feng
 Bingyan Deng1
94% of researchers rate our articles as excellent or good
Learn more about the work of our research integrity team to safeguard the quality of each article we publish.
Find out more
ORIGINAL RESEARCH article
Front. Energy Res., 19 July 2024
Sec. Sustainable Energy Systems
Volume 12 - 2024 | https://doi.org/10.3389/fenrg.2024.1428624
This article is part of the Research TopicUrban Multi-energy System Networks with High Proportion of Renewable EnergyView all 7 articles
With the growing concern for the environment, sustainable development centred on a low-carbon economy has become a unifying pursuit for the energy industry. Integrated energy systems (IES) that combine multiple energy sources such as electricity, heat and gas are essential to facilitate the consumption of renewable energy and the reduction of carbon emission. In this paper, gas turbine (GT), carbon capture and storage (CCS) and power-to-gas (P2G) device are introduced to construct a new carbon capture coupling device model, GT-CCS-P2G (GCCP), which is applied to the integrated electrical and gas system (IEGS). Multi-agent soft actor critic (MASAC) applies historical trajectory representations, parameter spatial techniques and deep densification frameworks to reinforcement learning for reducing the detrimental effects of time-series data on the decisional procedure. The energy scheduling problem of IEGS is redefined as a Markov game, which is addressed by adopting a low carbon economic control framework based on MASAC with minimum operating cost and minimum carbon emission as the optimization objectives. To validate the rationality and effectiveness of the proposed low-carbon economy scheduling model of IEGS based on MASAC, this paper simulates and analyses in integrated PJM-5 node system and seven nodes natural gas system.
With population growth and accelerated industrialization, energy consumption is increasing, along with significant greenhouse gas emission. These emissions have a huge impact on climate change, with issues such as extreme weather events, sea-level rise and ecosystem collapse (Ma et al., 2024; Wojtaszek et al., 2024). It is therefore crucial to adopt energy-saving and emission-reduction measures (Li et al., 2019). By promoting the use of renewable energy, improving energy efficiency and adopting cleaner production technologies, we can reduce dependence on fossil fuels and lower greenhouse gas emissions (Liu et al., 2024; Okedu et al., 2024).
The United Nations Framework Convention on Climate Change, adopted by the United Nations in 1994, became the world’s first international treaty to reduce emissions of greenhouse gases such as carbon dioxide and methane, requiring all countries in the world to take some responsibility for carbon emission reduction (Werksman, 1994). In 2005, countries continued to sign the Kyoto Protocol, which provided programs to reduce carbon emissions and established corresponding cooperation mechanisms for countries to deal with carbon emission reduction, thus advancing the development of global carbon emission reduction (Gallo et al., 2018). The Paris Agreement, signed in Paris in 2015, requires developed countries, while accomplishing their own carbon emission reduction tasks, to provide certain financial support and related technologies to developing countries, contributing to the fulfillment of the global carbon emission reduction tasks (Elsayed et al., 2024). In 2021, China proposes to vigorously develop renewable energy sources such as wind power and photovoltaic, laying a solid foundation for achieving carbon peak by 2030 and carbon neutrality by 2060 (Zhong et al., 2023). However, renewable energy sources such as wind turbine (WT) and photovoltaic (PV) have problems such as chronology, stochasticity and volatility. When a high percentage of renewable energy is injected into the grid it can bring about problems such as sudden voltage changes (Cao et al., 2020a; Cao et al., 2021) and system collapse (Barker and Mello, 2000; Dulăua et al., 2013), which has also become the focus of carbon emission reduction (Gao and Zhang, 2024).
In traditional energy dispatching, various energy sources are dispatched by different sub-networks (e.g., electrical network, gas network, and heat/cooling network), in which the sub-networks are controlled by different departments. In actual operation, power grids are coupled with each other in terms of production, transmission, distribution and utilization. However, a singular scheduling makes it impossible to form an effective information sharing and energy complementarity between sub-networks, so as to fail to guarantee the system stability. Multi-energy flow deployment can improve the efficiency of energy utilization, reduce the total cost of system operation, and realize the stability and safety of system operation (Liu et al., 2018; Wang et al., 2023a). Consequently, breaking the limitations of traditional energy architecture and constructing multi-energy network architecture, such as electricity-heat-gas-cooling integrated energy system (IES) to tap the potential of energy transmission between different systems, is one of the core contents of research by scholars in related fields in various countries (Liu et al., 2023).
Substituting conventional thermal power generation with renewable energy sources such as wind and photovoltaic, reducing the utilization rate of conventional thermal power plants by applying power-to-gas (P2G) and gas turbines (GT), and achieving carbon dioxide (CO2) absorption and utilization are significant in reducing carbon emissions. Carbon capture and storage (CCS) provides an alternative and effective technology for dealing with CO2 emissions, with 92 per cent of the CO2 produced by coal-fired units being captured and stored in the IES. It can be seen that the combination of P2G and CCS technologies can effectively reduce and improve carbon emissions, and the carbon capture technology also improves the carbon feedstock for methane generation by P2G, thereby reducing the amount of CO2 generated by coal-fired units in the IES (Gu et al., 2017; Yang et al., 2019).
He et al. (2022) constructs a near-zero emission park-level IES considering uncertainty with P2G and CCS. Zhang et al. (2020) constructed an integrated electricity-gas energy system (IEGS) optimization model considering P2G and wind power uncertainty based on distributed robust optimization. The superiority of the low carbon emission is effectively verified by the results of three different IEGSs. In order to determine the optimal capacity of the gas turbine and P2G technology for different IEGS, a Monte Carlo based optimization framework has been proposed in Tabebordbar et al. (2023). The experimental results demonstrate the superiority and sophistication of the reliability-oriented optimization framework. However the algorithms adopted in the above mentioned literature struggle to attain the satisfactory results in the presence of the complexity and diversity of the system, the mutual constraints of the coupled energy components and the large dimension of the optimization objective.
With the advancement of science and technology and the rapid progress of artificial intelligence technology, many scholars have proposed a variety of optimization and control strategies based on machine learning in the literature. Reinforcement learning (RL) is currently the most popular method to solve the control optimization problem, which includes both agent and environment (Cao et al., 2020b; Zhang et al., 2023a; Cao et al., 2023; Li et al., 2024a, 2024c). Zhang et al. (2023b) proposed a two-timescale energy management strategy based on multi-agent deep RL (MADRL) for residential multicarrier energy system, where the optimal solution of each coupling element in the system is obtained to achieve the optimal control effect. Aiming at the joint operation of multiple microgrids, a MADRL-based energy management method is proposed in Li et al. (2023). Each microgrid as an agent performs a game with each other, and the continuous training ensures that each agent chooses the local optimal strategy under the global optimal situation. Taking into account the different characteristics between the electricity and the heat network, Monfaredi et al. (2023) achieves an hourly optimal scheduling strategy by scheduling multiple renewable energy sources. During the optimization process, MADRL is applied to achieve the information interaction between the energy storage system, new energy sources, heat and power conversion system and the grid, which results in the desirable control strategy of the system to improve the energy utilization. In order to address the distributed energy management problem of multi-area IES, a MADRL-based energy management strategy is proposed, which effectively decreases the influences of renewable energy uncertainty on the decision-making of the optimization model by exploiting the generalization capability of RL (Ding et al., 2024). A MADRL-based building energy management model has been proposed which achieves excellent dynamic decision making through centralized training and distributed execution (Wang et al., 2024).
This paper proposes a low carbon and economic IEGS scheduling method based on multi-agent soft actor critic (MASAC), which achieves a bidirectional coupling between the electrical network and gas network by utilizing the P2G and GT. the CCS captures the CO2 produced by the power plant as feedstock for the CH4 produced by the P2G, which will reduce the carbon emissions of the system, and the excess CO2 will be purchased through the carbon trading market to achieve a zero-carbon system. The main contributions of this paper can be summarized as.
1) A GT-CCS-P2G (GCCP) model is presented to achieve a two-way coupling between the electric and gas grids in IEGS.
2) The electrical network and gas network are separately modelled as an agent to enhance the generalization capability of the energy dispatch model through reciprocal gaming.
3) A novel energy scheduling strategy model based on MASAC exploiting historical data is proposed.
The reminder structure of this article is as follows. Section 2 focuses on the theory of electrical and gas networks and related coupling elements. Section 3 describes the algorithmic solution process of the method proposed in this paper. Section 4 verifies the superiority of the proposed method through a detailed analysis of examples. Section 5 indicates the summary of the whole paper.
The detailed structure of IEGS is shown in Figure 1, including the electrical and gas networks. Electricity in the power network is supplied by thermal power plants, GT and WT, where the CO2 from the thermal power plants is captured by CCS and used as feedstock for methane generation by P2G. CO2 from thermal power plants is converted to CH4 by P2G treatment which is transmitted to the natural gas network. CO2 that cannot be captured by CCS will be purchased for carbon emission trading rights to achieve the zero carbon target. Perfectly realize the bi-directional coupling between electrical and gas networks through GT, CCS and P2G, enabling a bi-directional flow of energy. Battery energy storage system (BESS) as a rechargeable and dischargeable energy device enhances the proportion of renewable energy consumed by the electrical network.
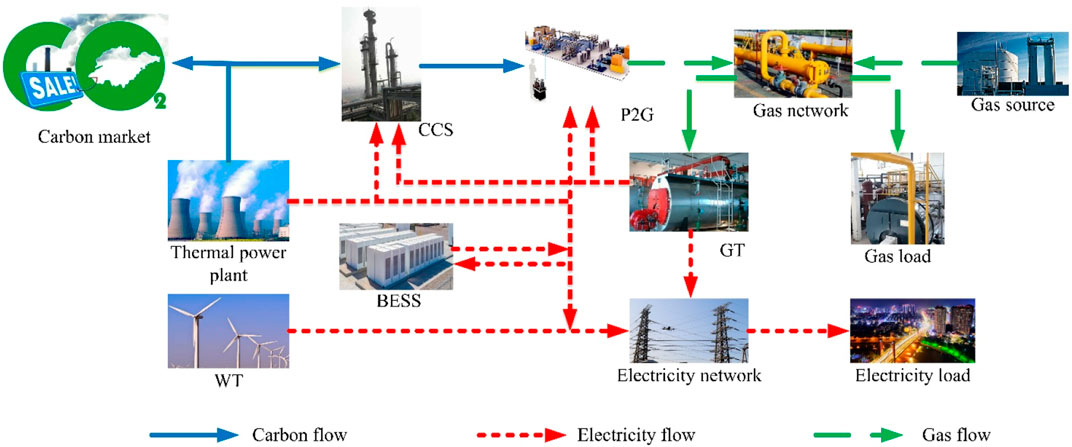
Figure 1. The structure of the IEGS.
In a natural gas system, natural gas is transmitted to the consumer through a pipeline, which consists of a gas source, a gas load, a transmission pipeline, and a compressor (Zhang et al., 2024a). Natural gas system modelling is mainly gas source, load, nodal pressure and pipeline flow modelling.
The main components of a typical natural gas network are gas wells and gas storage stations. In practice, the supply of natural gas from gas wells is not unlimited with certain constraints that should exist in its supply. It can be expressed as Eq. 1.
where
During the transport of natural gas, its flow rate does not decrease. Analogous to voltage losses in power system, nod al pressure losses will exist at the beginning and end of a natural gas pipeline. Flow always moves from the high pressure node to the low pressure node in the pipeline, with the magnitude depending on the length of the pipeline, diameter, operating temperature and pressure. The relationship between pipe flow rate magnitude and pipe pressure can be expressed as Eqs 2, 3 (Dai et al., 2020).
where
The correlation matrix between the injected flow at each node and the pipeline flow can be established by using the forward backward generation method for the acyclic natural gas network. The correlation matrix between the injection flow and the pipeline flow at each node can be established for the non-cyclic natural gas network by using the forward back generation method, which is similar to the concept of the generation shift factor (GSF) in the direct current flow method of the power system. The relationship between the natural gas supply and load at each node with the pipeline flow is represented by.
where n denotes the nature gas injection node,;
A link between each pipe node is established based on Eq. (4). Therefore, the pressure in each node can be obtained from the acquired pipeline flow rate based on Eq. (2).
As the distance of gas transmission increases, pressure losses between nodes can lead to low pressure at the end of the pipeline which limits the transmission capacity of the network. The most important part of the compressor station is the compressor which consumes electrical energy that increases the pressure of the natural gas. The pressurization station considered in this paper is of fixed variable ratio and the energy consumed is from electrical energy contained in the load of the grid node (Bai et al., 2016). It can be presented as Eqs 5, 6.
where
The results of power flow calculations are the basis for analyzing the feasibility, safety, reliability and economics of grid planning and supply options. Power flow analyses perform a vital role in grid operation modelling and designing which can be calculated as Eqs 7, 8.
where
The GT and the P2G technology enable the deep coupling of the power system with the natural gas system, thereby enabling a bi-directional conversion of the electricity-gas system.
The GT can be viewed as a power source in a power system, however in the natural gas system as the load. The relationship between the power generated and the natural gas consumed can be expressed as Eq. 9 (Ji et al., 2013).
where
P2G technology consists of two main steps: the electrolysis of water and the synthesis of methane. The chemical equations for the two reactions are expressed as Eqs 10, 11 (Clegg and Mancarella, 2015).
The hydrogen produced in the first step can be stored in a hydrogen storage facility or injected into the network in a mixture of natural gas, but the concentration is limited due to safety factors. The methane produced in the second step can be stored in large quantities or transported to other places where it is necessary, which absorbs a large amount of CO2 and reduces carbon emissions. P2G not only strengthens the coupling of the electricity-gas network, but also consumes the electricity generated by the new energy to increase the proportion of new energy consumption. The conversion relationship between P2G consumption of electrical energy and the generation of natural gas can be demonstrated as Eqs 12, 13.
where
CCS has been identified as a key and promising technology for future power generation (Zhang et al., 2024). Capture and storage are the two main phases of current carbon capture technology. The capture process is complex, and the main commercially available CO2 capture methods fall into three categories: oxygenated fuel combustion, pre-combustion and post-combustion technologies. Post-combustion technology deals with the CO2 containing gases produced by conventional fossil fuel plants and achieves the process of separating CO2 from other gases. Pre-combustion technology, on the other hand, is the process of pre-treating the fuel to sort the carbon in it from other substances. Unlike the first two technologies, oxy-fuel combustion technology changes the environment in which the fuel is burned, allowing it to be burned in an environment containing only oxygen to obtain carbon dioxide and water. Of these, post-combustion is currently the more widely used method, and it is also the most cost-effective of the three CO2 capture technologies. Sequestration technology begins with the creation of pipelines to transport carbon dioxide, which is then sequestered by compressors.
The electrical energy consumed by the CCS during operation is expressed as Eq. 14.
where
Conventionally, carbon capture power plants have operated CCS in combination with thermal power plants or CHP. However, to better reduce carbon emissions, a conventional power plant is replaced by GT coupled with CCS and P2G in this paper, which enhances the coupling of electrical energy flow. In terms of carbon emission, the CCS captures the carbon dioxide emitted by the GT and supplies the P2G with CO2 to generate methane. In terms of energy supply, the GT unit supplies electricity to P2G and CCS, meanwhile P2G can also supply a small amount of natural gas to the GT. In terms of economic cost, P2G avoids the cost of purchasing CO2 and CCS reduces purchase electricity from the main grid. The energy flow route of GT-CCS-P2G (GCCP) is shown in Figure 2.
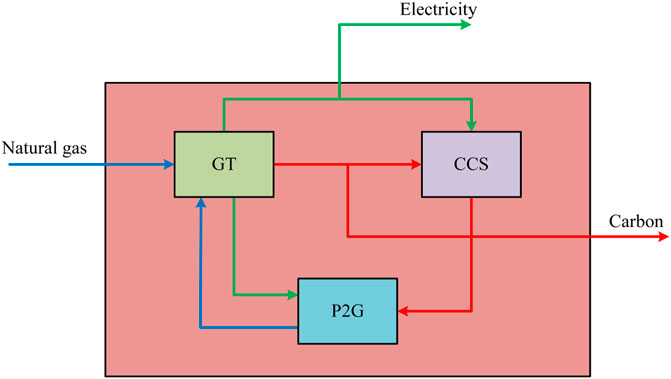
Figure 2. GCCP energy flow.
The power consumed by P2G and CCS in the GCCP combined operation model is supplied by GT and the excess power will participate in the power network dispatch which can be calculated as Eq. 15.
where
The GT, CCS and P2G power constraint can be formulated as Eqs 16–18.
where
During operation of the GCCP, GT burning of natural gas releases CO2, which can be expressed as Eq. 19.
where
During GCCP operation, P2G reduces the carbon emissions of the system by capturing CO2. P2G The synthesis of CH4 is divided into two main steps: the first step is the electrolysis of water, in which the principle of electrolysis of water is used to convert electrical energy into hydrogen energy in an electrolytic tank. The second step is methanation, where the hydrogen energy generated is converted to CH4 and heat energy in a Sabatier reaction with carbon dioxide in a methane reactor which can be calculated as Eq. 20.
where
In the GCCP coupling model, the CCS captures CO2 from GT operation simultaneously providing P2G with the CO2 required for CH4 production. CH4. The carbon emissions from the GCCP can be expressed as follow (Eq. 21).
where
In consideration of the above-mentioned model, the energy scheduling of the IEGS system is viewed as an optimization problem which involves the minimization of the following objective function (Eq. 22).
where T represents the length of the operating hours;
The electricity consumed by the CCS to collect CO2 from the gas produced by the thermal power unit through compression and separation mainly consists of fixed energy consumption and operation energy consumption. The detailed calculation is expressed as follows (Eqs 23–26).
where
Similar to CCS, the cost of P2G can be expressed as (Eqs 27–29).
where
The remaining portion of the costing is shown below (Eqs 30–33).
where
The constraints that need to be satisfied during power system operation include power balance, nodal voltage limits and thermal generator output constraints (Eqs 34–37).
where
The gas network system consists of three main components: the gas supply source, the gas network and the gas load (Eqs 38, 39).
where
The constraints for other auxiliary equipment are expressed as follows Eqs 40–41.
where
The energy management optimization problem can be modelled as a Markov game which is solved by the presented MADRL algorithm. The Markov game contains several components (Li et al., 2023).
• Agent: In the Markov game, the power grid and the gas grid are respectively modeled as an agent.
• Environment: Before each decision, the agents collect information from the nodes in their corresponding region. Each agent makes a decision based on the local observation information which calculates the reward value for each agent based on the decision.
• State: The state ensemble
where
• Action: The action ensemble
where
• Reward: The reward value obtained by the system is the value returned when each agent performs an action based on the current state. Each agent shares the same reward function, which is expressed as Eq. 46.
where
• State transition function: It represents the probability of state transfer to the next step after the agent executes the action.
The energy supply optimization problem of IEGS is transformed into a Markov game, where the grid agent and the gas agent search for optimal actions by continuously learning the game to attain the best control. In the specific training process, each agent provides the corresponding action by observing part of the state, with the corresponding reward value passed to the agent. While obtaining the reward value, the agent can observe the environment state at the next time. As the number of iterations increases, each agent continuously adjusts its action value through mutual games to maximize the reward value.
Each agent has the action-critic network framework which the action network is responsible for strategy program evaluation and the critic network is responsible for strategy parameter updating. Through the interaction and iteration between the two networks, the parameters of the network are continuously updated with the reward value gradually moving towards maximization. The proposed method adopts MASAC (Li X. Y. et al., 2024; Hu et al., 2024) as a kernel, which effectively mitigates the influence of environmental data fluctuations on energy scheduling decisions by sharing environmental and historical information between agents. Each intelligence in MASAC has four deep neural networks, namely, actor network and critic network and target actor network and target critic network. During the training process, only the parameters of the actor network and the critic network are updated, whereas the target actor network and the target critic network are employed to stabilize the learning effect of the actor network and the critic network.
The target critic network is mainly employed to mitigate the rate of parameter updates to balance the stability and speed of the training process. It is presented as Eq. 47.
where
where
The gradient of the criticized network parameters
where
The expression for the value function in the actor network is Eq. 52:
where
This leads to the gradient function of the actor network value function
where
In order to prevent the value function in the critic network from overly agreeing with the Q-value calculated by the target value function, a corresponding noise function
In the training process, the evaluation network is mainly to provide guidance for the actor network to select the optimal action, if the difference between the Q value solved by the critic network and the target value function is huge, the action learned by the actor network will be dispersed and the critic network will be unstable in the learning of the value function. Therefore, in the parameter updating process, the parameters of both the target actor network and the target critic network are updated after a period of training, which updates their relevant parameters through soft updating as Eqs 57–58 (Li et al., 2023).
where
The detailed flowchart of the MADRL algorithm proposed in this paper is shown in Figure 3.
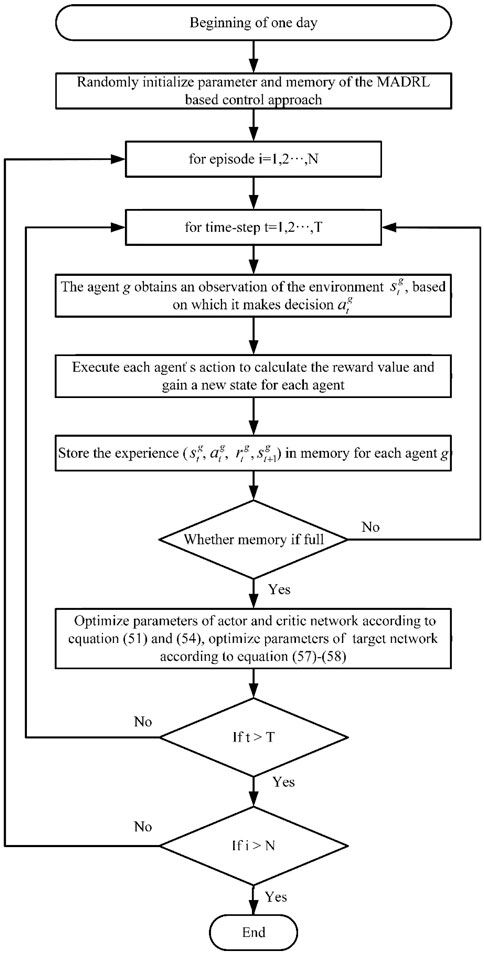
Figure 3. Training process of the proposed MADRL method.
In this session, the parameters of the IEGS and the proposed algorithm are firstly described, followed by an example to assess the effectiveness and superiority of the proposed approach.
In order to effectively evaluate the performance of the proposed scheme, the integrated PJM-5 node system (Li et al., 2017) and seven nodes natural gas system (Li et al., 2008) are selected for experimental analysis, where P2G is connected to the WT at PJM-5 node E, which decreases the wind abandonment rate of the WT and the P2G simultaneously achieves the CH4 transmission through node three of the gas system. GT achieves the conversion between gas and electricity by connecting to the PJM-5 node D and the gas system node 6. The specific system architecture is shown in Figure 4. The electricity price is divided into three different prices as shown in Table 1, where the electricity price for 0:00–8:00 and 22:00–24:00 is $105.06/MW, for 8:00–12:00 and 18:00–22:00 is $130.36/MW and for the remaining hours is $177.24/MW. The price of gas sold from the two wells is 78.39$/MW. The price for purchasing carbon credits in the carbon market is 15$/ton. Detailed parametric data of IEGS can be found in (Li et al., 2023). Parameters of the proposed approach are shown in Table 2.

Figure 4. Framework diagram of integrated PJM-5 node power system and seven node gas system.
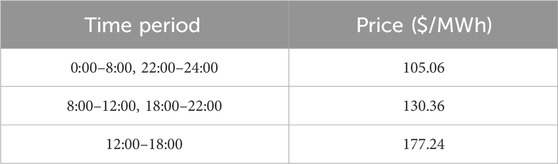
Table 1. Electricity price.
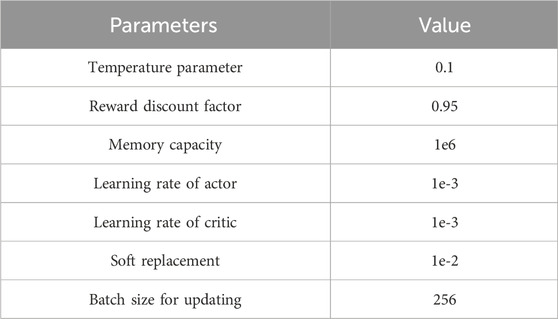
Table 2. Parameters of the proposed approach.
In order to verify the effectiveness and advancement of the proposed model, the following methods are selected for comparative analysis. The reward variation of the proposed method during the training process is shown in Figure 5, where the performance of the proposed method is evaluated by the variation of the reward value. Since the parameters of the action neural network are randomly initialized at the beginning of the training process, the agent is unaware of how to make decisions to reduce the total operating cost. Therefore, the agent chooses to explore the environment to gain more experience. The experience gained from the pre-training is stored in the experience pool to optimize the control strategy with the experience replay mechanism. Each iteration step samples a certain amount of historical training data from the experience pool for updated parameters of the action and critic neural network. As can be seen from the figure, the cumulative reward earned by the agent gradually increases during the process. At the end of 100 stochastic optimizations, the reward rises rapidly, and the curve starts to converge when the training reaches about 1,000 times.
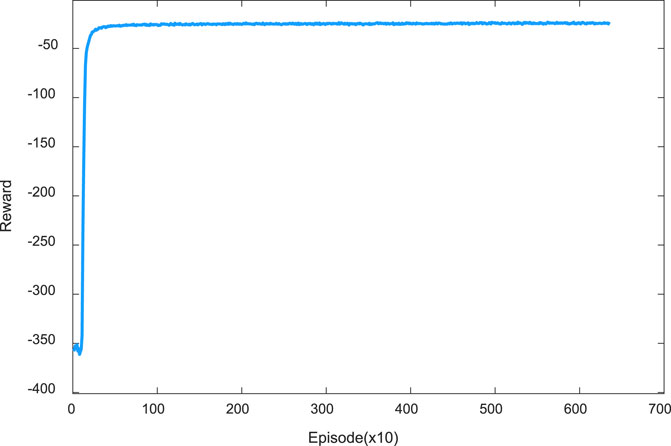
Figure 5. Convergence process of proposed method on the train set.
After several training sessions, the proposed model has acquired the ability to cogitate for optimal decision making in new environments. One particular day of data is chosen for the validation analysis, with specific information displayed in Figure 6. As can be seen, the power of the WT is higher in the early hours of the morning, while the electrical loads are smaller, leaving the system struggling to completely dissipate all the wind power. During the period 5:00–24:00, the power of WT has been less than the electrical load.
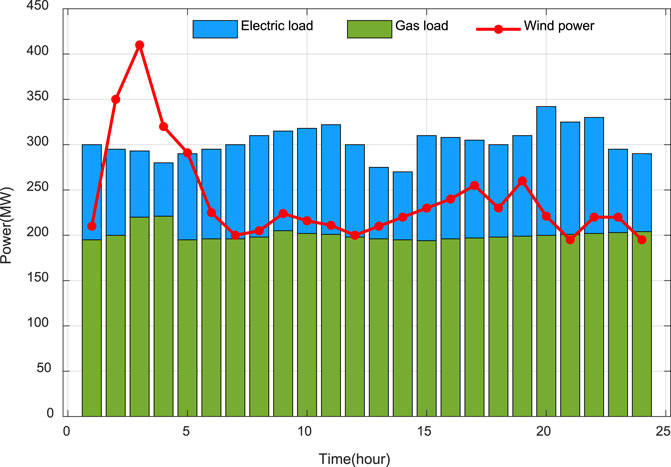
Figure 6. Load for a particular day on the test set.
In this paper, three algorithms, particle swarm optimization (PSO) (Du et al., 2023), multi-agent deep deterministic policy gradient (MADDPG) (Abid et al., 2024), and multi-agent twin delayed deep deterministic policy gradients (MATD3) (Wang et al., 2023b) are selected for comparative validation as a way to verify the reliability and robustness of the proposed approach. The specific results of the proposed method with other comparison schemes on the test set are shown in Table 3. PSO performs the worst in the face of complex IEGS such that the optimal scheduling scheme is not obtained. Compared to the PSO, MADDPG selects multiple agents for optimal scheduling. Coordinated management between energy sources is achieved using communication between agents to obtain better performance. MATD3 adds two sub-networks agents for Q-value estimation to solve the problem due to Q-value overestimation, which is a further improvement compared to MADDPG. The proposed scheme adopts MASAC as the kernel, which expands the stochasticity of the scheduling process by increasing the entropy function, to obtain the optimal scheduling strategy. The proposed approach represents a total cost reduction of 35,670.66$ and a reduction in carbon emission of 173.52 tons compared to PSO.
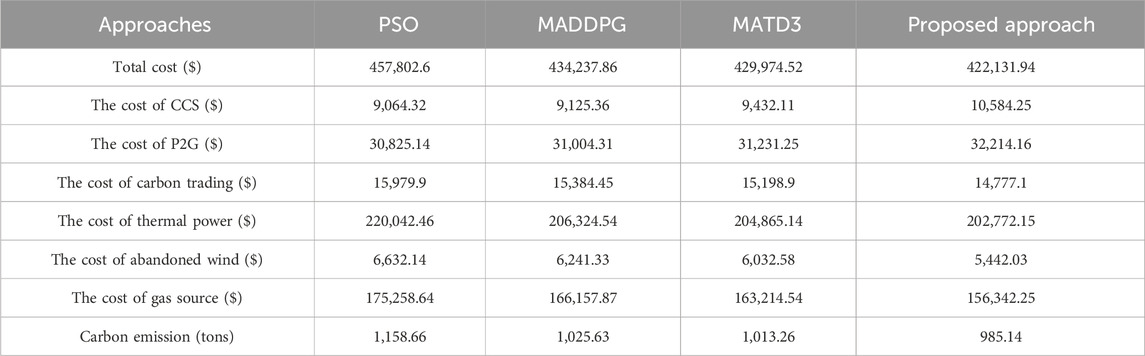
Table 3. Comparison results of various approaches on the test day.
The detailed outputs of the electrical system and the gas system in the proposed method on a particular day of the test set are presented in Figures 7, 8 respectively. From Figure 7, it can be observed that during the period 0:00–8:00, due to the lower electricity price and higher wind power output, P2G consumes more electricity for CH4 production, which reduces the CO2 release from the system while consuming wind power, and the GT is almost inactive at this time. During this period the BESS starts charging and the CCS is capturing carbon to consume electricity. During 8:00–12:00, as the price of electricity increases, the power consumed by the P2G and CCS starts to decrease, the GT gradually starts to work, and the BESS releases the stored power. During the period 12:00–18:00, when the tariff reaches its maximum value, the GT reaches its maximum power to achieve gas to power conversion, which reduces the cost of purchasing electricity for the system. It can also be seen from Figure 8 that the proposed model chooses to increase the power from electricity to gas when the electricity price is low. In contrast, when the electricity price is high, the proposed model chooses to increase the power of gas-to-electricity conversion.
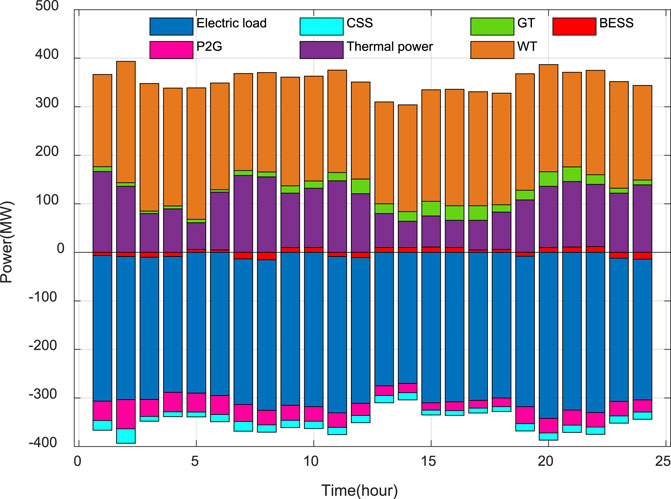
Figure 7. Optimization results for electrical system.
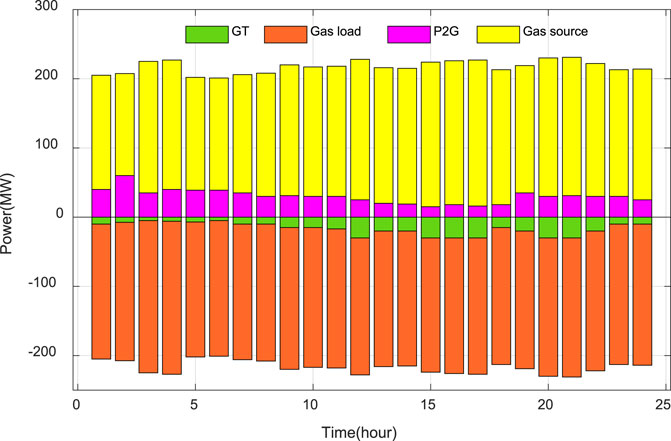
Figure 8. Optimization results for gas system.
In order to verify the validity of the GCCP model, this paper constructs four scenarios for simulation analysis. The economic scheduling strategy in scenario one does not consider CCS and P2G. The economic scheduling strategy in scenario two considers only CCS. The economic scheduling strategy in scenario three considers mainly P2G. The economic scheduling strategy in scenario four introduces the GCCP proposed in this paper.
The comparison of CO2 emissions under different scenarios is displayed in Figure 9. Comparing the carbon emissions of scenario one and scenario 2, it can be observed that the carbon capture device
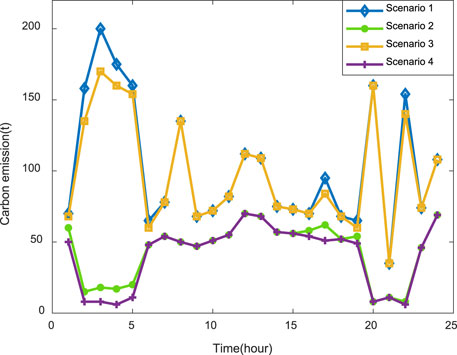
Figure 9. Comparison of carbon emission.
Can significantly reduce the CO2 emissions of the IEGS, which is about 53.4% of the total emissions, with a total of 1,210 tons of CO2 reduced in scenario two compared with scenario 1. By comparing scenario one and scenario 3, the CO2 emissions of the system are almost unchanged because the CO2 demanded for P2G is purchased from an external source. The higher carbon emissions in scenario one than in scenario three in the 0:00–6:00 interval are due to the conversion of excess wind energy achieved through P2G, which reduces the amount of gas purchased online to reduce carbon emissions. When the GCCP model was introduced in scenario 4, the carbon emissions at each hour are significantly reduced compared to the other scenarios, with a reduction of 1,476 tons compared to scenario 1.
The wind power output under different scenarios is shown in Figure 10. Comparing scenario 2 with scenario 1, which is the peak period of wind power output from 1:00 to 5:00, it can be observed that there is a partial improvement in wind power consumption after the use of the CCS device. Comparing scenario one and scenario 3, it is clear that the P2G device can significantly increase the wind power output, and the wind power generated in scenario three does not achieve the maximum value due to the maximum input power of the device. In scenario 4, the GCCP coupling device is adopted to significantly enhance the wind power consumption, which reaches 92.81%.
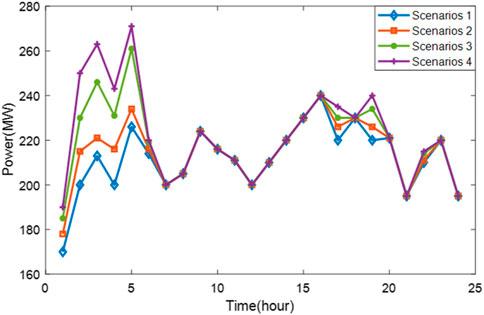
Figure 10. Comparison of wind power consumption.
The voltage values of the proposed approach at each moment of each node on a certain day of the test set are shown in Figure 11, from which it can be seen that although the voltage values of all nodes before and after the moment have a large volatility, the voltage has been located in the range of [0.96, 1.04]. It conforms to the requirement of stability and security operation of the system, which again proves the effectiveness of the proposed approach in voltage control.
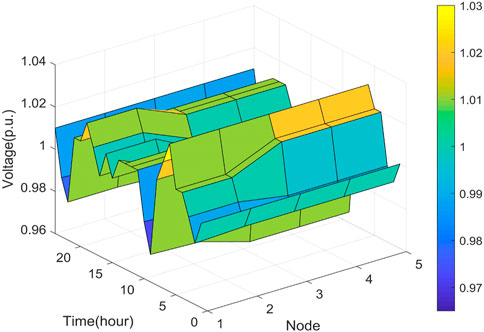
Figure 11. Voltage profiles of power system.
In this study, a MADRL-based IEGS scheduling approach considering GCCP with simultaneous consideration of system security and economy is proposed. MADRL replicates historical data to address the negative impacts caused by time series data with efficient exploratory techniques for seeking optimization. Agents seek optimal control strategies by continuously interacting with each other with information. The detailed conclusions of the study are summarized as follows: (1) Compared to several other methods, the proposed controlling framework and approach provide the best performance. (2) The explainability of the properties in detail in the IEGS provides additional evidence of validation for the proposed controlling framework. (3) The effectiveness of the proposed GCCP model is verified through four different scenarios, reducing carbon emissions by 1,476 tons and increasing the proportion of wind power consumption by 4.41% compared to Scenario 1.
The original contributions presented in the study are included in the article/Supplementary Material, further inquiries can be directed to the corresponding author.
WF: Conceptualization, Data curation, Writing–original draft, Writing–review and editing. BD: Conceptualization, Data curation, Investigation, Writing–original draft. ZZ: Data curation, Investigation, Methodology, Writing–original draft. HJ: Project administration, Supervision, Validation, Writing–review and editing. YZ: Conceptualization, Data curation, Formal Analysis, Investigation, Methodology, Writing–review and editing. XP: Data curation, Formal Analysis, Investigation, Methodology, Software, Writing–review and editing. LZ: Conceptualization, Methodology, Software, Writing–original draft. ZJ: Methodology, Project administration, Software, Validation, Writing–original draft, Writing–review and editing.
The author(s) declare that financial support was received for the research, authorship, and/or publication of this article. This work was supported by the Science and Technology Project of State Grid Sichuan Electric Power Company (B7194723R001).
Authors WF, BD, ZZ, HJ, YZ, XP, and LZ were employed by State Grid Sichuan Information and Telecommunication Company.
The remaining authors declare that the research was conducted in the absence of any commercial or financial relationships that could be construed as a potential conflict of interest.
The authors declare that this study received funding from State Grid Sichuan Electric Power Company. The funder had the following involvement in the study: study design, data collection and analysis, decision to publish.
All claims expressed in this article are solely those of the authors and do not necessarily represent those of their affiliated organizations, or those of the publisher, the editors and the reviewers. Any product that may be evaluated in this article, or claim that may be made by its manufacturer, is not guaranteed or endorsed by the publisher.
Abid, M. S., Apon, H. J., Hossain, S., Ahmed, A., Ahshan, R., and Lipu, M. S. H. (2024). A novel multi-objective optimization based multi-agent deep reinforcement learning approach for microgrid resources planning. Appl. Energy 353, 122029. doi:10.1016/j.apenergy.2023.122029
Bai, L. Q., Li, F. X., Cui, H. T., Jiang, T., Sun, H. B., and Zhu, J. X. (2016). Interval optimization based operating strategy for gas-electricity integrated energy systems considering demand response and wind uncertainty. Appl. Energy 167, 270–279. doi:10.1016/j.apenergy.2015.10.119
Barker, P. P., and Mello, R. W. (2000). Determining the impact of distributed generation on power systems. I. Radial distribution systems. 2000 Power Eng. Soc. Summer Meet., 1645–1656.
Cao, D., Hu, W. H., Zhao, J. B., Huang, Q., Chen, Z., and Blaabjerg, F. (2020a). A multi-agent deep reinforcement learning based voltage regulation using coordinated PV inverters. IEEE Trans. Power Syst. 35, 4120–4123. doi:10.1109/tpwrs.2020.3000652
Cao, D., Hu, W. H., Zhao, J. B., Zhang, G. Z., Zhang, B., Liu, Z., et al. (2020b). Reinforcement learning and its applications in modern power and energy systems: a review. J. Mod. power Syst. clean energy 8 (6), 1029–1042. doi:10.35833/mpce.2020.000552
Cao, D., Zhao, J. B., Hu, J. X., Pei, Y. S., Huang, Q., Chen, Z., et al. (2023). Physics-informed graphical representation-enabled deep reinforcement learning for robust distribution system voltage control. IEEE Trans. Smart Grid 15 (1), 233–246. doi:10.1109/tsg.2023.3267069
Cao, D., Zhao, J. B., Hu, W. H., Huang, Q., Chen, Z., Blaabjerg, F., et al. (2021). Data-driven multi-agent deep reinforcement learning for distribution system decentralized voltage control with high penetration of PVs. IEEE Trans. Smart Grid 12, 4137–4150. doi:10.1109/tsg.2021.3072251
Clegg, S., and Mancarella, P. (2015). Integrated modeling and assessment of the operational impact of Power-to-Gas (P2G) on electrical and gas transmission networks. IEEE Trans. Sustain. Energy 6, 1234–1244. doi:10.1109/tste.2015.2424885
Dai, W., Yu, j., Yang, Z. F., Huang, H. Y., Lin, W., and Li, W. Y. (2020). A static equivalent model of natural gas network for electricity–gas co-optimization. IEEE Trans. Sustain. Energy 11, 1473–1482. doi:10.1109/tste.2019.2927837
Ding, L. F., Cui, Y. K., Yan, G. F., Huang, Y. J., and Fan, Z. (2024). Distributed energy management of multi-area integrated energy system based on multi-agent deep reinforcement learning. Int. J. Electr. Power and Energy Syst. 157, 109867. doi:10.1016/j.ijepes.2024.109867
Du, W. Y., Ma, J., and Yin, W. J. (2023). Orderly charging strategy of electric vehicle based on improved PSO algorithm. Energy 271, 127088. doi:10.1016/j.energy.2023.127088
Dulăua, L., Abrudeanb, M., and Bicăc, D. (2013). Effects of distributed generation on electric power systems. 7th Int. Conf. Interdiscip. Eng., 1–5.
Elsayed, A. A. H., Nashwan, M. S., Eltahan, A. M. H., and Shahid, S. (2024). Millions more Egyptians will be exposed to drought by 2100 under the goals of the Paris climate agreement. Int. J. Disaster Risk Reduct. 101, 104257. doi:10.1016/j.ijdrr.2024.104257
Gallo, C., Faccilongo, N., and Sala, P. L. (2018). Clustering analysis of environmental emissions: a study on Kyoto Protocol's impact on member countries. J. Clean. Prod. 172, 3685–3703. doi:10.1016/j.jclepro.2017.07.194
Gao, X., and Zhang, X. (2024). Robust collaborative scheduling strategy for multi-microgrids of renewable energy based on a non-cooperative game and profit allocation mechanism. Energies 17, 519. doi:10.3390/en17020519
Gu, W., Wang, J., Lu, S., Luo, Z., and Wu, C. Y. (2017). Optimal operation for integrated energy system considering thermal inertia of district heating network and buildings. Appl. Energy 199, 234–246. doi:10.1016/j.apenergy.2017.05.004
He, J. M., Wu, Y. N., Yong, X. K., Tan, Q. L., and Liu, F. T. (2022). Bi-level optimization of a near-zero-emission integrated energy system considering electricity-hydrogen-gas nexus: a two-stage framework aiming at economic and environmental benefits. Energy Convers. Manag. 274, 116434. doi:10.1016/j.enconman.2022.116434
Hu, D. E., Li, Z. C., Ye, Z. H., Peng, Y. G., Xi, W., and Cai, T. T. (2024). Multi-agent graph reinforcement learning for decentralized Volt-VAR control in power distribution systems. Int. J. Electr. Power and Energy Syst. 155, 109531. doi:10.1016/j.ijepes.2023.109531
Ji, Z., Kang, C. Q., Chen, Q. X., Xia, Q., Jiang, C. M., Chen, Z. X., et al. (2013). Low-carbon power system dispatch incorporating carbon capture power plants. IEEE Trans. Power Syst. 28, 4615–4623. doi:10.1109/tpwrs.2013.2274176
Li, G. Q., Zhang, R. F., Jiang, T., Chen, H. H., Bai, L. Q., Cui, H. T., et al. (2017). Optimal dispatch strategy for integrated energy systems with CCHP and wind power. Appl. Energy 192, 408–419. doi:10.1016/j.apenergy.2016.08.139
Li, S. C., Hu, W. H., Cao, D., Chen, Z., Huang, Q., Blaabjerg, F., et al. (2023). Physics-model-free heat-electricity energy management of multiple microgrids based on surrogate model-enabled multi-agent deep reinforcement learning. Appl. Energy 346, 121359. doi:10.1016/j.apenergy.2023.121359
Li, S. C., Hu, W. H., Cao, D., Dragičević, T., Huang, Q., Chen, Z., et al. (2024c). Electric vehicle charging management based on deep reinforcement learning. J. Mod. Power Syst. Clean Energy 10 (2), 719–730. doi:10.35833/mpce.2020.000460
Li, S. C., Hu, W. H., Cao, D., Hu, J. X., Huang, Q., Chen, Z., et al. (2024a). A novel MADRL with spatial-temporal pattern capturing ability for robust decentralized control of multiple microgrids under anomalous measurements. IEEE Trans. Sustain. Energy, 1–12. doi:10.1109/tste.2024.3386180
Li, T., Eremia, M., and Shahidehpour, M. (2008). Interdependency of natural gas network and power system security. IEEE Trans. Power Syst. 23 (4), 1817–1824. doi:10.1109/tpwrs.2008.2004739
Li, X. Y., Luo, F. G., and Li, C. J. (2024b). Multi-agent deep reinforcement learning-based autonomous decision-making framework for community virtual power plants. Appl. Energy 360, 122813. doi:10.1016/j.apenergy.2024.122813
Li, Z. M., Liu, J. Y., Xiang, Y., Zhang, X., and Chai, Y. X. (2019). Agricultural load modeling based on crop evapotranspiration and light integration for economic operation of greenhouse power systems. CSEE J. Power Energy Syst. 7 (5), 1113–1121.
Liu, J. B., Su, Y. C., Xiang, Y., Liu, J. Y., Wang, L. F., and Xu, W. T. (2018). Operational reliability assessment for gas-electric integrated distribution feeders. IEEE Trans. Smart Grid 10 (1), 1091–1100. doi:10.1109/tsg.2018.2844309
Liu, T. H., Tian, J., Zhu, H. Y., Goh, H. H., Liu, H., Wu, T., et al. (2023). Key technologies and developments of multi-energy system: three-layer framework, modelling and optimisation. Energy 277, 127697. doi:10.1016/j.energy.2023.127697
Liu, W. J., Chi, W. Y., and Hua, W. Q. (2024). Blockchain-enabled renewable energy certificate trading: a secure and privacy-preserving approach. Energy 290, 130110. doi:10.1016/j.energy.2023.130110
Ma, Z., Jørgensen, B. N., and Ma, Z. (2024). A scoping review of energy-efficient driving behaviors and applied state-of-the-art AI methods. Energies 17, 500. doi:10.3390/en17020500
Monfaredi, F., Shayeghi, H., and Siano, P. (2023). Multi-agent deep reinforcement learning-based optimal energy management for grid-connected multiple energy carrier microgrids. Int. J. Electr. Power and Energy Syst. 153, 109292. doi:10.1016/j.ijepes.2023.109292
Okedu, K. E., Oyinna, B., Colak, I., and Kalam, A. (2024). Geographical information system based assessment of various renewable energy potentials in Nigeria. Energy Rep. 11, 1147–1160. doi:10.1016/j.egyr.2023.12.065
Tabebordbar, A., Rastegar, M., and Ebrahimi, M. (2023). Reliability-oriented optimal sizing of power-to-gas and combined heat and power technologies in integrated electricity and natural gas transmission systems. Sustain. Cities Soc. 95, 104593. doi:10.1016/j.scs.2023.104593
Wang, X., Wang, S. X., Zhao, Q. Y., and Lin, Z. R. (2023a). Low-carbon coordinated operation of electric-heat-gas-hydrogen interconnected system and benchmark design considering multi-energy spatial and dynamic coupling. Energy 279, 128042. doi:10.1016/j.energy.2023.128042
Wang, X., Zhou, J. S., Qin, B., and Guo, L. Z. (2023b). Coordinated control of wind turbine and hybrid energy storage system based on multi-agent deep reinforcement learning for wind power smoothing. J. Energy Storage 57, 106297. doi:10.1016/j.est.2022.106297
Wang, Z. X., Xiao, F., Ran, Y., and Xu, Y. (2024). Scalable energy management approach of residential hybrid energy system using multi-agent deep reinforcement learning. Appl. Energy 367, 123414. doi:10.1016/j.apenergy.2024.123414
Werksman, J. (1994). The United Nations framework convention on climate change: the first conference of the parties opening in Berlin. Glob. Environ. Change 4 (4), 339–340. doi:10.1016/0959-3780(94)90034-5
Wojtaszek, H., Miciuła, I., Modrzejewska, D., Stecyk, A., Sikora, M., Wójcik-Czerniawska, A., et al. (2024). Energy policy until 2050—comparative analysis between Poland and Germany. Energies 17, 421. doi:10.3390/en17020421
Yang, J. W., Zhang, N., Cheng, Y. H., Kang, C. Q., and Xia, Q. (2019). Modeling the operation mechanism of combined P2G and gas-fired plant with CO2 recycling. IEEE Trans. Smart Grid 10, 1111–1121. doi:10.1109/tsg.2018.2849619
Zhang, B., Hu, W. H., Ghias, A. M. Y. M., Xu, X., and Chen, Z. (2023b). Two-timescale autonomous energy management strategy based on multi-agent deep reinforcement learning approach for residential multicarrier energy system. Appl. Energy 351, 121777. doi:10.1016/j.apenergy.2023.121777
Zhang, B., Hu, W. H., Xu, X., Zhang, Z. Y., and Chen, Z. (2023a). Hybrid data-driven method for low-carbon economic energy management strategy in electricity-gas coupled energy systems based on transformer network and deep reinforcement learning. Energy 273, 127183. doi:10.1016/j.energy.2023.127183
Zhang, B., Xu, N., Zhang, H. R., Qiu, R., Wei, X. M., Wang, Z., et al. (2024a). Influence of hydrogen blending on the operation of natural gas pipeline network considering the compressor power optimization. Appl. Energy 358, 122594. doi:10.1016/j.apenergy.2023.122594
Zhang, W. W., Chen, X. M., and Tian, J. (2024b). The evolutionary analysis of investment in CCS-EOR under dual carbon target—from the perspective of multi-agent involvement. Int. J. Greenh. Gas Control 135, 104107. doi:10.1016/j.ijggc.2024.104107
Zhang, Y. C., Zheng, F., Shu, S. W., Le, J., and Zhu, S. (2020). Distributionally robust optimization scheduling of electricity and natural gas integrated energy system considering confidence bands for probability density functions. Int. J. Electr. Power and Energy Syst. 123, 106321. doi:10.1016/j.ijepes.2020.106321
Keywords: low-carbon, integrated electrical and gas system, carbon emission, GCCP, multi-agent deep reinforcement learning algorithm
Citation: Feng W, Deng B, Zhang Z, Jiang H, Zheng Y, Peng X, Zhang L and Jing Z (2024) Low-carbon economic dispatch strategy for integrated electrical and gas system with GCCP based on multi-agent deep reinforcement learning. Front. Energy Res. 12:1428624. doi: 10.3389/fenrg.2024.1428624
Received: 06 May 2024; Accepted: 11 June 2024;
Published: 19 July 2024.
Edited by:
Yue Xiang, Sichuan University, ChinaReviewed by:
Ke Qing, Sichuan Normal University, ChinaCopyright © 2024 Feng, Deng, Zhang, Jiang, Zheng, Peng, Zhang and Jing. This is an open-access article distributed under the terms of the Creative Commons Attribution License (CC BY). The use, distribution or reproduction in other forums is permitted, provided the original author(s) and the copyright owner(s) are credited and that the original publication in this journal is cited, in accordance with accepted academic practice. No use, distribution or reproduction is permitted which does not comply with these terms.
*Correspondence: Wentao Feng, MTE3OTYyMzk5MUBxcS5jb20=
Disclaimer: All claims expressed in this article are solely those of the authors and do not necessarily represent those of their affiliated organizations, or those of the publisher, the editors and the reviewers. Any product that may be evaluated in this article or claim that may be made by its manufacturer is not guaranteed or endorsed by the publisher.
Research integrity at Frontiers
Learn more about the work of our research integrity team to safeguard the quality of each article we publish.