 Subhojit Dawn1*
 Shreya Shree Das2
 M. Ramesh3G. Seshadri4Sai Ram Inkollu5Thandava Krishna Sai Pandraju6
 Umit Cali7,8*
 Taha Selim Ustun9*
- 1Velagapudi Ramakrishna Siddhartha Engineering College, Vijayawada, India
- 2VIT-AP University, Amaravati, Andhra Pradesh, India
- 3Sphoorthy Engineering College, Hyderabad, India
- 4Institute of Aeronautical Engineering, Hyderabad, India
- 5R.K. College of Engineering, Kethanakonda, India
- 6Dhanekula Institute of Engineering and Technology, Vijayawada, India
- 7Norwegian University of Science and Technology, Department of Electric Energy, Trondheim, Norway
- 8University of York, School of Physics, Engineering an Technology, York, United Kingdom
- 9Fukushima Renewable Energy Institute (FREA), National Institute of Advanced Industrial Science and Technology (AIST), Koriyama, Japan
The depletion of conventional energy sources has led to an increase in interest in renewable energy across the globe. The usage of renewable energy has lowered economic risk in the electricity markets. This study presents an approach to utilize solar photovoltaic as a renewable energy source, fuel cells as the energy storage system, and Flexible AC Transmission networks (FACTS) to reduce system risk in deregulated networks. The difference between real and expected renewable energy data is the primary cause of disequilibrium pricing (DP) in the renewable energy-integrated system. Integration of the FCs with a Unified Power Flow Controller (UPFC) can play an important role in coping with the disequilibrium pricing, emphasizing optimizing profitability and societal welfare in a deregulated environment. The paper also evaluates the system voltage outline and LBMP (location-based marginal pricing) scenarios, both with and without the integration of solar power. Two distinct factors, i.e., Bus Sensitivity Index (BSI) and Line Congestion Factor (LCF), have been proposed to identify the key buses and lines for solar power and Unified Power Flow Controller installation in the system. The study also employs conditional-value-at-risk (CVaR) and value-at-risk (VaR) to assess the system’s risk. Using a real-time IEEE 39-bus New England system, multiple optimization algorithms including Sequential Quadratic Programming and the Slime Mould Algorithm (SMA) are employed to estimate the financial risk of the considered system. This analysis demonstrates that the risk coefficient values improve with the placement of UPFC and fuel cells in the renewable incorporated system.
1 Introduction
The improvements in the electrical industry have a considerable impact on the economy of a country. The power industry includes power generation, transmission, and distribution. These responsibilities were often managed by a single corporation, which was frequently subject to government oversight. Critics argue that this monopolistic structure restricts competition, service quality, and pricing. Customers have little options due to monopolies, necessitating government control. Regulations seek to encourage competition, maintain standards, and include stakeholders. Deregulation eliminates government control of the power sector, intending to lower prices and increase competition. Governments utilize deregulation to encourage investment and competitiveness. The success of deregulation is determined by elements like as rules, market structure, and competition levels. Nowadays, the majority of electricity is generated by thermal power plants. Due to the paucity of non-renewable sources, there is a shift toward renewable throughout the globe. Solar electricity is trendy but difficult to implement. Increasing the use of renewables reduces the requirement for thermal systems. The storage system stores the excess energy for use during peak demand periods. Including renewables increases economic profit. Furthermore, the introduction of a deregulated system in the renewable-associated electricity industry has resulted in increased competition among market stakeholders, which increases system revenues.
In recent years, there have been many studies carried out on renewable sources, and energy storage systems in deregulated environments. Saranyaa et al. (Shri Saranyaa and Peer Fathima, 2023) have conducted a comprehensive study that explores the latest drifts and approaches in estimating the levelised cost and balancing the supply-demand ratio in renewable energy sources. The paper (Huang et al., 2018) explores different uses of energy storage systems, including lowering the total expenses of power making from sporadic renewable resources, managing the deployment of numerous batteries in electrical networks, and optimizing earnings through capitalizing on temporal price variations. The innovative collaborative planning framework outlined in (Tian et al., 2020) aims to coordinate the mixing of renewable sources and ESS (energy storage systems) in the energy industries. Paper (Shree Das et al., 2023) provides an extensive examination of various components within renewable combined deregulated systems. The research (Tian et al., 2022) utilizes the Stackelberg game model to propose an integrated investment strategy for renewable energy, transmission networks, and energy storage within deregulated electricity markets. To maximize results, Shreya et al. (Shree Das and Kumar, 2024) provide a professional analysis of an effective bidding strategy for power networks that incorporate wind farms and maximize social welfare (SW) by using the Monte Carlo simulation algorithm. A new method “nested sampling with exploration chains” for Bayesian model evaluation has been depicted in (Kumar et al., 2023).
Paper (Kumar et al., 2016) focuses on solving the unit commitment (UC) problem with ramp rate and prohibited zone constraints using ‘Gaussian Harmony Search’ (GHS) and ‘Jumping Gene Transposition’ (JGT) algorithm (GHS-JGT). Huang et al. (Huang et al., 2019) present a concise summary of the variables and coefficients employed in the optimization problem concerning the economic dispatch of power systems incorporating battery storage. The study outlined in reference (Wang et al., 2023) introduces a framework proposing a strategy for stakeholders to apportion BESSs (battery energy storage systems) in deregulated distribution networks. A new and innovative approach has been developed in (Huang et al., 2020) for expansion planning problem that focuses on coordination and robustness. The main objective is to enhance both systematic flexibility and market efficiency. Kaneko (Kaneko et al., 2020) introduces a method to determine the prime radial-loop arrangement for a delivery grid incorporating solar photovoltaic (PV), to diminish power losses. The study (Huang et al., 2021) outlines a control approach for energy storage systems employing Deep Reinforcement Learning (DRL) to mitigate the growing unpredictability stemming from renewable sources.
Zhaoyuan (Wu et al., 2020) presents an effective approach for combining wind power and CSP (Concentrated Solar Power) in a two-price balancing market. A single-phase single-stage topology for grid-connected solar photovoltaic (PV) systems is emphasized in (Kumar et al., 2020). The most effective economic dispatch is investigated using dynamic programming theory in (Liu et al., 2021), taking into account the physical properties of storage systems as well as the impact of the market. To maximize system economics, a technique for estimating the appropriate size of an ESS for wind turbine (WT) and PV generators in South Korea is proposed in (Kong et al., 2019). The study (Kun Ren et al., 2023) presents a new method for determining the amount of energy storage required in microgrid systems. To maximize storage use, the storage is sized according to the highest cumulative charge or discharge in the stored energy’s temporal profile. Biggins et al. (Biggins et al., 2023) look into the financial implications of putting a solar facility with ESS in various parts of the United Kingdom. The study (Jabbari Ghadi et al., 2020) looks at the usage of CAES (compressed air energy storage) in advanced distribution systems (ADSs) and how it helps the grid.
The use of optimization-based approaches in power market bidding is investigated in the research (Li et al., 2023) to synchronize wind energy with battery energy storage devices. A reconfigurable wireless power transfer system with constant current for charging multiple batteries is discussed by (Liang et al., 2024), but it does not extensively elaborate on the scalability of the system for larger numbers of batteries. The study in (Dawn et al., 2019) offers a risk assessment technique for evaluating the financial stability of power systems in the face of erratic wind power. A coordinated bidding approach in power markets and reserve capacity and frequency control bidding in ancillary service markets is proposed in Paper (Aldaadi et al., 2021) for a combined wind farm (WF) and CAES system. To lower system risks in a power network, Das et al. (Das Arup et al., 2022) recommend combining renewable energy sources with FACTS devices. The impact of WF and FACTS devices on system economics and risk is investigated using different optimization techniques. To optimize system profit and minimize system risk, the study (Bhusan Basu et al., 2023) examines the challenges associated with integrating wind energy into current electrical systems and offers the best operating strategy for an FC and TCSC (thyristor-controlled series compensator) in a wind-associated system. In (Ranganathan and Rajkumar, 2021), a self-adaptive firefly algorithm-based method for determining the ideal locations and configurations for UPFC placement in transmission networks has been presented. A technological and financial strategy for the best location of FACTS devices in transmission networks is suggested in Ref (Zadehbagheri et al., 2023). to lower power losses and increase network load capacity. A new active-disturbance-rejection-controller optimized using magnetotactic bacteria optimization and further improved with artificial neural networks is used for power quality improvement in (Safiullah et al., 2022). Electric vehicles (EVs) require recharging, which can be challenging in remote areas, therefore solar panels are being considered for EV charging in emergencies (Hussain et al., 2020). The paper (Xiang et al., 2018) gives a thorough review of techniques utilized to stabilized hybrid AC DC distributed renewable energy systems. Different control strategies utilized to stabilize isolated and interconnected multi-area hybrid power systems are presented in detail in (Ranjan et al., 2021).
Following a thorough review of the literature, it was discovered that there are several research gaps that are being addressed in the current study. The research gaps identified in the literature are as follows.
• Saranyaa et al. (Shri Saranyaa and Peer Fathima, 2023) and Shreya et al. (Shree Das and Kumar, 2024) highlight cost estimation and bidding strategies, primarily from the perspective of individual components or market participants but there is a need for complete models that integrate various system components and market participants to maximize overall system profit while considering interactions and dependencies.
• The existing research, such as the collaborative planning framework in (Tian et al., 2020) and the Stackelberg game model in (Tian et al., 2022) assumes static market conditions but more studies are required to develop adaptive models that can dynamically respond to market changes and technological advancements, ensuring sustained economic profitability.
• While papers (Dawn et al., 2019) and (Das Arup et al., 2022) discuss risk assessment and mitigation for specific elements like wind power and FACTS devices, but comprehensive system-wide risk mitigation strategies are limited.
• Studies such as (Kumar et al., 2016), (Liu et al., 2021), and (Ranganathan and Rajkumar, 2021) utilize various optimization techniques to address specific issues like unit commitment and FACTS device placement but there is room for further exploration of advanced optimization algorithms that can simultaneously address multiple objectives in a deregulated environment with high renewable energy penetration.
• Research (Huang et al., 2018), (Shree Das et al., 2023), and (Wang et al., 2023) explores different uses and impacts of energy storage and renewable energy but often within a specific regulatory framework. More studies are needed to understand how different regulatory policies affect economic outcomes and risk profiles, and how market participants can optimize their strategies in varying regulatory environments.
By addressing these gaps, future research can provide more robust, adaptable, and comprehensive solutions for economic profit maximization and system risk mitigation in deregulated power systems which has been performed in the present work. The chief objective of this work is to minimize the adverse effect of disequilibrium pricing while optimizing the social welfare of a solar-associated deregulated electrical network. A hybrid scheduling method has been proposed in this work to maximize the cost-effective functioning of FACTS devices in conjunction with solar PV and energy storage systems to accomplish this goal.
• In a deregulated solar energy system, GENCOs and DISCOs (Generation and distribution companies) establish power supply agreements before power scheduling operation day, depending on irradiance and temperature of solar PV. If real solar radiation and temperature differ from predicted, GENCOs may face price imbalances. The Independent System Operator (ISO) has the authority to either penalize or reward GENCOs based on these discrepancies.
• GENCOs are using energy storage devices to manage this power shortage issue and minimize the difference between actual and forecast solar power output. Using storage devices can reduce power fluctuations, reduce stress on thermal plants, and increase economic benefits. A thermal-solar-fuel cell hybrid system has been implemented in this work to reduce cost imbalances and provide additional electricity to the grid.
• This study also looks into how combining a UPFC and FC might assist minimize the effects of price imbalances. The study examines the impact of solar power integration on system voltage profiles and Locational Based Marginal Prices (LBMP) in a deregulated context.
• The system risks were evaluated using VaR and CVaR, with the addition of FC and UPFC leading to risk reduction. Economic risks were assessed using SQP and SMA optimization techniques. The study stresses the relationship between VaR, CVaR, social welfare, and generation costs.
• SQP is based on linear programming, while SMA is a meta-heuristic optimization method. To confirm and demonstrate the universal applicability of the proposed technique, both linear and meta-heuristic optimization approaches were investigated. Instead of SMA, different optimization approaches can be utilized, but the proposed strategy will still provide the same moderated output pattern.
• The work was completed using the IEEE 39-Bus New England system, however, other big and small systems will produce the same output situations, demonstrating the usefulness of the proposed work.
This work incorporates the FC and UPFC, as well as solar electricity, to increase societal welfare while minimizing system risk. The fundamental novelty of this study is the introduction of SMA optimization techniques to tackle the considered problem. The structure of the paper is as follows:
Section 1: The key target of this section is to explore the difficulties of the background investigation, as well as the key components that underpin this work.
Section 2: Within this portion of the paper, the mathematical strategy that has been employed to authenticate the work being presented is comprehensively expounded.
Section 3: This section aims to offer a comprehensive summary of the objective functions and the associated constraints that exist within the power systems.
Section 4: This section provides a detailed explanation of the recommended approach for evaluating the socio-economic impact of the deregulated electricity system.
Segment V: In this concluding section, a comprehensive demonstration is provided for the outcomes of the previously mentioned segments, which encompass the integration of solar PV, UPFC, and FCs.
2 System modeling
This section introduced the components of the study systems. Here, all the related mathematical models that are essential to organize the presented work are discussed with accompanying constraints. This part also includes a brief explanation of several optimization approaches.
2.1 Solar power
The following mathematical formula determines how much power (P) a solar photovoltaic (PV) array produces:
where V is the supply voltage and
The number of parallel and series-connected PV cells is represented by
2.2 Risk analysis tools
Risk assessment tools utilized in this study encompass VaR and CVaR. These assessment techniques are performed based on probabilistic lessons and assurance confidence stages (α). VaR quantifies the minimum loss at the (1-α) percentile, whereas CVaR illustrates the average loss mechanisms.
The expression f(X,Y) represents the loss components associated with the judgment vector X, drawn from a specific subset X of R, and the arbitrary vector Y in R. The probability p(Y) represents the likelihood of loss of components f(X,Y), which is constrained by a maximum threshold (ξ) (Biggins et al., 2023). Equations 6, 7 shows mathematical formulation of VaR and CVaR:
Figure 1 illustrates the visual representation of the risk assessment parameters. The highest level of risk within the system is indicated by the maximum negative VaR and CVaR values. To minimize both system loss and system risk, it is advisable to move towards the right side.
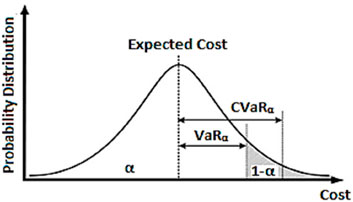
Figure 1. Graphical representation of VaR and CVaR.
2.3 LBMP
The LBMP is the price that benefits both product providers and purchasers. In other terms, the LBMP is the price at which the market becomes balanced. LBMP is often referred to as the MCP (market clearing price). In addition, the MCP is the price where the demand and supply curves connect, as shown in Figure 2.
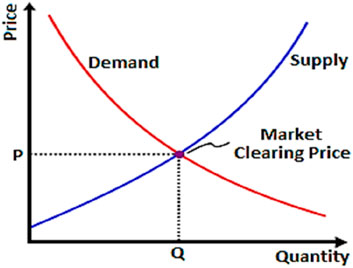
Figure 2. Graphical representation of MCP.
The demand curve defines the quantity of a product or item that buyers are willing to purchase, whereas the supply curve describes the quantity of a product or commodity that is made and provided to the market at various prices. The quantity of a product in the market decreases when its price is higher, while the quantity of that product grows when its price is lower. The relationship between the price and quantity of a product is inversely related to a demand curve, meaning that the demand curve slopes downward. On the supply curve, however, the quantity of a product gradually grows when its price is higher, and swiftly declines when its price is lower. The MCP is the point at which the demand and supply curves cross. There will be no surpluses or shortages in the market at the MCP point. As a result, the product’s price becomes equal to its quantity.
2.4 UPFC
The UPFC is a commonly used device for managing power and voltage flow in electrical transmission systems. It can adjust the series reactance of the transmission line and inject or extract shunt reactive power at the connected bus. It improves power system stability and reliability and promotes efficient energy use. The UPFC is crucial for power utilities and grid operators to connect and integrate different power systems and grids globally. The UPFC’s reactance value is determined by the transmission line’s reactance at its installation location as shown in Equations 8, 9.
The reactance of a transmission line (
2.5 FC modeling
The FC model has two parts: an electrolyzer and an FC. The electrolyzer turns water into hydrogen. The FC converts hydrogen into electricity. The chemical interaction between hydrogen and oxygen is important for the FC. It makes electricity, heat, and water. Hydrogen is stored in tanks for short and long-term use. Hydrogen storage is better than other storage options. The FC system works during low and high-demand periods (Bhusan Basu et al., 2022).
During low-demand phases, hydrogen is produced by the electrolyzer and stored for later use. The energy absorbed by the electrolyzer (
In this equation,
In Equation 11,
2.6 SMA
Shimin Li, in the year 2020, was the mastermind behind the groundbreaking development of the SMA (Das A. et al., 2022). This revolutionary strategy is based on a population-centric approach, harnessing the innate swinging motion of the Physarumpolycephalum, commonly known as the slime mould. The term “slime mould” itself is derived from the concept of fungus, and it is under this umbrella that some fundamental processes are executed to yield the most optimal results, just like other heuristic optimization methods. It is worth noting that slime moulds exhibit a fascinating behavior of selecting the food source with the highest concentration, taking into account factors such as weight, speed, and accuracy. Furthermore, these peculiar biological attributes of slime moulds enable them to simultaneously consume multiple sources of nourishment, truly showcasing their exceptional capabilities.
2.7 Parameter setting for SQP and SMA
Sequential Quadratic Programming (SQP) is an iterative method for nonlinear optimization. The key parameters to set include.
• Initial Guess: An initial feasible solution for the power flow problem.
• Tolerance Levels: Criteria for convergence, typically for objective function value change and constraint satisfaction.
• Maximum Iterations: The maximum number of iterations allowed.
• Line Search Parameters: Parameters for the line search algorithm used within SQP.
• Penalty Parameters: Penalty factors for handling constraints.
Slime Mould Algorithm (SMA) is a nature-inspired algorithm, and the key parameters include.
• Population Size: Number of candidate solutions (slime molds).
• Maximum Iterations: The total number of generations the algorithm will run.
• Weighting Coefficients: Parameters that control the influence of attraction, repulsion, and diffusion behaviors in SMA.
• Convergence Criteria: Threshold for stopping the algorithm based on changes in the best solution.
2.7.1 Sensitivity analysis
Performing a sensitivity analysis involves systematically varying these parameters to observe their impact on the performance of the algorithms. Here’s a step-by-step process.
• Identify Key Parameters: Select a few critical parameters from both SQP and SMA (e.g., population size, maximum iterations, tolerance levels).
• Vary One Parameter at a Time: Change one parameter while keeping others constant to isolate its effect.
• Measure Performance: Evaluate the performance using metrics such as convergence rate, solution quality (e.g., total generation cost), and computational time.
• Analyze Results: Plot the results to visualize how changes in each parameter affect the performance. Look for patterns or thresholds where performance significantly improves or degrades.
• Iterate: Based on the findings, refine the parameter settings and repeat the process if necessary to find the optimal combination.
3 Objectives
In a regulated power system, there is no clearness between the GENCOS and the consumers regarding the economic aspect. This scenario may be advantageous for the GENCOS but creates huge trouble for the consumers. To mitigate this issue the deregulated system is been introduced to boost the profit of the consumers by creating perfect rivalry among the market companies. Customers benefited from the deregulated market (i.e., received a social benefit) as a result of enhanced transparency and competitiveness. ISO (Independent System Operator) performs a significant function in this scenario by regulating the power market. The LBMP is fixed through the optimization technique after the ISO gathers the quotes from GENCOS and DISCOS. The competitive electricity market is considered to be a crucial part of the day-ahead market that supports society economically. In a renewable integrated system, ISO must receive information from GENCOS on upcoming power generation in the day-ahead market. If there is a mismatch between projected and actual solar power output, ISO may impose fines or incentives to the solar plant to make up the gap, which is known as the disequilibrium price.
3.1 Objective function 1
The purpose of this work is to maximize the profit of a solar-integrated deregulated electric system, despite the negative consequences of a price disequilibrium may reduce it. To mitigate the negative consequences of disequilibrium pricing, a solution for improving the performance of solar PV systems in combination with FCs and UPFC has been developed. The FC serves as an additional source of energy, reducing the strain caused by both predicted and actual solar energy. The FC strives to uphold the agreements reached between GENCOS and ISO by seeking to limit the amount of power difference generated by the solar plant. The recommended solution was implemented using SQP. A test system is taken into account using the NBUS number of buses, NPTL power transmission lines, NLD loads, and NG generators. To exploit social value and income while diminishing generation costs and system financial risk in the framework of disequilibrium pricing, the study attempts to successfully incorporate UPFC and FC across a renewable combined system. The operational research including a renewable integrated system must take the disequilibrium pricing into account. The system earns more benefit from a positive disequilibrium price than it does from a negative disequilibrium price. Such an outcome is seen as a result of the grid operators applying incentives and punishments to GENCOs at the same time. The goal of this research is to increase system profit while lowering the risk to the economy. Equation 12 shows the objective functions:
Here, the goal is to exploit overall system profit, represented by PMAX (x,t), at a time ‘t'. The earning profit belongs to the generating company. Therefore, these values will be maximized after the renewable integration. However, as the system transitions from regulated to deregulated, these values will fall. Three factors interact to determine the overall profit: total revenue (RT(x,t), disequilibrium pricing (DP(i,t), and total generation price (GCT(i,t), which includes both thermal and solar generation).
Equations 13, 14 demonstrate the total income and disequilibrium price computation, where PR signifies the real power provided by the solar power plant at the stated time ‘t' and PE represents the predicted power generated at the same time. SC represents the shortfall charge rate, whereas EC shows the excess charge rate. The disequilibrium price is calculated by adding the difference between the real and predicted power, as well as the product of the charge rates. In a solar-integrated system, the discrepancy between predicted and actual sun irradiation and temperature is used to calculate disequilibrium pricing. In a competitive power system, the disequilibrium price has a direct impact on the system’s economics.
Equation 15 calculates the system’s overall generation cost by combining the generating cost of conventional and solar power plants of a certain bus at a particular time and also the cost of UPFC employed in the system. Here, GCT(x,t) stands for the system’s overall generation cost at bus-n and time ‘t'. GCTher(x,t) represents the generation cost of conventional power sources like thermal energy. The cost of solar energy generation is denoted by GCsolar(x,t). ICUPFC represents the investment cost of the system’s UPFC.
The coefficients of the quadratic cost function for the nth generator are ax, bx, and cx, which are utilized in Equation 16 to express GC(x,t). The FC may be used to reduce power disparities and compensate for discrepancies between real solar power (RSP) and expected solar power (ESP).
Here ‘
The social benefit is inversely proportional to the power producers’ benefit. So, the social benefit will be more when the power generator’s profit is less and vice versa.
3.2 Objective function 2
Equations 20, 21 show the roles of VaR and cVaR, respectively. The system risk has an inverse connection with VaR and CVaR. This implies that the system risk level is determined by the lowest or highest negative VaR and CvaR values, respectively.
Therefore, risk can be decreased by shifting towards the right side from the left side tail of the system risk feature (illustrated in Figure 1), implying an upward trend in the values of VaR and CVaR. One of the primary aims of the present effort is to lower the generation cost. Social welfare is maximized when VaR and cVaR values lie on the rightmost tail of the curve, suggesting the generation cost is the lowest. Thus, there is an apparent connection between social wellbeing, VaR, and cVaR. The numerous limitations identified in the references allowed the optimal power flow (OPF) solution to be achieved.
3.2.1 Operating constraints of FC
An FC generates reliable and clean power. The electrolyzer uses excess electricity during the power demand period to produce energy that may be kept in a hydrogen reservoir. And the stored electricity may be used to meet the demand when the grid is running low on power. Equation 22 shows the lowest and highest limitations for the electrolyzer’s power usage:
The limitation of the electrolyzer’s hydrogen output is also given by Equation 23:
In addition, while the system is in FC mode, the stored hydrogen creates electricity to satisfy peak demand. As a result, the constraints are defined as in Equations 24, 25:
B. Optimal power flow constraints.
The real power balance equation is shown in Equation 26:
The power losses in the system are calculated using Equation 27. Here,
The active power flow from bus-i to all other buses in the system is computed using Equation 28 while reactive power is computed using Equation 29.
3.2.1.1 In-equality constraints
3.2.2 UPFC constraints
Equations 35, 36 relates to value constraints on a variable named
4 Flow chart of the proposed method
The flow charts for the proposed method are shown in this section.
The steps involved in the approach that is being provided are as follows.
• Scenario generation by considering different abnormal conditions in the power system.
• Measurement of VaR and CVaR for all scenarios.
• Choose the most risky scenarios based on the VaR and CVaR values.
• Optimal placement of solar plant based on BSI values and check the system economy and risk improvement.
• UPFC placement based on LCF values and check the system economy and risk improvement.
• Compare the LBMP and voltage profile with and without considering the solar plant.
• FC placement in the system and verify the profit improvement scenario.
The process for calculating the system profit and disequilibrium pricing is shown in Figure 3. UPFC is a device that modifies the impedance of the transmission line and injects or absorbs reactive power from the bus to regulate the flow of power in power systems. An ideal method for allocating UPFCs in a power system is shown in Figure 4. The procedure computes the objective for each case and inserts a UPFC into the system’s specified line. The goal of the optimization problem is expressed mathematically by the objective function. Lowering the cost of power generation in the power system is the goal function in this instance. Lastly, using the smallest goal function, the algorithm chooses the best UPFC configuration.
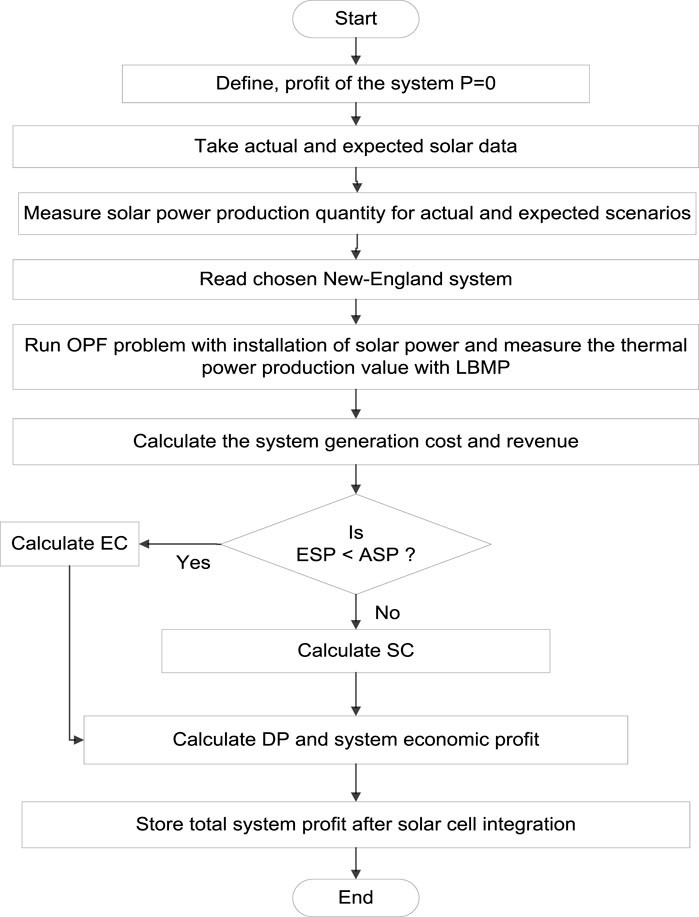
Figure 3. Flow-chart for DP calculation.
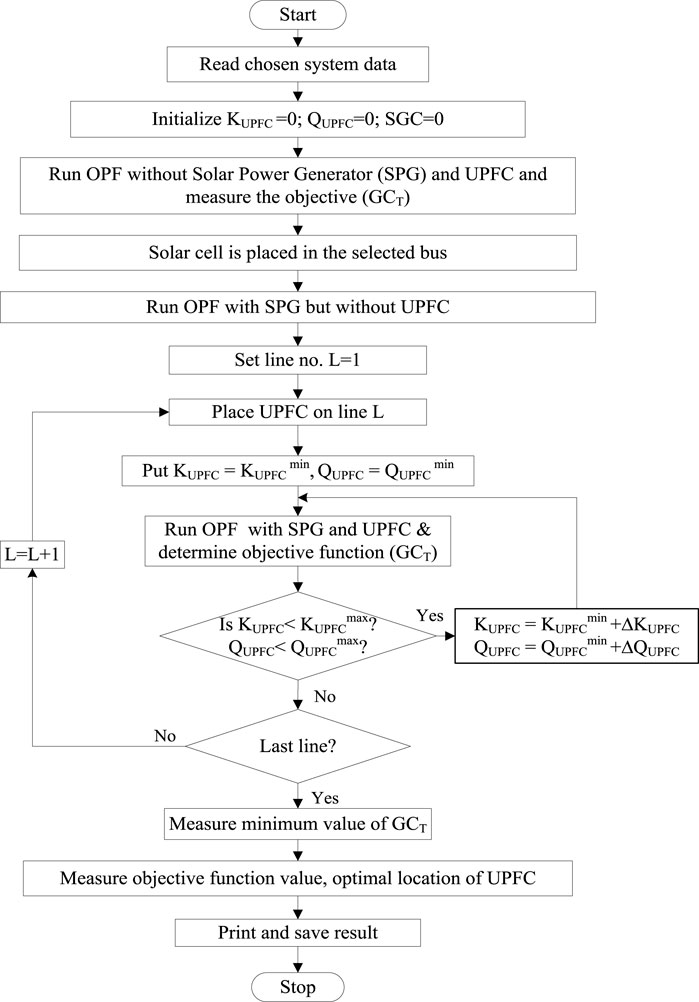
Figure 4. Flow-chart for placement of UPFC.
5 Results and discussions
The proposed technique is put to the test using the IEEE 39-bus New England practical system. The New England practical system, which consists of 39 buses, is a real-world power system used for study and analysis. It is made up of 39 buses, ten generators, and 25 loads (Biggins et al., 2023). Figure 5 displays the connection diagram of the considered system. The proposed technique is being evaluated for its efficacy in solving a specific problem or accomplishing a specific objective. The outcomes of these tests will assist in determining whether the proposed technique is a feasible solution to the problem at hand.
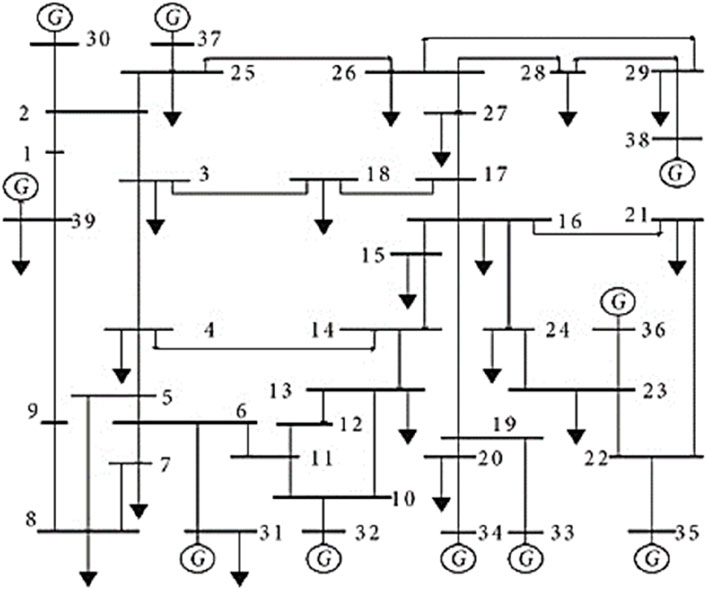
Figure 5. Single-line illustration of considered new england system (Biggins et al., 2023).
The complete implementation and validation of the suggested technique took five separate case studies on the system into account. The steps to accomplish the proposed work are outlined here.
Case 1. Create scenarios and investigate the connection between VaR and CVaR along with system objectives.
Case 2. Choosing the maximum critical circumstances and the utmost complex buses (for solar power installation).
Case 3. Identifying the system’s most congested line and placing the UPFC at that point.
Case 4. Investigate the influence of real and expected solar power on system economics and hazards.
Case 5. Place the FC in the examined system and calculate its profit.
Case 1: It involves generating several scenarios (120 in total) based on different factors such as generator outages, transmission line outages, and load increments. Out of these 120 possibilities, 40 are rated as having the highest risks. The degree of risk for these selected scenarios is calculated using VaR and CVaR. Table 1 displays the 40 scenarios studied, as well as the objective function value (i.e., system generation cost). The ‘Scenario (Line Outage)’ in Table 1 represents the chosen cases in which different line outages have been considered. The power system operation is very uncertain due to the chances of abnormalities in the system. Given this premise, many situations were chosen to test the effectiveness of the suggested technique. VaR is a statistical term that calculates the greatest possible loss that an investment or portfolio might incur over a certain period with a particular level of confidence. It is determined using the probabilistic distribution of the portfolio’s returns. CVaR, also known as Expected Shortfall, is a risk metric that calculates the expected loss above the VaR threshold. It gives a more thorough risk assessment than VaR alone. In this scenario, the VaR and CVaR values are calculated using the LBMP of each bus in the system. The application of VaR and CVaR in this situation aids in identifying the scenarios with the largest risks, which can then be further evaluated to find the ideal location of solar plants and FACTS devices to reduce risks and increase societal welfare.
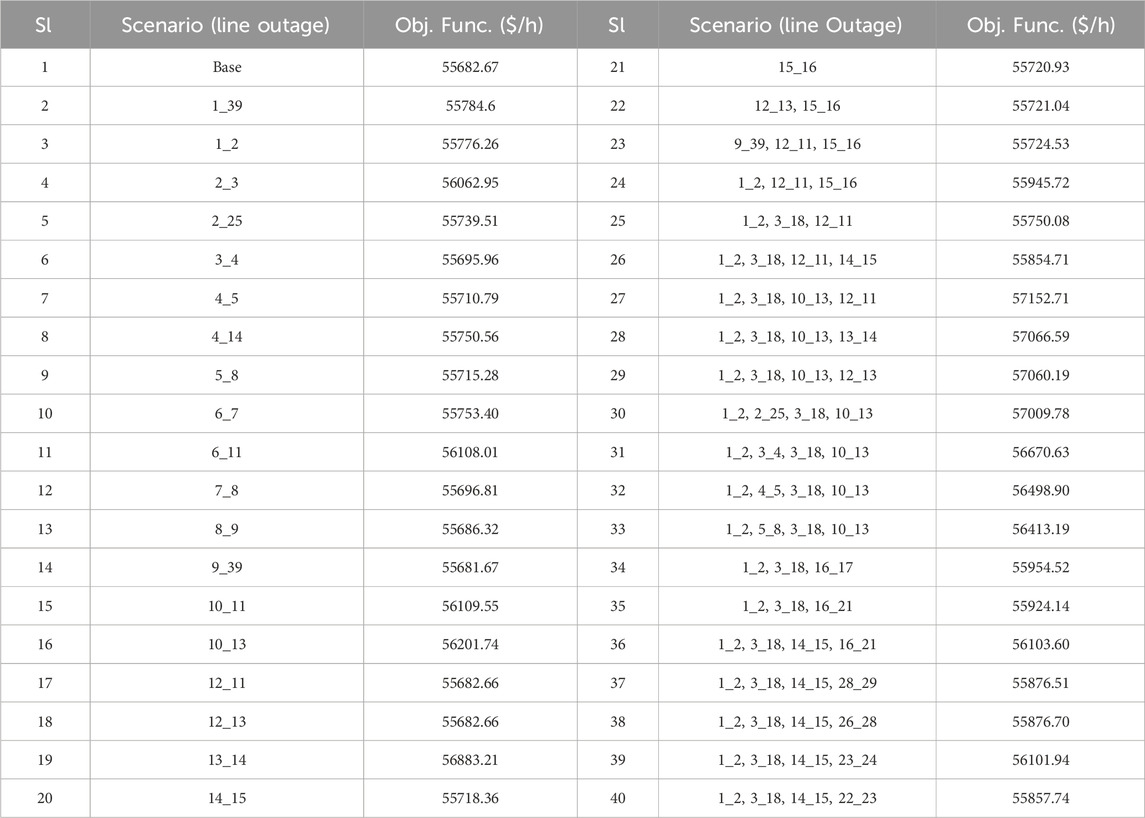
Table 1. Objective function value for considered scenarios.
To make the research more efficient and well-represented, the 40 scenarios selected were divided into two-halves, each including 20 scenarios. Figures 6, 7 illustrate the link between VaR, CVaR, SW, and the objective function. VaR and CVaR are risk value estimates that are inversely proportional to system risk. The objective function is a measure of multiple system costs, and its smallest value is desirable to reduce total system costs. Figures 6A, C demonstrate that the objective function is inversely related to VaR and CVaR. This indicates that the smallest value of the objective function corresponds to the greatest value of VaR and CVaR, and vice versa.
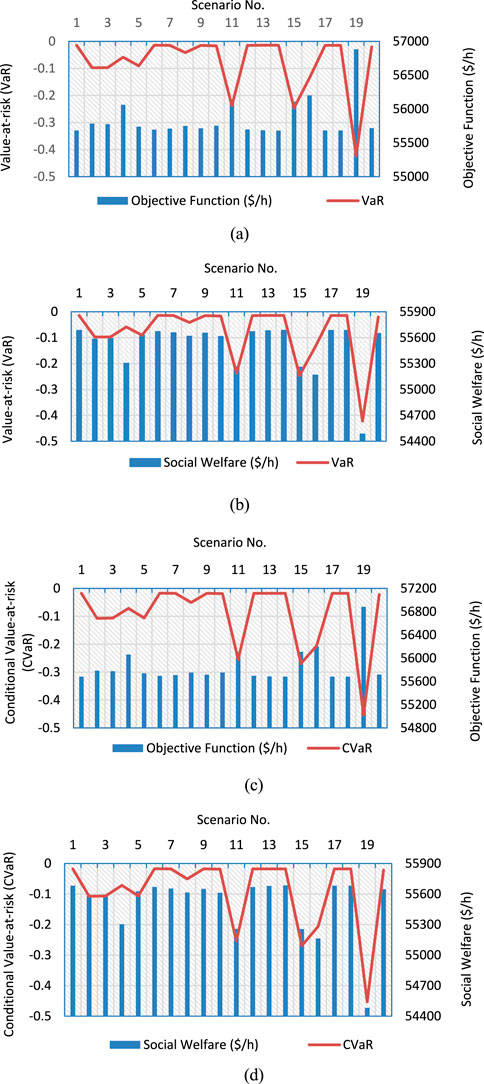
Figure 6. Relationship between VaR, CVaR, SW, and objective function (A–D) for scenarios 1–20.
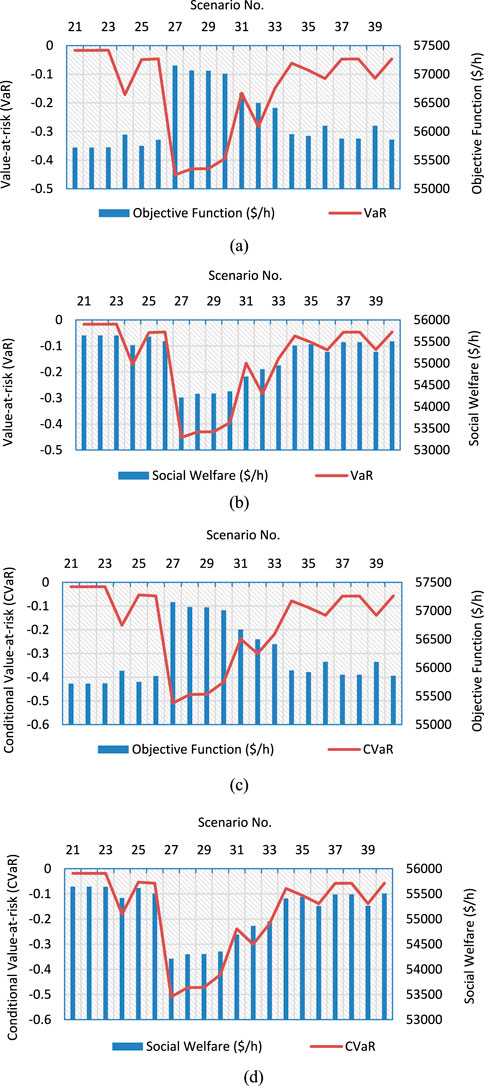
Figure 7. Relationship between VaR, CVaR, SW, and objective function (A–D) for scenarios 21–40.
Figures 6B, D show that social wellbeing has a direct relationship with VaR and CVaR. Because the considered objective function (F) reflects numerous system expenses, its smallest value is wanted to achieve the lowest total system cost. As a result, the risk is reduced to the minimum value of the goal function, which is also desirable.
Case 2: Because of the negative-maximum (or minimum) values of VaR and CVaR, scenario no. 27 is the most catastrophic situation (i.e., outage of transmission lines linked between buses 1–2, 3–18, 10–13, and 12–11) among all created scenarios in the system (shown in Figures 6, 7). The increased risks lead to lower social welfare and profit because increased system risk needs additional security measures for system stability, necessitating more economic consideration. To minimize the objective function, the values of VaR and CVaR must be maximized (or negative-minimized). Scenario 27 is chosen to maximize societal welfare while reducing system hazards through appropriate solar plant locations. Considering the variability in solar power generation due to the different environmental parameters, six different solar power capacities have been considered i.e. 1, 1.5, 2, 2.5, 3, and 5 MW. The objective is to determine the best location for these solar power sources in the system. Solar plants must be placed on the system’s most vulnerable buses. To appropriately situate the solar plant in the system, the Bus Sensitivity Index (BSI) was introduced in this work. This algorithm determines the most sensitive bus in the system and where solar plants should be located to enhance total value across the network. A priority list is created by grouping the BSI values in decreasing order (as seen in Table 2). The bus with the highest BSI rating is the most sensitive one in the system. BSI is mathematically defined as in Equation 37:
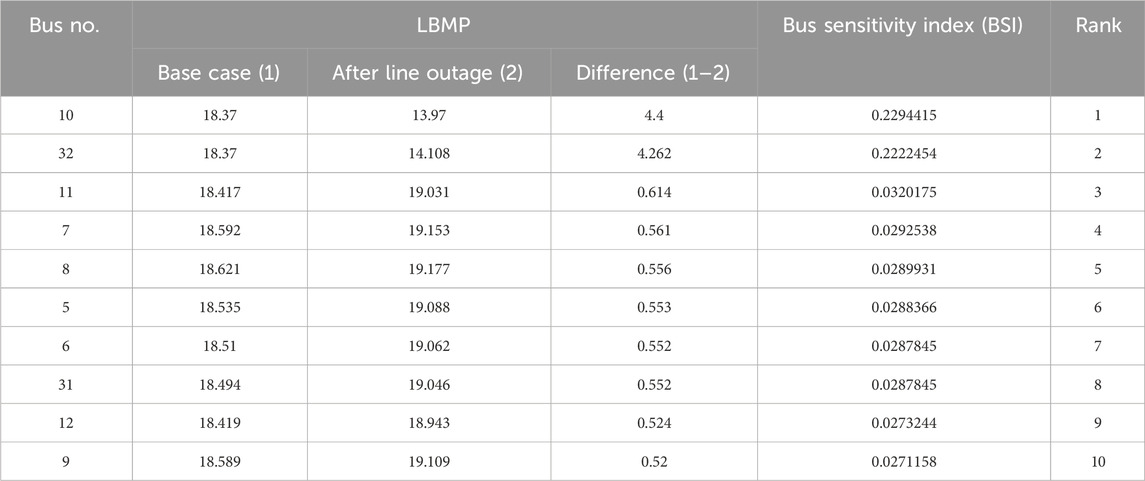
Table 2. Bus sensitivity Index (BSI) priority list.
Where,
The top six buses with the highest BSI values (excluding generator buses) are chosen for solar plant deployment. Bus number 32 is also among the top six buses in terms of BSI values, but it is omitted since it has a conventional generator. So, solar plants are placed on buses no. 5, 6, 7, 8, 10 and 11 respectively. All conceivable combinations of selected six values of solar power have been installed in the system and the values of VaR, CVaR, as well as the overall system generating price, have been measured.
Table 3 shows the top ten finest solar plant site alternatives in the system, along with their VaR, CVaR, and system generation price (including SGC). Scenario 9 has the lowest values for VaR, CVaR, and overall cost. When solar plants are added to the system, the lowest cost (55933.34 $/h) is achieved, as opposed to the base case cost (56109.55 $/h). Table 1, Table 3, Figure 6, and Figure 7 show that the establishment of a solar power plant in the analyzed system reduces system risk and generating costs. Figure 8 show a comparison of VaR, CvaR, and system total generating costs before and after solar installation. The comparison of the top 10 solar power location combinations (given in Table 3) is displayed in these graphs.
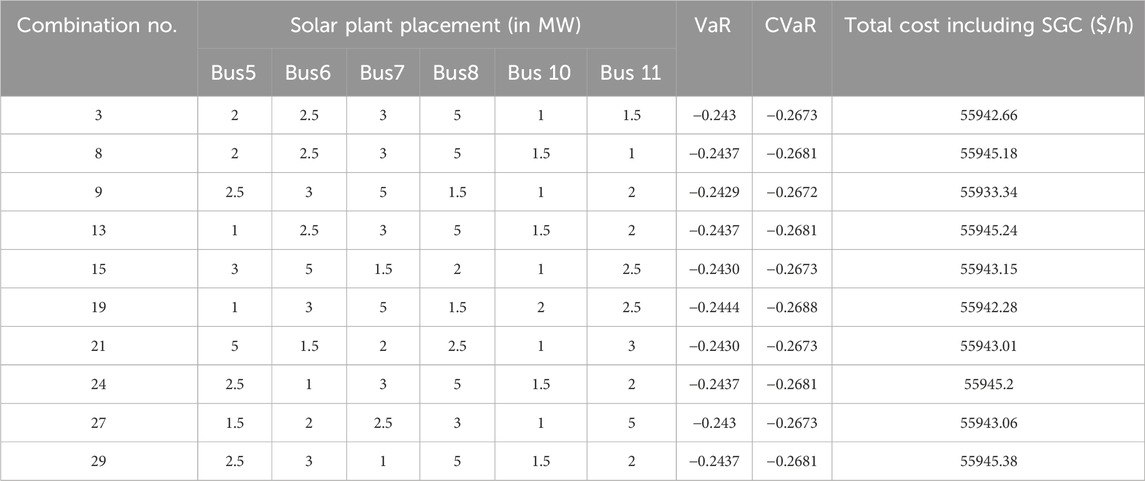
Table 3. Optimal placement of solar plant.
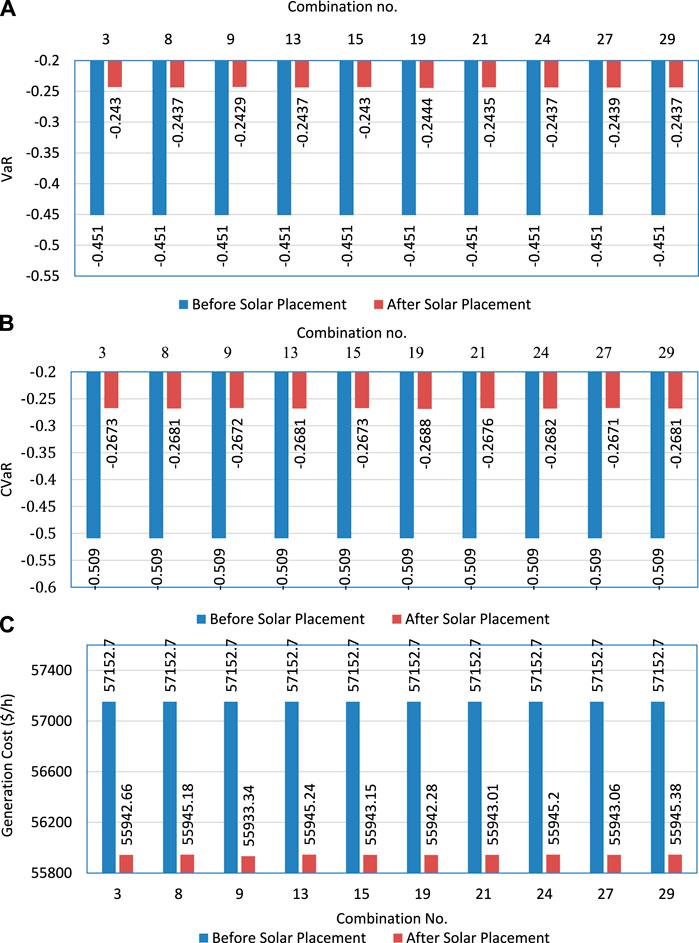
Figure 8. Comparison of value-at-risk (VaR), conditional value-at-risk (CVaR), and system total generating costs before and after solar placement.
In this instance, the worst conditions (i.e., combination no. 19) were chosen to test the efficiency of the provided strategy in the following phase (i.e., employing the optimal UPFC installation).
Case 3: This phase provided an approach for reducing a power system’s economic risk by optimizing the location of solar plants and FACTS devices. The previous stage in this work revealed that putting solar power plants in certain places can help to reduce economic risk by increasing the value of risk assessment criteria. The purpose of this scenario is to determine the optimal position for FACTS devices in the system. The optimal placement of FACTS devices can contribute to the power system’s stability and efficiency. In this study, a new factor, the Line Congestion Factor (LCF) shown in Table 4, was developed to identify the most crowded transmission line in the system and where FACTS devices should be placed to reduce the negative impact of system congestion on the customer.
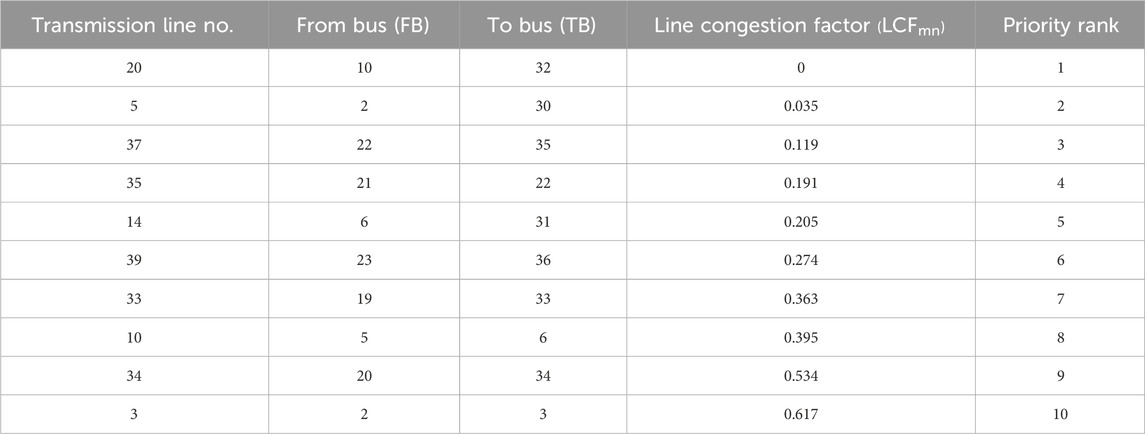
Table 4. Line congestion factor (LCF) priority list.
The mathematical formulation of LCF is shown in Equation 38:
Here,
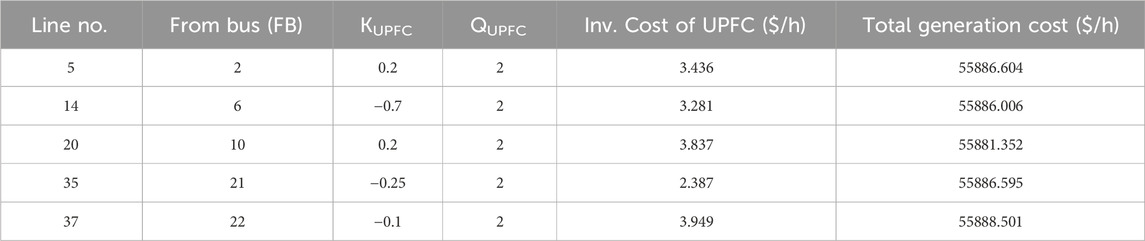
Table 5. Optimal UPFC placement.
In Table 5, QUPFC is the reactive power injected or withdrawn from the ‘to bus’ to which the UPFC is attached. KUPFC and QUPFC operating ranges have vacillated from −0.7 to 0.2 and −100 to 100, respectively. To determine the ideal UPFC range, the UPFC was put on a specific transmission line, and the values of KUPFC and QUPFC were changed concurrently within the given range while measuring the values of the objective function for all cases. Finally, the optimum range was calculated using the lower values of the target function (where the aim function is to reduce the cost of system generation).
The total generating cost for various UPFC deployments in the system is shown in Table 5. When UPFC is installed on line no. 20, the total generating cost is the lowest. After the deployment of UPFC at line no. 20, the total associated generating cost is 55881.352 $/h. This cost is less than the base scenario total generation cost of 56109.53 $/h. The use of UPFC in the system helps to reduce system risk, as seen in Figure 9. The system risk and generation cost are reduced at a higher rate with the installation of FACTS devices and a solar plant in the system.
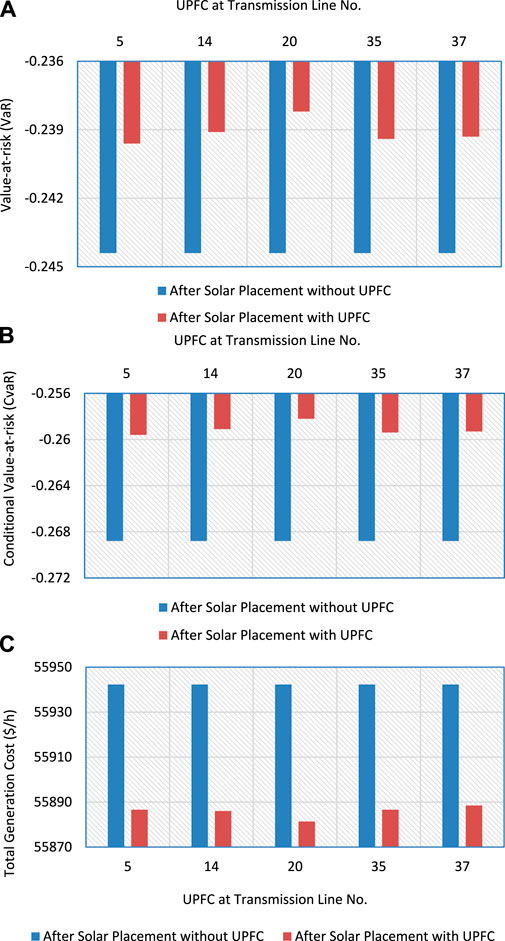
Figure 9. Comparison of VaR, CVaR and system generation cost before and after UPFC placement.
Case 4: Solar energy is a versatile energy source as it differs in intensity based on location and timing. A specific location in India, Vijayawada, was analyzed to address current issues. Data on solar irradiance and temperature was gathered for 24 h with a time difference of 3 h. The solar irradiance and temperature data of 5 time spans in a day (i.e. 7 a.m., 10 a.m., 1 p.m., 4 p.m., and 7 p.m.) have been considered. At night, solar irradiance is zero. So, that period was not considered for the study. By applying Equations 1–5, the amount of solar power generated per hour was calculated and presented in Table 6. Till date, only a small number of researchers have recognized the significance of the fluctuations in solar power generation when it comes to system economics. However, it is essential to acknowledge this factor when attempting to optimize the operation of the system within a deregulated system, as it cannot be disregarded. In deregulated systems, it is imperative to consider the concept of disequilibrium price, which arises from the disparity between the actual and expected solar power generation, to ensure the welfare of society. Solar plants are required to furnish the ISO with their estimated power generation scenario before the date of operation in a deregulated electricity system. The ISO oversees electricity generation from various stations based on this data. However, because of the unpredictability of solar irradiance and temperature, solar plants may fail to provide the anticipated energy, breaching market contracts and imposing an economic cost on generating enterprises, a situation known as disequilibrium pricing. The disequilibrium price, which measures the discrepancy between predicted and real solar data, takes into account all differences in expected and actual solar irradiance and temperature. When the difference between predicted and actual solar data is biggest, the disequilibrium price is highest. When the expected solar power exceeds the actual solar power, the shortfall charge rate is applied; when the real solar power surpasses the projected solar power, the excess charge rate is applied. If the projected and actual solar power are identical, the shortfall and excess charge rates are zero. Shortfall and excess charge rates can be used to compute the electrical system’s total disequilibrium price. The disequilibrium price is negative if the ISO penalizes the producing station for a lack of renewable energy supply, and positive if the ISO compensates the generating station for having an excess supply of renewable energy.
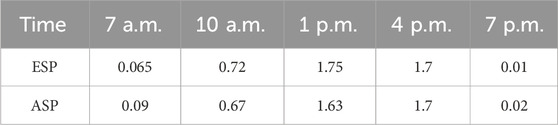
Table 6. Real-time expected (esp) and actual (asp)solar power data (In MW).
Table 6 compares the expected and actual levels of solar power for considered 5 situations. There are times when the predicted solar power surpasses the real, and vice versa. Furthermore, there are times when the predicted and actual numbers are the same. Because of these changes, the system may experience positive, negative, or zero disequilibrium pricing, which can affect the system’s total profit. Table 7 and Figure 10 show the profits earned by the deregulated system for all 5 scenarios along with the base case, taking into consideration the disequilibrium pricing at selected locations. The base case is considered when there is no solar power available in the grid (i.e., nighttime). The findings show that the unpredictability of renewable energy sources has hurt system profit in a few circumstances. This is not a desirable consequence for electricity producers. To increase total system profit, it is critical to reduce the cost of disequilibrium. This can be accomplished by deploying an adequate renewable energy forecasting technique or energy storage device to prevent power system disequilibrium.
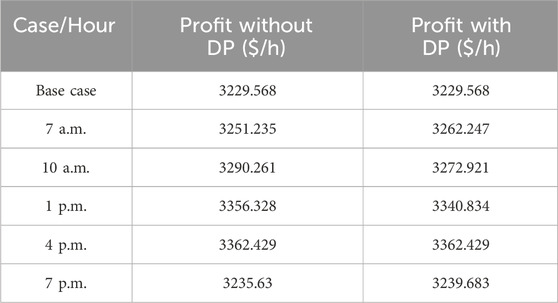
Table 7. System profit with and without DP.
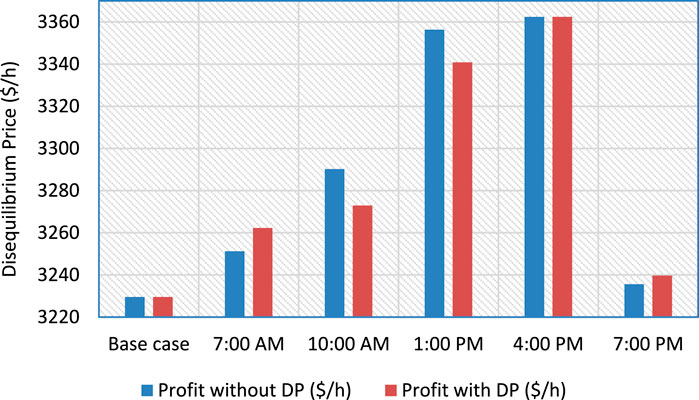
Figure 10. Comparison of system profit with and without DP
Case 5: The UPFC is used to maximize profit in deregulated systems while also improving the power system’s efficiency and economic performance. UPFC installation requires establishing the best cost-effective position and capacity for these devices in the power system, which may be done by mathematical programming. Reduced transmission losses, increased transmission capacity, and enhanced voltage stability can all lead to cheaper operating costs and higher profits for market participants such as generators and transmission companies. Furthermore, UPFC adoption can help to relieve congestion in the transmission network, allowing for better utilization of existing infrastructure and reduced consumer rates. Overall, UPFC placement is a useful device for maximizing profit in deregulated systems since it improves the economic performance and efficiency of the power system for both market participants and consumers.
It has been observed through the analysis of Table 7 and Figure 10 that the presence of disequilibrium prices has had a detrimental effect on the overall profit of the system in numerous instances. To address this issue, a methodology has been put forth in this section which aims to optimize the system profit by strategically placing FC and UPFC components in the presence of DP. The utilization of FC-integrated systems is required to mitigate the detrimental impact of disequilibrium pricing on system profitability. When there is excess solar power during off-peak load hours, the FC system employs an electrolyzer to produce hydrogen, which is subsequently used to create electricity at other times. Furthermore, FC technology covers the gap between expected and real solar power schedules, therefore increasing overall power generation. To maximize the system’s profit, a fixed energy capacity with a 2 MW FC system was installed on bus number 8, which has the highest demand (excluding the generator bus).
The results demonstrate that installing the FC system enhanced the system’s profit greatly since FCs are employed as energy storage to lessen the gap between expected and actual solar output. Table 8 depicts the profit for the deregulated system after accounting for disequilibrium pricing and the use of FCs. The UPFC installation can increase system profit by lowering system congestion costs. Table 9 shows the system profit once the FC and UPFC are installed. As a consequence, it is possible to deduce that the FC location is sufficient to optimize system profit while minimizing the influence of disequilibrium pricing in the system. UPFC increases system profit by cutting transmission line congestion while increasing power flow capacity through the current transmission channel.
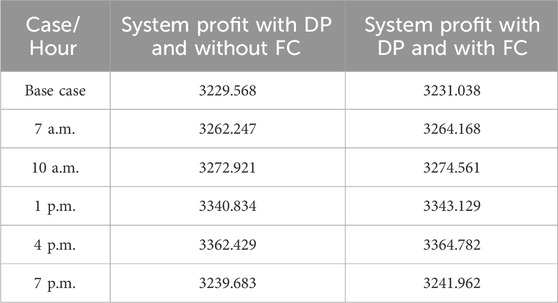
Table 8. System profit with DP and FC (In $/h).
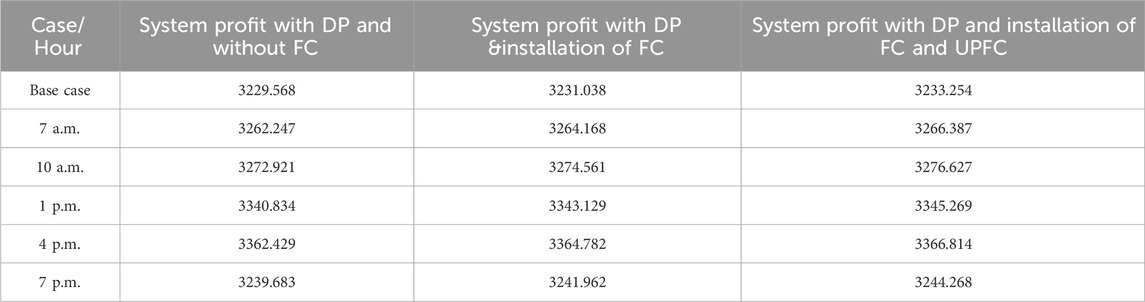
Table 9. System profit with DP after installation of FC and UPFC(In $/h).
The solar power installation adds to the system’s safety and security. Figures 11, 12 compare the system voltage profile and location-based marginal price profile with and without the presence of a solar facility. It can be observed that the voltage profile is attempting to get the maintain closer to 1 p. u., which will increase the system’s safety. The lower LBMP pricing gives a greater economic advantage to society as a result of the installation of solar electricity in the deregulated system.
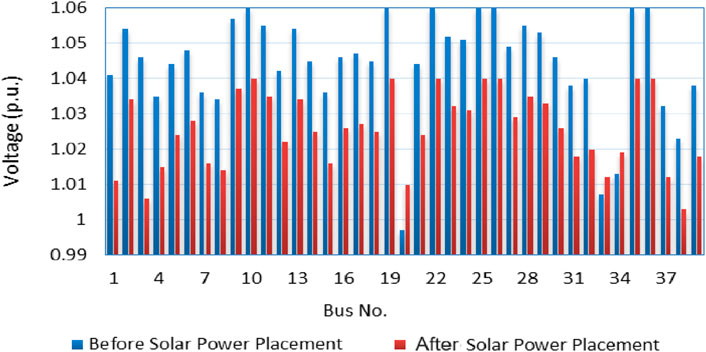
Figure 11. Voltage Comparison With And Without Solar Power (In p. u.).
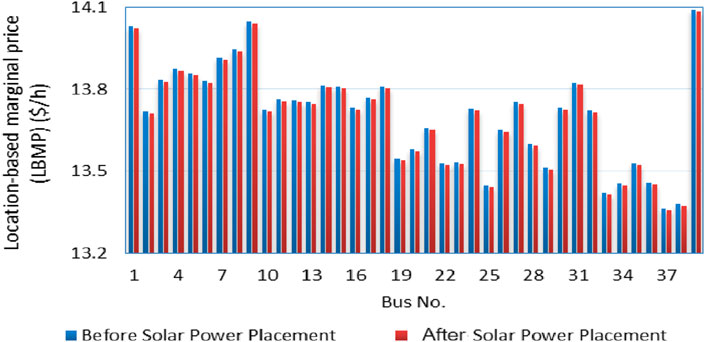
Figure 12. LBMP comparison with and without solar power (in $/h).
To assess the capabilities and usefulness of this presented strategy, several optimization methods, like Slime Mould Algorithm (SMA), have been used in combination with Sequential Quadratic Programming (SQP). Table 10 and Figure 13 show the system’s profitability using various optimization methodologies. According to the study, integrating a solar plant with an FC system increased system profitability above doing so without. The use of the SMA optimization technique in a solar-FC hybrid system to reduce disequilibrium pricing and system economic risk is a significant advancement in this work. In all analyzed cases of system profit maximization, SMA algorithms beat other optimization methods.
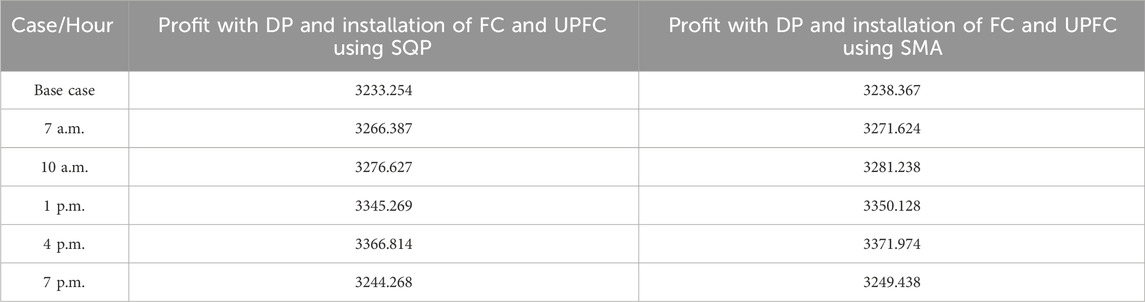
Table 10. System profit with DP, FC, and UPFC with different optimization methods (IN $/H).
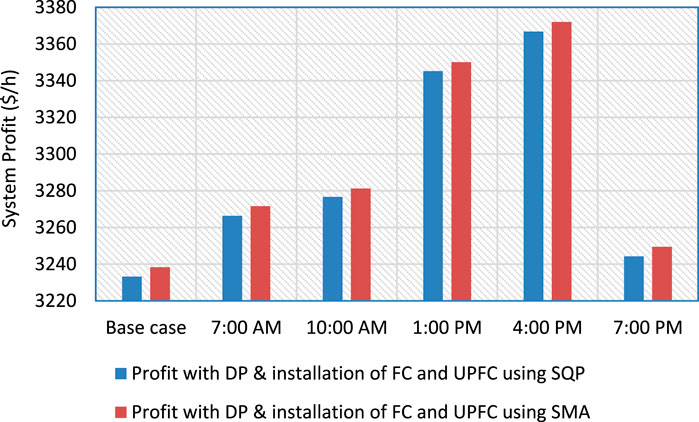
Figure 13. System profit comparison with DP, FC and UPFCWIth different optimization methods.
All prior examples (from Step 1 to Step 4) have employed the SQP. The SMA optimization approach, together with SQP, has been implemented in this part of the work. Based on the findings, it is possible to infer that combining UPFC and FC with the action of SMA can give improved economic safety to the power network.
6 Conclusions and future work
This work introduces a novel technique for reducing economic risks and determining the best site and parameter settings for UPFC and solar facilities in a deregulated environment. The proposed approach employs two novel indices based on location-based marginal pricing and transmission line flows to identify critical buses and lines in the system. These variables are then used to optimize the location of solar plants and UPFC to reduce economic risk. To assess the approach’s efficacy, a realistic IEEE 39-bus New England system was tested. The results show that the suggested technique efficiently decreases risk, optimizes system profit, improves social welfare, and lowers overall generating costs. The addition of solar power with UPFC reduces system risk, resulting in higher system revenues and less congestion. Furthermore, the addition of UPFC to the solar-powered system increases the LBMPs of buses across the network, helping customers by lowering energy costs. The study’s findings give useful insights for power sector professionals, allowing them to make educated decisions that maximize income while guaranteeing the energy system’s stability and efficiency. The paper discusses the utilization of an FC storage system to offset deviations in the real-time power market caused by the integration of solar power. The SMA algorithm is identified as the most effective optimization technique in terms of improving the system’s economic performance. There is a lot of potential for future study in this area, and some of it is mentioned in this paper, such as extended testing on bigger and more varied networks that may be undertaken. The study in this paper focuses on solar PV, however, it may also be undertaken with other renewable sources such as wind energy, etc. Assessing the environmental benefits of the suggested approach, particularly in terms of emission reduction and sustainability, can offer a comprehensive picture of its benefits.
The study proposes a promising approach to mitigating system risk and improving the location of UPFC and solar power plants in a deregulated system. But, some limitations can be considered for future research such as the extensive consideration of the economic and policy situation in different regions, which could affect the applicability and effectiveness.
Data availability statement
The original contributions presented in the study are included in the article/supplementary material, further inquiries can be directed to the corresponding author.
Author contributions
SD: Writing–original draft, Writing–review and editing. Shreya Shree Das: Writing–original draft, Writing–review and editing. MR: Writing–original draft, Writing–review and editing. GS: Writing–original draft, Writing–review and editing. SI: Writing–original draft, Writing–review and editing. TP: Writing–original draft, Writing–review and editing. UC: Writing–original draft, Writing–review and editing. TSU: Writing–original draft, Writing–review and editing.
Funding
The author(s) declare that no financial support was received for the research, authorship, and/or publication of this article.
Conflict of interest
The authors declare that the research was conducted in the absence of any commercial or financial relationships that could be construed as a potential conflict of interest.
Publisher’s note
All claims expressed in this article are solely those of the authors and do not necessarily represent those of their affiliated organizations, or those of the publisher, the editors and the reviewers. Any product that may be evaluated in this article, or claim that may be made by its manufacturer, is not guaranteed or endorsed by the publisher.
References
Aldaadi, M., Al-Ismail, F., Al-Awami, A. T., and Muqbel, A. (2021). A coordinated bidding model for wind plant and compressed air energy storage systems in the energy and ancillary service markets using a distributionally robust optimization approach. IEEE Access 9, 148599–148610. doi:10.1109/access.2021.3123792
Bhusan Basu, J., Dawn, S., Saha, P. K., Ranjan Chakraborty, M., Alsaif, F., Alsulamy, S., et al. (2023). Risk mitigation and profit improvement of a wind-fuel cell hybrid system with TCSC placement. IEEE Access 11, 39431–39447. doi:10.1109/access.2023.3267163
Bhusan Basu, J., Dawn, S., Saha, P. K., Ranjan Chakraborty, M., and Ustun, T. S. (2022). A comparative study on system profit maximization of a renewable combined deregulated power system. Electronics 11, 2857. doi:10.3390/electronics11182857
Biggins, F. A. V., Travers, D., Ejeh, J. O., Lee, R., Buckley, A., and Brown, S. (2023). The economic impact of location on a solar farm co-located with energy storage. Energy 278, 127702. doi:10.1016/j.energy.2023.127702
Das, A., Dawn, S., Gope, S., and Ustun, T. S. (2022a). A strategy for system risk mitigation using FACTS devices in a wind incorporated competitive power system. Sustainability 14, 8069. doi:10.3390/su14138069
Das, A., Dawn, S., Gope, S., and Ustun, T. S. (2022b). A risk curtailment strategy for solar PV-battery integrated competitive power system. Electronics 11, 1251. doi:10.3390/electronics11081251
Dawn, S., and Tiwari, P. K. (2016). Improvement of economic profit by optimal allocation of TCSC and UPFC with wind power generators in double auction competitive power market. Electr. Power Energy Syst. 80, 190–201. doi:10.1016/j.ijepes.2016.01.041
Dawn, S., Tiwari, P. K., Goswami, A. K., and Panda, R. (2019). An approach for system risk assessment and mitigation by optimal operation of wind farm and FACTS devices in a centralized competitive power market. IEEE Trans. Sustain. Energy 10 (3), 1054–1065. doi:10.1109/tste.2018.2859770
Huang, C., Wang, C., Xie, N., and Wang, Y. (2020). Robust coordination expansion planning for active distribution network in deregulated retail power market. IEEE Trans. Smart Grid 11 (2), 1476–1488. doi:10.1109/tsg.2019.2938723
Huang, Q., Xu, Y., and Courcoubetis, C. (2019). Financial incentives for joint storage planning and operation in energy and regulation markets. IEEE Trans. Power Syst. 34 (5), 3326–3339. doi:10.1109/tpwrs.2019.2909268
Huang, Q., Xu, Y., Wang, T., and Courcoubetis, C. A. (2018). Market mechanisms for cooperative operation of price-maker energy storage in a power network. IEEE Trans. Power Syst. 33 (3), 3013–3028. doi:10.1109/tpwrs.2017.2762350
Huang, S., Peng, L, Yang, M., Gao, Y., Yun, J., and Zhang, C. (2021). A control strategy based on Deep reinforcement learning under the combined wind-solar storage system. IEEE Trans. Industry Appl. 57 (6), 6547–6558. doi:10.1109/tia.2021.3105497
Hussain, S. M. S., Aftab, M. A., Ali, I., and Ustun, T. S. (2020). IEC 61850 based energy management system using plug-in electric vehicles and distributed generators during emergencies. Int. J. Electr. Power and Energy Syst. 119, 105873. doi:10.1016/j.ijepes.2020.105873
Jabbari Ghadi, M., Ali, A., Amin, R., Ghavidel, S., Li, L, Zhang, J., et al. (2020). Day-ahead market participation of an active distribution network equipped with small-scale CAES systems. IEEE Trans. Smart Grid 11 (4), 2966–2979. doi:10.1109/tsg.2020.2967937
Kaneko, A., Hayashi, Y., Anegawa, T., Hokazono, H., and Kuwashita, Y. (2020). Evaluation of an optimal radial-loop configuration for a distribution network with PV systems to minimize power loss. IEEE Access 8, 220408–220421. doi:10.1109/access.2020.3043055
Kong, J., Kim, S. T., Kang, B. O., and Jung, J. (2019). Determining the size of energy storage system to maximize the economic profit for photovoltaic and wind turbine generators in South Korea. Renew. Sustain. Energy Rev. 116, 109467. doi:10.1016/j.rser.2019.109467
Kumar, N., Panigrahi, B. K., and Singh, B. (2016). A solution to the ramp rate and prohibited operating zone constrained unit commitment by GHS-JGT evolutionary algorithm. Electr. Power Energy Syst. 81, 193–203. doi:10.1016/j.ijepes.2016.02.024
Kumar, N., Saxena, V., Singh, B., and Ketan Panigrahi, B. (2020). Intuitive control technique for grid-connected partially shaded solar PV-based distributed generating system. IET Renew. Power Gener. 14, 600–607. doi:10.1049/iet-rpg.2018.6034
Kumar, N., Saxena, V., Singh, B., and Panigrahi, B. K. (2023). Power quality improved grid-interfaced PV-assisted onboard EV charging infrastructure for smart households consumers. IEEE Trans. Consumer Electron. 69 (4), 1091–1100. doi:10.1109/tce.2023.3296480
Kun Ren, H., Ashtine, M., McCulloch, M., and Wallom, D. (2023). An analytical method for sizing energy storage in microgrid systems to maximize renewable consumption and minimize unused storage capacity. J. Energy Storage 68, 107735. doi:10.1016/j.est.2023.107735
Li, J., Wang, C., and Wang, H. (2023). Deep reinforcement learning for wind and energy storage coordination in wholesale energy and ancillary service markets. Energy AI 14, 100280. doi:10.1016/j.egyai.2023.100280
Liang, C., Yuan, H., Zhao, C., Zhang, R., Yang, A., Chu, J., et al. (2024). A reconfigurable wireless power transfer system with constant exciting current for charging multiple batteries. Electr. Power Energy Syst. 160, 110084. doi:10.1016/j.ijepes.2024.110084
Liu, J., Bo, R., Wang, S., and Chen, H. (2021). Optimal scheduling for profit maximization of energy storage merchants considering market impact based on dynamic programming. Comput. and Industrial Eng. 155, 107212. doi:10.1016/j.cie.2021.107212
Ranganathan, S., and Rajkumar, S. (2021). Self-adaptive firefly-algorithm-based unified power flow controller placement with single objectives. Complexity 2021. article ID. 5571434. doi:10.1155/2021/5571434
Ranjan, S., Jaiswal, S., Abdul, L., Das, D. C., Sinha, N., Hussain, S. M. S., et al. (2021). Isolated and interconnected multi-area hybrid power systems: a review on control strategies. Energies 14 (24), 8276. doi:10.3390/en14248276
Safiullah, S., Rahman, A., Ahmad Lone, S., Hussain, S. S., and Ustun, T. S. (2022). Robust frequency–voltage stabilization scheme for multi-area power systems incorporated with EVs and renewable generations using AI based modified disturbance rejection controller. Energy Rep. 8, 12186–12202. doi:10.1016/j.egyr.2022.08.272
Shree Das, S., and Kumar, J. (2024). Profit enhancement and grid frequency control by energy level scheduling of CAES system in wind-connected electrical system. Wind Eng. 48 (2), 194–216. doi:10.1177/0309524x231203686
Shree Das, S., Kumar, J., Dawn, S., and Salata, F. (2023). Existing stature and possible outlook of renewable power in comprehensive electricity market. Processes 11 (6), 1849. doi:10.3390/pr11061849
Shri Saranyaa, J., and Peer Fathima, A. (2023). A comprehensive survey on the current trends in improvising the renewable energy incorporated global power system market. IEEE Access 11, 24016–24038. doi:10.1109/access.2023.3252574
Tian, K., Sun, W., and Han, D. (2022). Strategic investment in transmission and energy storage in electricity markets. J. Mod. Power Syst. Clean Energy 10 (1), 179–191. doi:10.35833/mpce.2020.000927
Tian, K., Sun, W., Han, D., and Yang, C. (2020). Joint planning and operation for renewable-storage under different financial incentives and market mechanisms. IEEE Access 8, 13998–14012. doi:10.1109/access.2020.2966224
Wang, X., Li, F., Zhang, Q., Shi, Q., and Wang, J. (2023). Profit-oriented BESS siting and sizing in deregulated distribution systems. IEEE Trans. Smart Grid 14 (2), 1528–1540. doi:10.1109/tsg.2022.3150768
Wu, Z., Zhou, M., Wang, J., Du, E., Zhang, N., and Li, G. (2020). Profit-sharing mechanism for aggregation of wind farms and concentrating solar power. IEEE Trans. Sustain. Energy 11 (4), 2606–2616. doi:10.1109/tste.2020.2967860
Xiang, X., Wei, Z., Jie, Z., Ning, X., and Qi, X. (2018). “Key technologies and applications of AC/DC hybrid distributed renewable energy system,” in 2018 international conference on power system technology (POWERCON) (Guangzhou, China), 4265–4631.
Zadehbagheri, M., Ildarabadi, R., and Majid Javadian, A. (2023). Optimal power flow in the presence of HVDC lines along with optimal placement of FACTS in order to power system stability improvement in different conditions: technical and economic approach. IEEE Access 11, 57745–57771. doi:10.1109/access.2023.3283573
Keywords: solar PV, VAR, CVaR, FACTS, economic profit, deregulated system
Citation: Dawn S, Das SS, Ramesh M, Seshadri G, Inkollu SR, Pandraju TKS, Cali U and Ustun TS (2024) Risk alleviation and social welfare maximization by the placement of fuel cell and UPFC in a renewable integrated system. Front. Energy Res. 12:1428458. doi: 10.3389/fenrg.2024.1428458
Received: 06 May 2024; Accepted: 13 August 2024;
Published: 29 August 2024.
Edited by:
Jinpeng Tian, Hong Kong Polytechnic University, Hong Kong SAR, ChinaReviewed by:
Kareem AboRas, Alexandria University, EgyptKenneth E. Okedu, Melbourne Institute of Technology, Australia
Liang Ma, University of Wollongong, Australia
Cong Zhang, Hunan University, China
Copyright © 2024 Dawn, Das, Ramesh, Seshadri, Inkollu, Pandraju, Cali and Ustun. This is an open-access article distributed under the terms of the Creative Commons Attribution License (CC BY). The use, distribution or reproduction in other forums is permitted, provided the original author(s) and the copyright owner(s) are credited and that the original publication in this journal is cited, in accordance with accepted academic practice. No use, distribution or reproduction is permitted which does not comply with these terms.
*Correspondence: Subhojit Dawn, c3ViaG9qaXQuZGF3bkBnbWFpbC5jb20=; Umit Cali, dW1pdC5jYWxpQG50bnUubm8=; Taha Selim Ustun, c2VsaW0udXN0dW5AYWlzdC5nby5qcA==