
94% of researchers rate our articles as excellent or good
Learn more about the work of our research integrity team to safeguard the quality of each article we publish.
Find out more
ORIGINAL RESEARCH article
Front. Energy Res., 31 July 2024
Sec. Smart Grids
Volume 12 - 2024 | https://doi.org/10.3389/fenrg.2024.1428012
This article is part of the Research TopicAdvancements in Power System Condition Monitoring, Fault Diagnosis and Environmental CompatibilityView all 16 articles
 Ruidong Yu
 Zhousheng Zhang*
Introduction: The traditional partial discharge localization improvement strategy mainly starts from the intelligent algorithm, but fails to consider the influence of core winding and oil temperature on partial discharge positioning.
Methods: This paper also considers the influence of the iron core winding and oil temperature. Through finite element simulation, a transformer model was established to analyze the propagation characteristics of ultrasonic signals generated by partial discharge under the interference of gradient oil temperature and winding. The chaotic firefly-particle swarm hybrid algorithm is proposed, and through the calculation of Shubert’s multi-peak function. Finally, a partial discharge defect platform based on gradient oil temperature was built to verify the chaotic firefly-particle swarm hybrid localization algorithm.
Results: The ultrasonic velocity generated by partial discharge in transformers cannot be fixed, and it is suggested that ultrasonic sensors should be installed near the center of the top of the transformer. The proposed algorithm can be better optimized in the case of multiple local extreme points. Under gradient oil temperature experiments, the algorithm achieves positioning errors less than 100 and 55 mm for cases with and without winding obstruction, respectively, with average positioning errors of 74.2 and 35.2 mm.
Discussion: The positioning method in this paper can provide a technical reference for the partial discharge positioning of transformers in actual operation.
As the scale of electric power enterprises continues to expand, a large number of transformers need to be put into operation for extended periods. In order to ensure the stability of the power system, partial discharge (PD) detection under energized conditions has become a key technology (Guerra et al., 2016; Weiqiang et al., 2020). Partial discharge, as a discharge phenomenon in electrical faults, contains rich information such as electrical, acoustic, optical, and thermal aspects. By reasonably applying detection techniques and intelligent positioning algorithms, technical personnel can promptly and accurately identify faults in transformers, laying a solid foundation for effective equipment maintenance (Li et al., 2015; Cai et al., 2021; Guo, 2022). Currently, ultra-high frequency (UHF) detection technology and acoustic electric (AE) detection technology have relatively matured.
Among them, UHF signal frequencies can reach 300 M to 3 GHz, with a wide detection bandwidth, and can avoid corona interference below 300 MHz in the field (Li et al., 2015); however, UHF pulse signals have short durations, making them difficult to collect, and are susceptible to shielding by transformer components during signal propagation. On the other hand, ultrasound signals have strong penetration capabilities, long pulse durations, and are easy to collect, making them suitable for partial discharge localization. However, when directly installed on the transformer casing, the measured signal is the non-line-of-sight wave transmitted laterally along the casing (Liu, 2014; Jia et al., 2022). In order to reduce noise interference leading to misidentification of partial discharge signals and collection errors caused by single sensors, the most direct original waveform of partial discharge measurement, invasive acoustic-electric joint detection technology, has been used for partial discharge localization research (Song et al., 2020; Yingjie et al., 2023; Su et al., 2024). In general, there are two ways to install the intrusive acoustic-electric combined sensor: one is to make holes in the transformer, which will destroy the transformer shell but will not affect the oil injection of the transformer (Su et al., 2024); Another method is to extend into the joint sensor through the oil valve, which has the advantage of not destroying the original structure of the transformer (Si et al., 2019).
To address the localization problem of partial discharge defects, the time difference of arrival (TDOA) algorithm is commonly used, which involves establishing a system of quadratic equations and transforming it into an optimization problem for solving (Ma et al., 2020). Traditional TDOA (Time Difference of Arrival) based on intelligent algorithms such as Particle Swarm Optimization and Genetic Algorithm (Antony and Punekar, 2018; Wang et al., 2018) have been continuously optimized to improve localization accuracy. However, they have not been able to analyze the influence of reflections caused by components such as iron core windings along the signal transmission path on time difference calculations. Most improvement studies focus on increasing the number of sensors. Reference (She et al., 2021), for instance, selects and locates multiple sensor time difference combinations through artificial bee colony algorithms and uses the secondary optimization solution of the K-means clustering algorithm as the final localization result. Reference (Besharatifard et al., 2022) disperses sensor arrays throughout the transformer, selecting direct partial discharge signals not propagated through the core and windings for time difference calculations. Reference (Liang, 2014) adopts the semi-definite relaxation method of successive approximation, and the time difference effect on the winding and the error interval are continuously approximating the result, but the improper selection of the error threshold will increase the calculation error. These methods do not consider the influence of transformer oil temperature on time difference calculations, and multi-element sensors can lead to installation difficulties and increased costs, which are not conducive to the practical localization of partial discharge in transformers during operation.
The core and windings of transformers generate heat due to operation and losses, resulting in a temperature rise in the transformer oil. According to the thermal siphon effect, after the slow flow of transformer oil, the temperature is lower at the bottom of the oil tank and higher at the top, presenting a gradient layering phenomenon overall (Jin, 2020; Junyi, 2021). Taking an oil-immersed forced-air-cooled transformer as an example, the temperature difference between the top and bottom oil layers can exceed 40°C, with a nearly 10% difference in wave speed, which has a certain impact on partial discharge localization.
In response to the shortcomings of traditional partial discharge localization methods that neglect temperature effects, this study employs COMSOL simulation to establish a comprehensive model based on gradient oil temperature and iron core windings. It analyzes the propagation characteristics of ultrasonic waves in the complex environment of transformers. The study proposes the integration of a CFA-PSO algorithm with variable velocity to enhance the localization effectiveness of intelligent algorithms.
As shown in Figure 1, three ultrasonic sensors and one ultra-high frequency sensor are arranged inside the transformer casing, and a spatial rectangular coordinate system is established at the vertex of one corner of the transformer.

Figure 1. Partial discharge location model.
Let the position of the ultra-high frequency sensor be S0 (x0, y0, z0), and the positions of the ultrasonic sensors be respectively S1 (x1, y1, z1), S2 (x2, y2, z2), and S3 (x3, y3, z3). The position of the partial discharge source is denoted as P (x, y, z). Since electrical signals propagate much faster than ultrasonic signals, the time point when the ultra-high frequency sensor receives the electrical signal can be used as a time reference. By calculating the time differences between when each ultrasonic sensor receives the sound signal and this time reference, the actual propagation time of the sound signal can be determined. Thus, the following system of equations can be obtained using the time difference positioning method:
In Eq. 1, νe represents the equivalent sound speed of ultrasonic waves. Taking the square of both sides of the equation system transforms it into a system of quadratic equations in three variables. Theoretically, the localization result of the partial discharge source can be obtained with three equations. However, in the presence of errors, directly solving the quadratic equation system may result in complex or no solutions, leading to incorrect localization results. Therefore, it is common to construct an optimization problem based on error minimization and indirectly solve it using the least squares method (Shi et al., 2017).
Firstly, the objective function (Eq. 2) is constructed based on the set of equations (Eq. 1), as:
Subsequently, the expression for the objective function (f) is obtained as Eq. 3:
Obviously, f ≥ 0, and if and only if f = 0, x, y, z are the solutions to the system of Eq. 1. For a given monitoring object, the area where partial discharge may occur is fixed, so the following optimization problem can be constructed:
Obviously, the solution of the optimization problem Eq. 4 is equivalent to the solution of the TDOA Eq. 1, and solving the optimization problem does not produce an imaginary solution, which improves the stability of the TDOA algorithm.
Usually, scholars in partial discharge localization use a fixed value of the equivalent sound speed at room temperature, typically 1,420 m/s. However, in reality, the winding iron core structure inside the transformer is complex, which may cause reflections and refractions of ultrasonic signals along the transmission path, along with the transformer casing. Additionally, the temperature of the oil can also affect the propagation speed of ultrasonic waves. Reference (Yuan, 1992) obtained through the pulse cycle velocity method, an approximate linear relationship between the ultrasonic wave velocity and the temperature rise of the transformer oil, which can be expressed by Eq. 5:
Where T is measured in Kelvin. According to the national standard GB1094.1-1996“Power Transformers Part 1: General”, the top oil temperature of the transformer is generally controlled within 85°C, and an alarm is required at 80°C. Therefore, this paper mainly focuses on studying the gradient oil temperature below this limit of the top oil temperature.
In COMSOL, a basic model of the transformer was constructed, consisting of the iron core, windings, insulation oil, and the transformer casing. Using the Fluid Heat Transfer and Acoustics Module, the propagation characteristics of ultrasonic signals under the gradient oil temperature conditions of partial discharge in the transformer were simulated.
Figure 2 shows a 2D COMSOL model of the transformer. In order to analyze the influence of gradient oil temperature and winding occlusion on ultrasonic propagation, four observation points (1–4) were placed along the inner wall of the transformer at coordinates (0.18, 0.29), (0.15, 0.29), (0, 0.2), and (0.25, 0), respectively. The position of the partial discharge source P is (0.32, 0.12), all coordinates are in meters. The top oil temperature of the transformer is 80°C, while the bottom oil temperature is 30°C. Observation points 1 and 2 are at the top of the transformer model and are relatively close together, so the transmitted path of the received signal is also about the same. In contrast, observation point 4 is at the bottom of the transformer, and the transformer is separated by a gradient temperature between the top and bottom of the transformer. The observation point 3 is located on the side of the transformer, and the signal will cross the winding when it reaches the observation point 3.
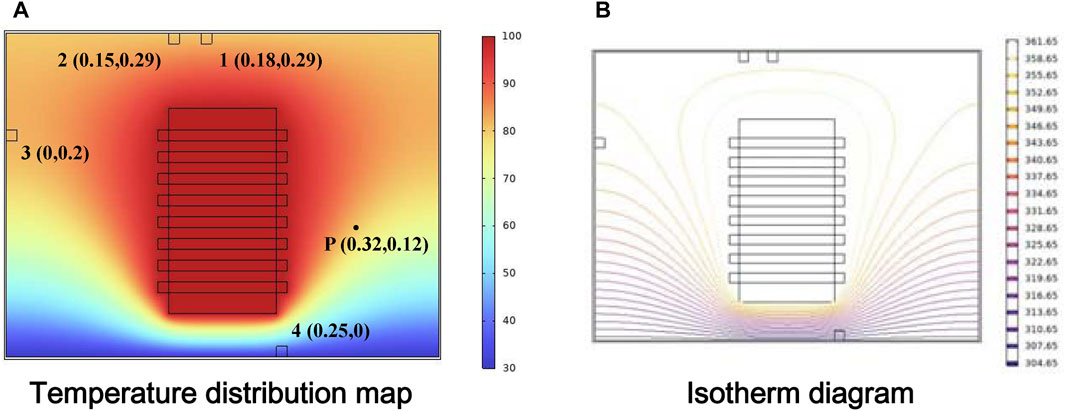
Figure 2. COMSOL simulation diagram. (A) Temperature distribution map (B) Isotherm diagram.
The geometrical Specifications and physical properties of each component of the transformer model are shown in Tables 1, 2, respectively.
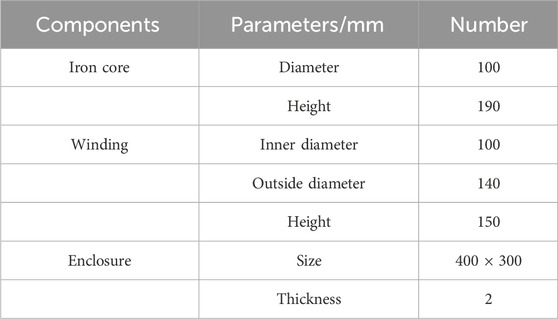
Table 1. Geometrical specifications.
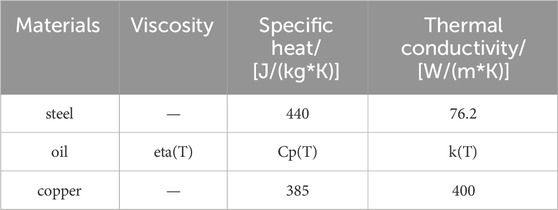
Table 2. Physical properties.
The density function rho(T) of the transformer oil is an inbuilt function in the COMSOL, software, which varies with temperature. The specific expression is (Eq. 6):
In the pressure acoustics physics field, the signal source of partial discharge can be considered as a point sound source. According to references (Shen and Sun, 1981; Yang, 2011), the vibration of gas bubbles generated by partial discharge is underdamped vibration. A single exponential decay function is chosen as the signal source, and the function is represented as (Eq. 7):
In the equation, A represents the signal amplitude of the partial discharge, τ is the time decay constant, and f denotes the ultrasonic frequency.
In COMSOL pressure acoustics simulations, the mesh size is typically selected from one-tenth to one-fifth of the wavelength, which is inversely proportional to frequency. If the center frequency is set high, the meshing will be very thin, resulting in a high degree of freedom in the model that is difficult to calculate. Therefore, it is easier to simulate the propagation of sound pressure in transformer oil by taking a smaller center frequency. In the end, set the grid size to extremely fine mode. A boundary layer is set for the observation points and iron core windings (Mehrpooya et al., 2024), with a minimum angle of 240° to split and a maximum angle of 100° for each split. The grid size setting and grid generation diagram are shown in Table 3; Figure 3, respectively.
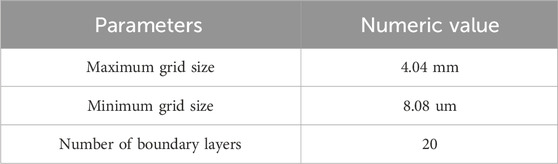
Table 3. Grid size.
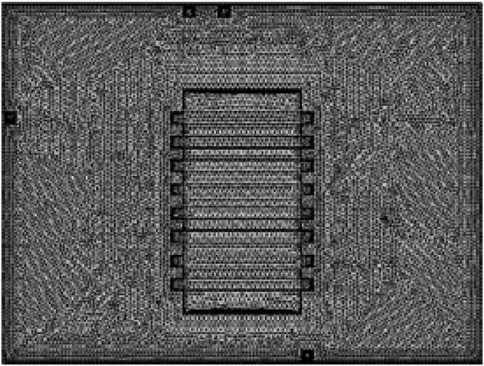
Figure 3. Grid generated graph.
The waveform simulation parameters are as follows: f = 80kHz, τ = 1/144,000, A = 1. The signal diagram of partial discharge is shown in Figure 4.
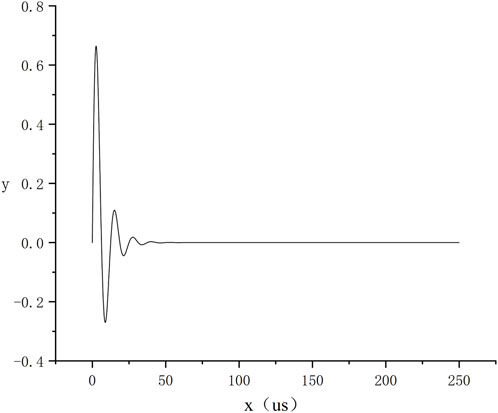
Figure 4. Partial discharge signal diagram.
The governing PDE used by this module to solve the acoustic wave propagation is given by (Eq. 8):
Where pt is the pressure of acoustic wave [Pa], ρ is the density of the material [kg/m3], c is the speed of the acoustic wave in the given medium [m/s], qd is the dipole domain source of the energy [N/m3], and Q is the monopole point source of the energy [m3/s].
Firstly, the thermal field at steady state is established to establish a transformer model of gradient oil temperature. Then, the sound field under transient conditions is established, and the propagation characteristics of ultrasonic waves in complex environments are analyzed, and the simulation time is set to 500 us, and the step time is 0.5 us.
The boundary equation is mainly used to define the boundaries of the transformer housing, and the specific expression is (Eq. 9):
Where the acoustic impedance z is expressed as the product of the density of the substance and the corresponding velocity. Table 4 shows the boundary conditions for the simulation.
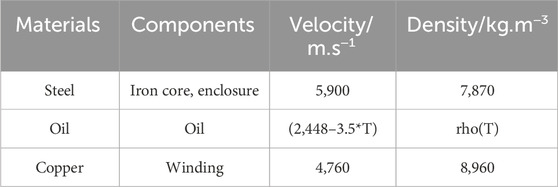
Table 4. Boundary conditions.
During the initial stage of partial discharge, the sound pressure rapidly expands within the transformer model, but once the sound pressure fills the entire transformer, there is no significant change (Qi et al., 2015). Therefore, in this study, the sound pressure distribution at 30, 100, and 130 μs moments is selected to analyze the propagation characteristics of ultrasonic waves in the transformer, as shown in Figure 5.
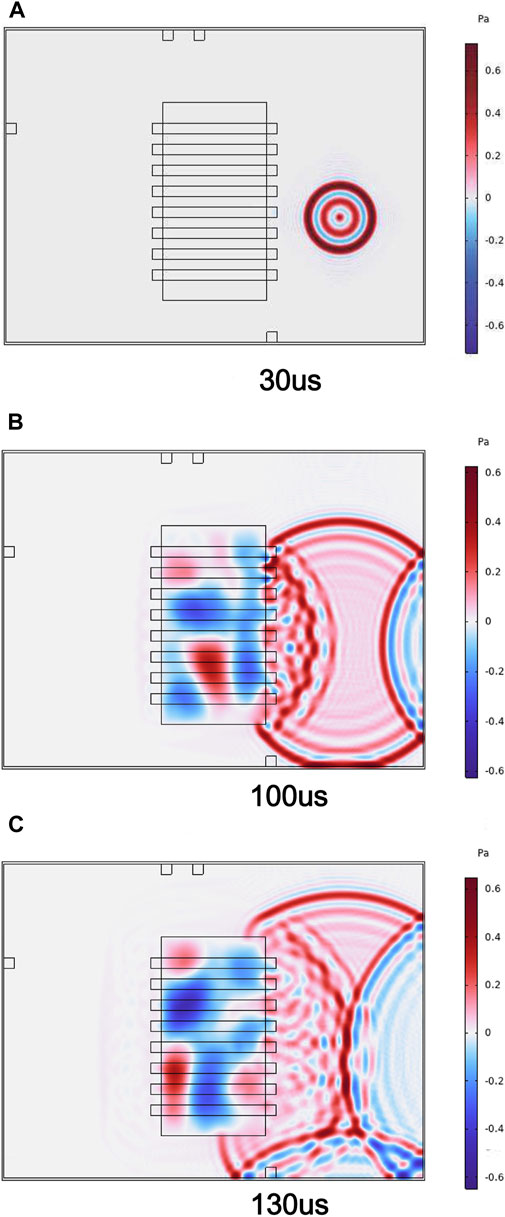
Figure 5. Spatial sound pressure distribution of transformer at each time. (A) 30 us. (B) 100 us. (C) 130 us.
At 30 μs, the ultrasonic signal propagates in an approximately spherical manner from the point source to the surroundings. At 100 μs, the ultrasonic signal propagates to the winding and the casing, undergoing reflection and refraction. It can be observed that after crossing the winding in the diameter direction, the sound wave has suffered significant attenuation, making it difficult for this signal to be used for sensor measurements. At 130 μs, diffraction occurs in the upper right corner of the winding, causing an increase in the time delay received at observation points 1 and 2. Multiple waveform overlap phenomena appear in the lower right corner of the transformer, indicating that the corner position of the enclosure is not suitable for installing ultrasonic sensors.
The average speed of ultrasonic wave propagation to each observation point will be affected by the transmission path and oil temperature. Simulations were conducted under conditions of varying oil temperature gradient, fixed oil temperature, with and without winding obstruction. The average speed of the signal transmission from the partial discharge source to each observation point was calculated based on the time delay, and the results are shown in Table 5.
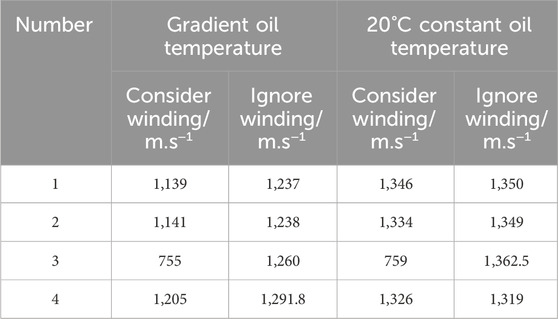
Table 5. Average sound velocity at each observation point.
Since the transmission path from the partial discharge source to observation points 1 and 2 is roughly the same, regardless of the presence of winding obstruction, their average speeds can be approximately considered equal. Observation point 3 cannot receive the refracted signal that crosses the winding, but can only measure the waveform reflected multiple times from the transformer casing, resulting in a significant increase in time delay, which is not conducive to localization. Observation point 4, affected by the temperature gradient in the vertical direction, has a certain deviation in average sound speed.
Based on the above analysis, the ultrasonic sensor array should be installed near the center of the top of the transformer casing, and the spacing between the array elements should not be too large. Considering the array size and obtaining time delay, this study adopts a sensor spacing of 35 mm. The flange design drawing is shown in Figure 6:
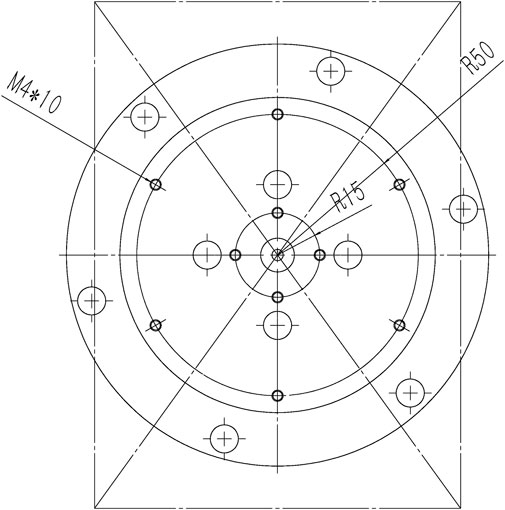
Figure 6. Flange design drawing.
Assuming the top layer oil temperature is t1 and the bottom layer oil temperature is t2, if we neglect the winding diffraction, according to Eq. 3, the average sound speed of the ultrasonic wave should be between the wave speeds corresponding to the top layer and bottom layer oil temperatures, that is, [νeq (t1), νeq (t2)]. In reality, the diffraction caused by the winding can decrease the average sound speed by approximately 10%. Therefore, the average sound speed can be approximated as [0.9*νeq (t1), νeq (t2)] for localization calculations.
The Firefly Algorithm (FA) is a heuristic algorithm developed by Yang (2008) based on the light emission behavior of firefly populations. The core ideas of this algorithm are as follows:
(1) Initially, a certain number of fireflies are randomly generated in the search space, and their brightness is related to the objective function value. Fireflies closer to the global optimum are brighter. Assuming there are N fireflies in a D-dimensional space, the position vector of the i-th firefly is xi, and its relative brightness is calculated using (Eq. 10):
where I0 is the maximum brightness of the firefly, γ is the light absorption coefficient, and rij=||xi - xj|| represents the distance between firefly i and j.
(2) Fireflies are attracted to each other, and the attraction force between two fireflies decreases with increasing distance. The attraction force from firefly i to firefly j is given by (Eq. 11):
where β0 is the maximum attraction force.
(3) Fireflies with lower brightness will move towards brighter ones. The distance between two fireflies and their flying speed are inversely related. The movement of firefly i is given by (Eq. 12):
Here, α is the step size factor, and the random perturbation term introduces randomness to avoid premature convergence during the search process.
Particle Swarm Optimization (PSO) is a classical algorithm for partial discharge localization, known for its short computation time and fast convergence. However, it tends to get trapped in local optima. On the other hand, the FA accelerates flight through mutual attraction of fireflies, which helps to some extent in avoiding local optima, though its convergence speed is slower compared to PSO. Additionally, the accuracy of both algorithms is influenced by the choice of initial values.
Considering these factors, this paper combines FA and PSO algorithms, introducing the Tent chaotic mapping to form the Chaotic Firefly Particle Swarm Optimization (CFA-PSO) algorithm. The Tent mapping exhibits good distribution and randomness within the (0, 1) range, making it suitable for constructing initial individual distributions. The specific expression is (Eq. 13):
The basic process of CFA-PSO is illustrated in Figure 7.
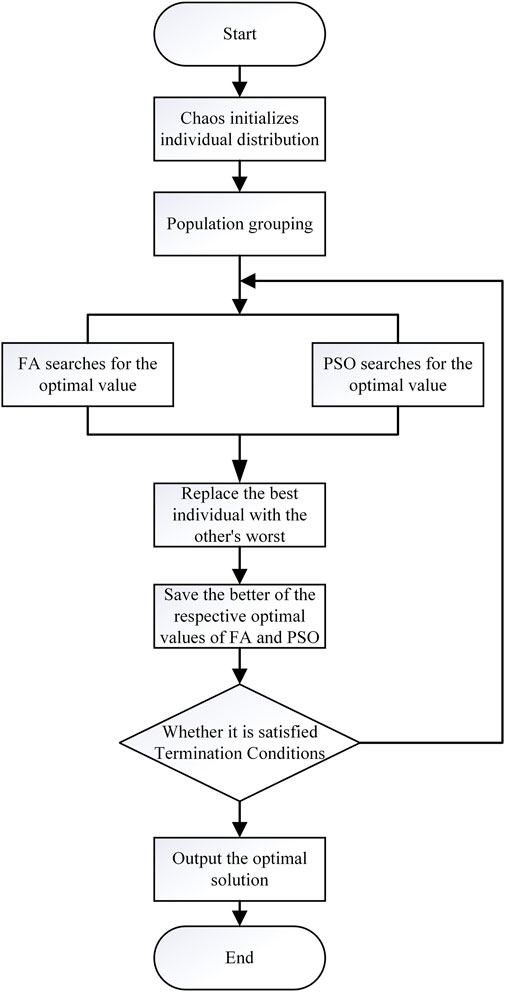
Figure 7. Algorithm flow chart.
The Shubert function, as a multimodal function, has multiple local optima within the interval [−2, 2], making it suitable for evaluating the local convergence performance of algorithms. Randomly generating 300 initial individuals within this interval, with a maximum iteration count set to 50, we observe the ability of each initial individual to retrieve the optimal value. Figures 8A, B depict the optimized individual distributions obtained by the PSO and CFA-PSO algorithms, respectively, after computation. In the figures, the red points represent the optimized individuals.
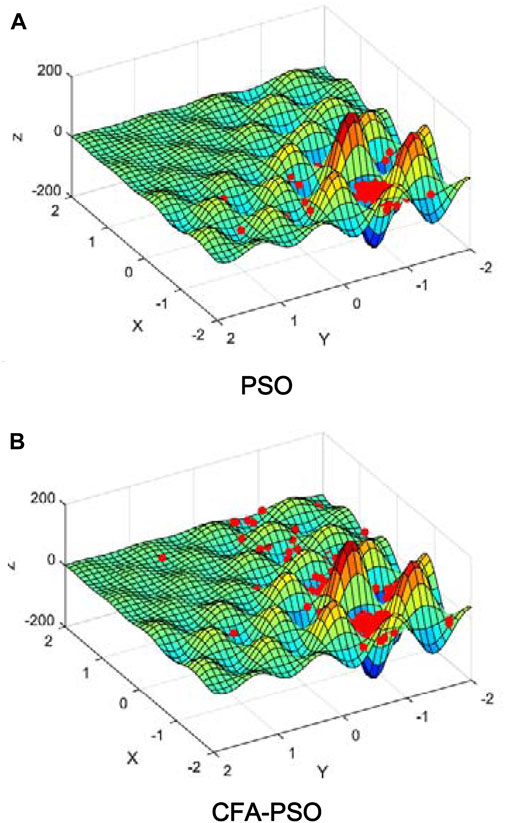
Figure 8. Shubert function simulation. (A) PSO. (B) CFA-PSO.
The computation results indicate that the optimized individuals in the PSO algorithm tend to cluster in regions with relatively good results, while in the CFA-PSO algorithm, despite most of the optimized individuals converging near the optimal value, a portion still explores the external environment for optimization, thereby partially overcoming the drawback of PSO algorithm’s susceptibility to local optima.
The ultrasonic radiated frequency is related to the surrounding medium capacitance at the occurrence of partial discharge (Yanqing, 2003). According to the Technical Specification for Ultrasonic Detection of Partial Discharge Instruments (QGDW11061-2017), the central frequency of ultrasonic detection probes for oil-immersed transformers should ideally range from 80 to 200 kHz. Therefore, this study selected a commonly available piezoelectric ultrasonic probe with a central frequency of 200 kHz, specifically the model EU10PIF200H07T/R, with an operating temperature range of −30°C to +85°C. The study utilized an ultra-high-frequency sensor based on the horn antenna principle, constructed of conical brass, operating in the detection frequency range of 300 MHz to 3 GHz.
To simulate partial discharge defects inside the transformer, a typical needle-plate discharge model was employed. In this model, the needle electrode had a radius of 0.25 mm and was made of a needle tube, while the plate electrode was a smooth copper plate with a radius of 40 mm. A 2 mm thick insulating paper was placed between the needle and plate electrodes, and the gap between the needle and plate was set to 30 mm. The defect model is depicted in Figure 9.
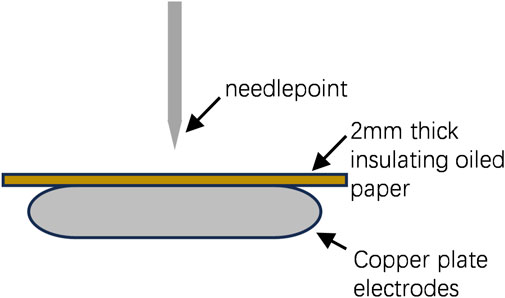
Figure 9. Needle plate defect model.
In the laboratory, a typical needle-plate discharge model was employed inside an oil tank measuring 50 cm × 30 cm × 30 cm, simulating partial discharge defects in transformers to validate the effect of oil temperature on the localization of partial discharge defects. The layout of the oil tank model is depicted in Figure 10. The tank was filled with 25# insulating oil, covered with epoxy board to isolate external electrical signal noise interference, and a dielectric window was placed on the top left side of the tank for observation.
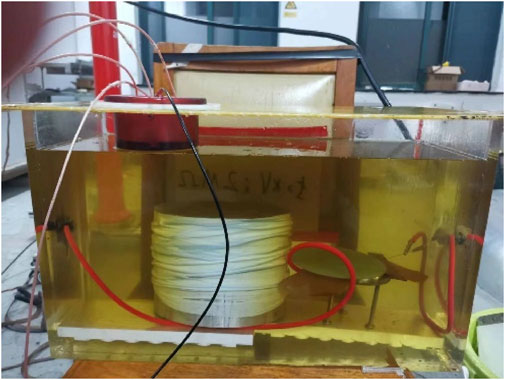
Figure 10. Fuel tank model layout drawing.
The temperature signal and the acoustoelectric signal detected by the sensors were transmitted to the PC and oscilloscope, respectively, after amplification and filtering through the circuit. The needle-tip defect model was located on the right side inside the tank, with the needle electrode connected to the AC power source through a capacitive voltage divider and protective resistor. The ultra-high-frequency sensor was integrated into the dielectric window, while the temperature sensor and three ultrasonic sensors were in contact with the oil surface. The temperature sensor model was DS18B20, and the distance from the needle tip of the defect model to the center of the dielectric window was 272 mm. The experimental wiring diagram is shown in Figure 11.

Figure 11. Experimental layout drawing.
Transformer oil was added to the oil tank up to 2/3 of its height, then heated to 80°C at the oil surface using electric heating rods. Subsequently, 30°C insulating oil was slowly injected into the bottom of the tank to reach 1/3 of its height. The needle-plate defect model was then pressurized at a rate of 0.1 kV/s, with partial discharge phenomena appearing at around 18 kV. As the oil temperature naturally cooled, partial discharge localization under different temperature gradients was simulated. A three-dimensional Cartesian coordinate system was established, with the bottom-left corner of the tank as the origin. Localization of partial discharge signals was then conducted under conditions with and without winding blockage, using constant acoustic velocities of 1,420 m/s and variable velocities within the range [0.9*νeq (t1), νeq (t2)]. The partial discharge signals were detected and calculated using the CFA-PSO algorithm. The localization results are shown in Tables 6, 7, respectively.
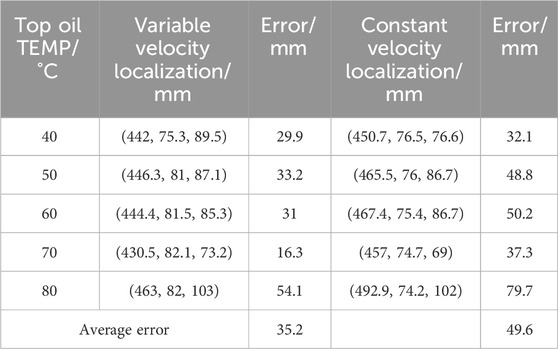
Table 6. Partial discharge location without windings.

Table 7. Partial discharge location with windings.
In the absence of winding blockage, the average localization error under variable acoustic velocity was 35.2 mm, with a maximum localization error not exceeding 55 mm, indicating good adaptability to temperature gradients. However, under constant velocity, the average localization error was 49.6 mm, and with increasing oil temperature, the error tended to increase. After introducing winding blockage, the average error under variable acoustic velocity was 74.2 mm, with a maximum localization error of no more than 100 mm. However, under constant velocity, the average localization error increased to 178.2 mm, failing to meet the accuracy requirements for localization.
Combining the experimental results with and without winding blockage, it can be concluded that the algorithm proposed in this study, based on variable acoustic velocity, effectively reduces localization errors under the influence of oil temperature and winding blockage. To validate the superiority of the algorithm proposed in this paper, the aforementioned delay data, based on variable acoustic velocity, were utilized to compare localization with and without winding blockage using the FA algorithm, PSO algorithm, and the algorithm proposed in this study. The error results are illustrated in Figures 12, 13.
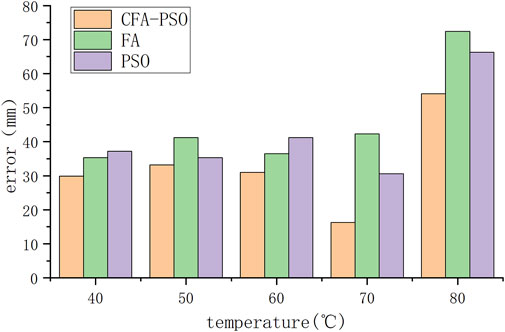
Figure 12. The positioning accuracy of different algorithms without winding occlusion.
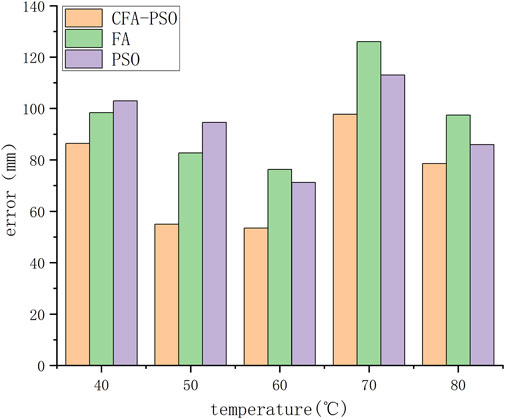
Figure 13. The positioning accuracy of different algorithms under the shielding of windings.
Comparing the localization results of different algorithms with and without winding blockage, it is evident that under variable acoustic velocities, the algorithm presented in this paper achieves lower localization errors than both the FA and PSO algorithms, with an overall reduction in error of about 20%.
Based on the above analysis, the localization method proposed in this paper, which optimizes both the algorithm and the equivalent acoustic velocity, enhances localization accuracy. This demonstrates that the method provided in this paper can offer effective guidance for online monitoring of partial discharges.
1) Through COMSOL simulation, the propagation characteristics of ultrasonic waves under gradient oil temperatures were studied, demonstrating that using a non-fixed equivalent acoustic velocity in the localization algorithm more accurately reflects the real conditions for locating partial discharges in transformers. Additionally, using a sound-electric hybrid localization system based on a dielectric window at the transformer’s top shell is more beneficial in reducing the impact of gradient oil temperatures on localization.
2) In response to the limitations of the FA and PSO algorithms, the CFA-PSO algorithm was designed. By computing the Shubert function, this algorithm is shown to maintain good optimization capabilities even in the presence of multiple local extrema.
3) The localization of partial discharges under gradient oil temperatures was simulated within the oil tank. Experimental results demonstrate that utilizing the CFA-PSO algorithm based on a non-fixed equivalent acoustic velocity effectively mitigates the influence of oil temperature on partial discharge localization. Moreover, the maximum localization error without obstruction does not exceed 55 mm, while under winding diffraction with a core, it does not exceed 100 mm. This provides technical guidance for practical transformer partial discharge localization during operation.
4) This technology can be put into on-site transformer partial discharge monitoring, combined with the transformer heating status and fault location under gradient temperature, to provide better technical support for transformer safety online monitoring, so as to conduct more in-depth research on temperature as an influencing factor in the future.
The original contributions presented in the study are included in the article/supplementary material, further inquiries can be directed to the corresponding author.
RY: Writing–original draft. ZZ: Writing–review and editing.
The author(s) declare that no financial support was received for the research, authorship, and/or publication of this article.
The authors declare that the research was conducted in the absence of any commercial or financial relationships that could be construed as a potential conflict of interest.
All claims expressed in this article are solely those of the authors and do not necessarily represent those of their affiliated organizations, or those of the publisher, the editors and the reviewers. Any product that may be evaluated in this article, or claim that may be made by its manufacturer, is not guaranteed or endorsed by the publisher.
PD, Partial discharge; TDOA, Time Difference of Arrival; PSO, Particle swarm optimization; FA, firefly algorithm; CFA-PSO, Chaotic firefly particle swarm algorithm; UHF, Ultra-high frequency; AE, Acoustic electric.
Antony, D., and Punekar, G. S. (2018). Noniterative method for combined acoustic-electrical partial discharge source localization. IEEE Trans. Power Deliv. 33 (4), 1679–1688. doi:10.1109/tpwrd.2017.2769159
Besharatifard, H., Hasanzadeh, S., Heydari-an-Forushani, E., and Muyeen, S. M. (2022). Acoustic based localization of partial discharge inside oil-filled trans-formers. IEEE Access 10, 55288–55297. doi:10.1109/access.2022.3177603
Cai, Y., Yuan, W., Zhang, X., Yang, Y., Wu, J., and Li, J. (2021). Ultra-high frequency self-sensing detection method for transformer partial discharge. High. Volt. Eng. 47 (6), 2041–2050. doi:10.13336/j.1003-6520.hve.20201164
Guerra, O. J., Tejada, D. A., and Reklaitis, G. V. (2016). An optimization framework for the integrated planning of generationand transmission expansion in interconnected power systems. Appl. Energy 170, 1–21. doi:10.1016/j.apenergy.2016.02.014
Guo, X. (2022). A review of transformer partial dis-charge research. Audio Eng. 46 (2), 114–117. doi:10.16311/j.audioe.2022.02.027
Jia, J., Tao, F., Yang, Q., Fu, H., Yang, J., Lu, Y., et al. (2022). Research on partial discharge location method of transformer un-der Complex multipath propagation. Proc. CSEE 42 (14), 5338–5348. doi:10.13334/j.0258-8013.pcsee.210283
Jin, N. (2020). Study on boundary conditions of distribution parameters of oil-immersed transformer. Kunming University of Science and Technology.
Junyi, C. A. I. (2021). Research on acoustic emission localization method of transformer partial discharge. Chengdu, China: Southwest Jiaotong Uni-versity.
Li, J., Han, X., Liu, Z., and Li, Y. (2015). Review of partial discharge detection technology in electrical equipment. High. Volt. Technolo-gy 41 (8), 2583–2601. doi:10.13336/j.1003-6520.hve.2015.08.011
Liang, H. (2014). Research on positioning method of successive approximation for partial discharge source based on semidefinite relaxation. Chongqing, China: Chongqing University, 55–77.
Liu, H. (2014). Actualities and perspectives of techniques of detection and localization of partial dis-charges in power transformers adopting ultrasonic methods. J. Chongqing Univ. Technol. Nat. Sci. Ed. 28 (7), 71–79.
Ma, G., Zhou, H., Liu, Y., Gao, S., Xia, Y., Zhang, W., et al. (2020). Optical fiber ultrasonic detection technology for partial discharge in power transformer and new multiplexing method. High. Volt. Eng. 46 (5), 1768–1780. doi:10.13336/j.1003-6520.hve.20200515032
Mehrpooya, M., Mirmotahari, S. R., Ghafoorian, F., Karimkhani, M., and Ganjali, M. R. (2024). Investigation of a packed bed energy storage system with different PCM configurations and heat transfer enhancement with fins using CFD modeling. Chem. Pap. 78, 2453–2467. doi:10.1007/s11696-023-03251-y
Qi, W., Li, J., Chen, B., Yuan, J., and Zhong, Y. (2015). Ultrasonic propagation characteristics of transformer based on COMSOL. Trans. China Electrotech. Soc. 30 (S2), 195–200. doi:10.19595/j.cnki.1000-6753.tces.2015.s2.029
She, C., Zheng, J., He, J., Chen, H., and Ma, Z. (2021). Ultrasonic positioning method for transformer partial discharge based on time difference screening and ABC secondary optimization. High. Volt. Technolo-gy 47 (08), 2820–2827. doi:10.13336/j.1003-6520.hve.20200146
Shen, K., and Sun, H. (1981). Finite element method in engineering acoustics. Acta Acoust. Sin. (4), 249–259. doi:10.15949/j.cnki.0371-0025.1981.04.006
Shi, C., Ma, G., Mao, N., Zhang, Q., Li, C., Li, Z., et al. (2017). Study on fiber ultrasonic location technology of partial dis-charge in transformer based on wavelength division multiplexing/time-division multiplexing technology. Proc. CSEE 37 (16), 4873–4879+4913.
Si, W., Fu, C., and Yuan, P. (2019). An integrated sensor with AE and UHF methods for partial discharges detection in transformers based on oil valve. IEEE Sensors Lett. 3 (10), 1–3. doi:10.1109/lsens.2019.2944261
Song, P., Lu, Q., Zhang, Q., Fu, C., He, L., Yuan, P., et al. (2020). Combined intrusive PD detection technology with UHF and AE methods for transformer. 56(03):67–71. doi:10.13296/j.1001-1609.hva.2020.03.010
Su, Z., Yu, R., and Zhang, Z. (2024). Trans-former partial discharge location based on multiple polynomial results-double grid search. High. Volt. Technol. 1–11. doi:10.13336/j.1003-6520.hve.20230386
Wang, Y. B., Chang, D. G., Fan, Y. H., Zhang, G. J., Zhan, J. Y., Shao, X. J., et al. (2018). Acoustic localization of partial discharge sources in power transformers using a particle-swarm-optimization-route-searching algorithm. IEEE Trans. Dielectr. Electr. Insulation 24 (6), 3647–3656. doi:10.1109/tdei.2017.006857
Weiqiang, Y. A. O., Wenrong, S. I., Jiaming, L. Ü., et al. (2020). Review on EFPI fiber-based ultrasonic sensors andits potentially partial discharge detection ap-plication. High. Volt. Eng. 46 (6), 1855–1866.
Yang, H. (2011). Study on the mechanism and propagation characteristics of ultrasonic wave excitation by partial discharge in large transformer. Changsha: Changsha University of Science and Technology.
Yanqing, L. I. (2003). Study on detection of partial discharge of power transformer by ultrasonic method. Beijing: North China Electric Power University.
Yingjie, X., Zhang, C., Dong, M., et al. (2023). Re-search on design and fast positioning method of acousto-electric combined partial discharge positioning array based on Monte Carlo simulation. Power Syst. Technol. 47 (07), 3029–3039.
Keywords: transformer, partial discharge, gradient oil temperature, acoustic and electric joint positioning, velocity
Citation: Yu R and Zhang Z (2024) Transformer partial discharge location technology based on gradient oil temperature. Front. Energy Res. 12:1428012. doi: 10.3389/fenrg.2024.1428012
Received: 05 May 2024; Accepted: 12 July 2024;
Published: 31 July 2024.
Edited by:
Hui Wan, University of Colorado Colorado Springs, United StatesReviewed by:
Farzad Ghafoorian, University of Colorado Colorado Springs, United StatesCopyright © 2024 Yu and Zhang. This is an open-access article distributed under the terms of the Creative Commons Attribution License (CC BY). The use, distribution or reproduction in other forums is permitted, provided the original author(s) and the copyright owner(s) are credited and that the original publication in this journal is cited, in accordance with accepted academic practice. No use, distribution or reproduction is permitted which does not comply with these terms.
*Correspondence: Zhousheng Zhang, enpzaGVuZzQxN0AxNjMuY29t
Disclaimer: All claims expressed in this article are solely those of the authors and do not necessarily represent those of their affiliated organizations, or those of the publisher, the editors and the reviewers. Any product that may be evaluated in this article or claim that may be made by its manufacturer is not guaranteed or endorsed by the publisher.
Research integrity at Frontiers
Learn more about the work of our research integrity team to safeguard the quality of each article we publish.