 Jiang Li
 Xinlong Yao
 Bo Liu
94% of researchers rate our articles as excellent or good
Learn more about the work of our research integrity team to safeguard the quality of each article we publish.
Find out more
ORIGINAL RESEARCH article
Front. Energy Res., 29 July 2024
Sec. Smart Grids
Volume 12 - 2024 | https://doi.org/10.3389/fenrg.2024.1427986
This article is part of the Research TopicAdvancements in Power System Condition Monitoring, Fault Diagnosis and Environmental CompatibilityView all 16 articles
The accurate identification of low-voltage distribution substation topology plays a crucial role in research applications such as line loss management, fault location, imbalance correction, and intelligent operation and maintenance of substations. In response to the challenges posed by the large scale of users and the complex connection relationships in low-voltage distribution substations, which complicate the identification of their topology, a method for identifying low-voltage distribution substation topology based on user profiling technology is proposed. This method is supported by big data technology and introduces the concept of user profiling into the research of substation topology identification. Firstly, by deeply studying the theoretical knowledge of the relationship between the supply of distribution transformers and the power consumption of substation users, as well as the voltage similarity, we establish the feature labels for electricity coefficient and voltage similarity. Then, we use the continuous relaxation method and branch-and-bound method to solve the electricity coefficient matrix; and use the Gaussian kernel function to solve the voltage similarity matrix. Finally, by constructing a comprehensive attribution matrix using the electricity coefficient matrix and the voltage similarity matrix, employing a convolutional neural network to cluster and solve the comprehensive attribution matrix, outputting user-area attribution information, forming user-area attribution profiles, and completing the identification of area attribution relationships in low-voltage distribution systems. Simulation results demonstrate that the proposed method not only effectively identifies the area information to which low-voltage users belong but also discerns the connection relationships between users and area transformers.
Currently, there is relatively low academic attention on the topology identification of low-voltage distribution systems. This field lacks systematic theoretical research and practical foundations, and has not yet formed a complete identification framework and process. From a mathematical perspective, the topology identification problem can be considered as an extension and expansion of system state estimation or network topology identification problems. Currently, topology identification research mainly adopts the following two methods:
The first approach involves utilizing clustering algorithms to achieve topology identification based on the correlation between distribution transformers in substations and the voltages of their downstream users. The method proposed in reference (Cui et al., 2021) presents an approach for household transformer relation identification based on voltage feature extraction and clustering algorithms. Initially, an adaptive piecewise aggregate approximation method is employed to extract voltage curve features. Subsequently, an improved DBSCAN algorithm is utilized to identify households with mismatched relations, thereby circumventing the challenge of distinguishing curve similarities and ensuring identification accuracy. However, this approach entails a higher computational complexity. References (Zhang et al., 2021) initially employ the Pearson correlation coefficient method to calculate the voltage similarity between distribution transformers and users, and subsequently utilize clustering algorithms to derive topology identification results. However, this method heavily relies on high granularity data. Reference (Zeng et al., 2021) proposes a method to identify topology by correlating the electricity usage between users and distribution transformers, utilizing an improved fuzzy clustering method to identify the correlation between substation voltages and users. Reference (Peng et al., 2023) proposes the transformation of voltage curves into discrete sequences. It employs the entropy weighting method to combine Euclidean distance with morphological distance, forming the Euclidean morphological distance. Subsequently, the nearest neighbor propagation clustering algorithm is utilized to achieve identification of users within a substation and differentiation of phases within the substation. The drawback is that during the discretization of the voltage, a portion of the measurement information may be lost, leading to potentially inaccurate identification results. Reference (Keming et al., 2021) introduces a substation topology identification method based on dynamic time warping distance and clustering analysis. It measures the similarity between voltage curves of users using the dynamic time warping (DTW) distance between voltage sequences. Then, clustering analysis is applied to the voltage curves of users to identify the low-voltage substation to which they belong. Reference (Su et al., 2021) addresses the issue of missing or abnormal household transformer relations in the low-voltage distribution substation topology. It proposes a household transformer relation identification method based on Derivative Dynamic Time Warping (DDTW) algorithm and Density-Based Spatial Clustering of Applications with Noise (DBSCAN) algorithm. This method not only analyzes voltage time sequences with different and unequal time intervals but also remains insensitive to missing or abnormal voltage data, thereby reducing the impact of clustering algorithm parameters on clustering results. Reference (Song et al., 2022) initially improves the dynamic programming method for calculating voltage similarity and then enhances clustering accuracy and efficiency through a two-stage clustering approach. This improvement aims to increase the accuracy of identification results. However, the drawback lies in the complex algorithm design and the high computational complexity associated with it. Reference (Ren et al., 2023) introduces a dynamic household transformer relation identification method based on Bayesian inference and spectral clustering. This method not only enables dynamic identification of household transformer relations based on the latest voltage data along the temporal axis but also enhances the robustness of identification in scenarios involving data gaps or nodes entering or exiting the substation.
The second approach involves utilizing data-driven learning algorithms to achieve topology identification. Reference (Zhang et al., 2022) proposes a topology recognition method based on smart meter end-user data, providing a probabilistic representation for all possible LVDG topologies. The paper introduces an algorithm based on search to generate candidate topologies, and then proposes the Bayesian information criterion to describe the accuracy of these candidate topologies. However, the search process is not time-controlled. In reference (Zhou et al., 2022), a topology identification algorithm is presented, which combines data preprocessing based on voltage characteristics with multidimensional prior knowledge. It considers prior knowledge of voltage-related characteristics and introduces a knowledge-driven identification model to identify topology errors and authentic topologies of users. However, a significant shortcoming of this method is that the final identification results are particularly influenced by prior knowledge. Reference (Zhao et al., 2022) proposes a terminal customer data-driven approach that utilizes on-site data obtained from advanced metering infrastructure to identify transformer-customer relationships in low-voltage distribution grids. A drawback is its high requirement for both data quality and quantity. In reference (Yang et al., 2021), the utilization of a BP neural network is proposed to train collected voltage sample data by class, followed by feature extraction using the trained data to perform cluster analysis, enabling accurate identification of user substation information. Reference (Yang et al., 2022) introduces a line loss evaluation index, which utilizes bidirectional long short-term memory networks and spatial convolutional networks to re-identify abnormal users in substation information, yielding satisfactory identification results, yet heavily reliant on the accuracy of measurement data. Reference (Xiaodong et al., 2020) initially conducts feature extraction on data using deep learning algorithms, subsequently calculating the correlation between users and distribution transformers through Pearson correlation coefficients, enabling synchronous identification of users’ substation affiliation and phase distinction. Reference (Gao et al., 2023) presents a data-driven machine learning approach for identifying feeder-transformer relationships in distribution networks. By applying a multi-feature fusion method to extract additional features from feeders and combining them with correlation coefficients to create a feature matrix, machine learning algorithms are then applied to compute results. The drawback is that the integration of multiple features is challenging and the required computation time is relatively long. In reference (Li et al., 2023), a method for low-voltage distribution network topology identification based on unsupervised learning and graph theory is proposed. Initially, the tSNE-DBSCAN-LLE algorithm is used to identify the four-level topology information, followed by the simple generation of topology graphs using the identified information, thereby completing the topology identification of the low-voltage distribution network.
The aforementioned topology identification methodologies rely solely on individual node voltage or power consumption data for topology discernment. However, in practical scenarios, node voltage values obtained from meters associated with a single transformer may exhibit considerable discrepancies, whereas those derived from meters linked to distinct transformers may demonstrate strikingly similar results. Consequently, the advancement of distribution grid control techniques faces challenges in achieving accurate identification outcomes solely through correlation-based analyses of voltage temporal measurements or power consumption data.
Reference (Chen et al., 2022; Yinjie et al., 2024) have proposed a method for identifying the relationship between low-voltage distribution transformers considering two types of measurement data. Reference (Chen et al., 2022) introduces an electricity-transformer relationship identification method based on voltage fluctuation feature clustering and power summation relationships. It involves extracting multidimensional fluctuation parameters of adjacent substation voltages and customer voltages, reducing the dimensionality of high-dimensional voltage fluctuation features using the t-distributed stochastic neighbor embedding (t-SNE) algorithm, and ultimately identifying the topological relationships in the distribution network based on the summation relationship between virtual user power data and concentrators using the least squares method. Reference (Xu et al., 2022), on the other hand, initially merges adjacent users based on geographical location information and then employs the Gaussian mixture model (GMM) clustering algorithm to partition voltage time series data. The user partitioning results serve as the initial values for the next iteration. Subsequently, it establishes a convolutional identification model for the association between distribution transformers and users based on energy supply-demand balance to achieve the identification of the relationship between low-voltage distribution substations and transformers. Reference (Yinjie et al., 2024) proposes a photovoltaic temporal power convolution model based on the balance relationship between substation transformers and user power. Initially, it establishes a multivariate linear regression model for the low-voltage transformer-user relationship with a high proportion of photovoltaic usage based on the user-transformer power balance relationship. It also introduces an optimization objective function for voltage clustering based on Gaussian mixture models to achieve transformer-user relationship identification. However, the methods mentioned in the above literature do not simultaneously consider the comprehensive use of voltage and power consumption data for topology identification.
Therefore, this paper proposes a topology identification method based on user profiling technology (Chen, 2021; Wu et al., 2020). Firstly, by establishing features labeled with electricity consumption coefficients and voltage similarity, the electricity consumption coefficient matrix is solved using the continuous relaxation method and branch-and-bound method, while the voltage similarity matrix is solved using the Gaussian kernel function. Finally, a comprehensive attribution matrix is constructed based on the electricity consumption coefficient matrix and the voltage similarity matrix to form user substation attribution profiles. A convolutional neural network is employed to cluster and solve the comprehensive attribution matrix, outputting user substation attribution information and completing the identification of substation attribution relationships in low-voltage distribution systems. Through simulation verification in practical systems, the proposed method effectively identifies the substation information to which low-voltage users belong and the connection relationships between users and substation transformers.
The rest of this paper is organized as follows. Section 2 provides a detailed exposition of the conceptual framework for topology identification based on user profiling. Section 3 elucidates the specific contents of user profiling feature labels, encompassing significant features such as electricity coefficient and voltage similarity. Section 4 delves deeply into the process and methodologies involved in establishing user substation attribution profiles, this culminates in the formation of comprehensive user substation attribution profiles. Section 5 provides numerical simulations that demonstrate the performance of the introduced methods.
Based on the concept of user profile, the identification approach of topology structure is illustrated in Figure 1. As is well known, the affiliation of users to distribution transformers (DTs) is closely related to features such as the electricity consumption pattern and voltage similarity of users. The concept of user profile is extended to the research of topology structure identification. Based on the voltage and electricity consumption data of low-voltage distribution transformer users, an analysis is conducted, followed by the development of feature label models and the study of user profiles. Firstly, the voltage and electricity consumption data of loads are abstracted to describe the features that can characterize the affiliation to distribution transformers. Then, a label system representing the affiliation characteristics of residential loads to distribution transformers is established, generating user affiliation profiles, and ultimately accomplishing the identification of user affiliations to distribution transformers.
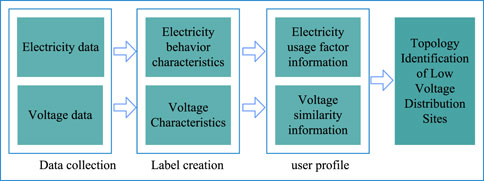
Figure 1. Idea of topology identification based on user profiling.
The essence of user profiles lies in the study of user behavior, where feature labels serve as highly refined identifiers of user behavior. The core task of constructing user profiles is to assign “labels” to users. The label model is constructed based on the influencing factors of topology structure identification, which include feature labels for electricity consumption coefficient and voltage similarity classification.
Considering the issue of electricity matching, a model is established for the relationship between distribution transformers and users, using the distribution system depicted in Figure 2 as an example. As illustrated in Figure 2, distribution transformers and all users under their respective substations follow the principle of electricity balance. This means that within a certain period, the electricity supplied by a distribution transformer equals the total electricity consumed by all connected users in its substation (assuming negligible losses in the lines). It is well-known that due to factors such as occupation, age, and consumer psychology, different users have different electricity consumption habits and behaviors. Therefore, their electricity consumption varies during different time periods. Hence, this chapter can utilize the supplied and consumed electricity by distribution transformers and users under their substations during multiple time periods to infer their connection relationships.
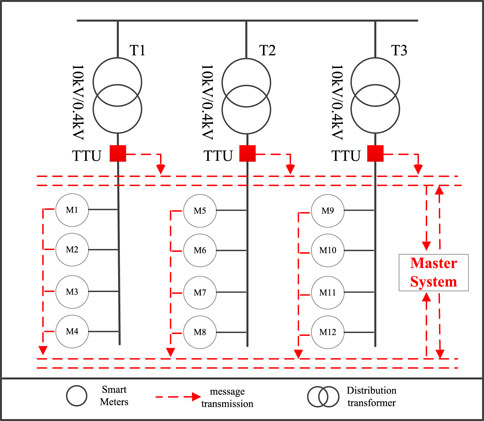
Figure 2. Low-voltage distribution system structure.
Using Table 1 as a simple case study, during the time period from 1:00 to 2:00, the electricity consumption measured by meters 1, 2, and three exactly matches the electricity supplied measured at distribution transformer 1, while the electricity consumption measured by meters 4 and 5 exactly matches the electricity supplied measured at distribution transformer 2. This indicates that meters 1, 2, and three belong to substation 1, while meters 4 and 5 belong to substation 2. This consistency extends beyond just the 1:00–2:00 time period; it holds true for the 2:00–3:00 time period as well. Thus, even if occasional identification errors occur due to measurement or calculation inaccuracies within a single time period, with a large amount of sampled data input, these errors can be promptly corrected due to the variability of the data.

Table 1. Measured data of distribution transformer power supply and customer power consumption.
This chapter begins by utilizing the measured electricity data from distribution transformer nodes and user nodes to formulate electricity measurement balance equations. In a low-voltage distribution system with m distribution transformers and n users, there should exist the following summation relationship between the metered electricity at transformer interfaces and the electricity consumed by each user:
Where,
According to Eq. 1, the following system of balance equations for electricity between transformers and users can be established as shown in Eqs 2–5:
Where, Y represents the electricity consumption sequence over H hours for m transformer interface meters. A represents the matrix of electricity consumption coefficients to be solved. X represents the electricity consumption sequence of n users within the substation to be analyzed over H hours. m represents the number of substations. n represents the number of users.
It should be noted that a unique connection must exist between low-voltage distribution transformers and users. A terminal user meter cannot be connected to two distribution transformers simultaneously. Therefore, the constraint condition is established as shown in Eq. 6.
Therefore, considering measurement noise, the transformer-user measurement equation based on electricity balance can be expressed as Eqs 7, 8.
Where,
Eq. 8 ensures that each meter is only connected to one distribution transformer. By solving for the electricity consumption coefficient matrix, it can determine the association between distribution transformers and users.
Given the measured quantities Y and X, an estimation equation can be established based on the least squares method to solve for the electricity consumption coefficients, as shown in Eq. 9:
Note that to ensure the estimation equation has a solution, it is necessary to ensure that the number of available hours for electricity data collection, H is greater than the number of users in the substations to be analyzed n.
Voltage similarity refers to the resemblance in electrical distance and voltage fluctuations among users within the same substation. Conversely, for users across different substations, there exists a greater electrical distance and larger disparities in voltage fluctuations. Despite occasional subtle differences, this paper advocates for employing advanced clustering techniques to utilize voltage similarity as an indicator for determining user substation affiliations.
In this section, voltage similarity is obtained using a Gaussian kernel function [28]. The definition of the Gaussian kernel function is given by Eq. 10:
Where, x and y represent two vectors, and
Therefore, the voltage data similarity between nodes i and j at time t can be calculated using the Gaussian kernel function as shown in Eq. 11:
Where,
The proposed method involves utilizing a convolutional neural network (CNN) classification approach to perform clustering analysis on the electricity consumption coefficient feature labels and voltage similarity feature labels mentioned above, thereby further establishing user substation affiliation profiles. The overall analysis method comprises the following four steps.
Step 1: Analysis of the values of the various indicators
1. Electricity consumption coefficient feature label
By solving Eq. 9, we can obtain the electricity coefficient matrix, and organizing this matrix yields the electricity coefficient feature labels. The problem described by Eq. 9 is mathematically known as a Mixed Integer Programming (MIP) problem. It is important to note that as the dimensionality of integer variables increases, the search space of MIP problems also grows, leading to a sharp increase in computational complexity for solving MIP problems. This may result in a significant increase in algorithm runtime, and in some cases, make certain problems unsolvable within a reasonable timeframe. This paper first employs a continuous relaxation method to relax the binary variables, and then utilizes the branch-and-bound method to round the continuous variables.
The Branch and Bound Method is an iterative search technique that utilizes selecting different branching variables and branching subproblems for exploration. Its main idea is to search within the feasible region of the relaxed problem to find integer solutions that can optimize the objective value. This method mainly consists of the following two steps.
(1) Branching: When the optimal solution of the relaxed form of an integer programming problem fails to satisfy the integer constraints, it is split into two branching subproblems. The feasible solution space of these two subproblems covers all feasible solutions of the original integer programming problem. Subsequently, each branching subproblem can generate its own sub-branching subproblems until the optimal solution of the integer programming problem is found.
(2) Bounding: During the branching process, if a derived problem happens to find a feasible solution to the integer programming problem, then the objective function value of that solution becomes a “bound,” which can serve as a guiding criterion for solving other branching subproblems. This “bound” can be replaced by a more optimal value.
The main steps for solving the electricity consumption coefficient are as follows.
(1) Firstly, relax problem (Eq. 9) using a continuous relaxation method, then solve the relaxed linear programming problem (Eq. 12) using CVX to obtain a continuous solution and the lower bound of the problem.
(2) Branching on a single variable
(3) Prune the branching subproblems based on pruning principles. The pruning principles are as follows: Branching subproblems without feasible solutions should be pruned and branching subproblems with an optimal value exceeding the original upper bound should be pruned.
(4) Check if the discrete sequence is complete. If it is complete, exit the loop and output the solved user coefficients. If it is not complete, proceed to Step 2 to continue solving.
By solving the electricity coefficient matrix, we can obtain the electricity characteristic coefficient labels at time t. As shown in Eq. 13. The labels in the electricity coefficient characteristics are logical values, indicating whether users are connected to the corresponding substation. If connected, the value is 1; if not, the value is 0.
2. Voltage similarity feature label
To solve the voltage similarity between users using Eq. 11 and establish the voltage similarity matrix at time t, we utilize this type of characteristic label to represent the voltage similarity
Step 2: Construct the comprehensive attribution feature matrix
In the comprehensive attribution feature matrix L, each element can describe the voltage similarity between nodes and the electricity coefficient of users.
Step 3: Convolutional Neural Network Clustering Method
Convolutional Neural Network (CNN) are powerful deep learning architectures that are particularly well-suited for tasks such as image classification and object recognition. The specific structure typically includes convolutional layers, pooling layers, and other specialized neural network layers, as illustrated in Figure 3.
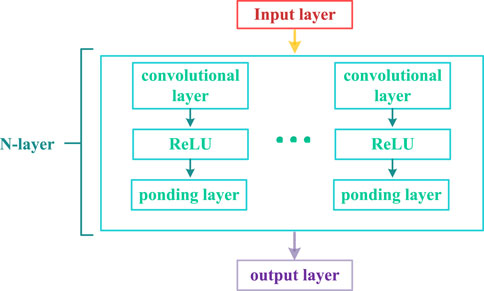
Figure 3. Structure of N-layer convolutional neural network.
A total of five steps are required for user station attribution classification using Convolutional Neural Network.
(1) Place the obtained comprehensive attribution feature matrix data into the input layer.
(2) Feature extraction can be performed on the input comprehensive attribution feature matrix data through convolutional operations. Convolution involves each neuron in the convolutional layer convolving with a portion of the input comprehensive attribution feature matrix data, thereby generating a feature representation of the data.
(3) Utilize the ReLU activation function, which outputs 0 when the input is less than 0, and outputs the input itself when the input is greater than 0. The purpose of employing the activation layer is to introduce non-linearity to the results of matrix operations.
(4) Pooling layer performs down sampling on the comprehensive attribution feature matrix data after non-linear activation to reduce the number of parameters, prevent overfitting, and enhance the processing speed of the model.
(5) Obtain clustering results and output the classification results, which represent the attribution information of users to the corresponding power distribution area.
For ease of visually presenting the profiling of user-substation affiliations, this section first generates comprehensive profiles based on the integrated affiliation feature matrix. Subsequently, the results of two types of feature labels for users are visualized. The electricity coefficient feature labels denote the connection between users and substations, while the voltage similarity feature labels are represented by substation numbers, indicating the affiliation substation for users. The presentation method is illustrated in Figure 4.
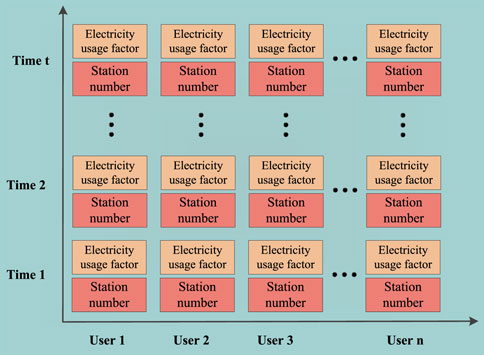
Figure 4. Visualization of user station attribution profiles.
This article conducts simulation experiments using data from 125 electricity meters across 4 substations in a city in China. Substations 1, 2, 3, and 4 have 35, 30, 32, and 28 m respectively. Meters 1–35 belong to substation 1, 36–65 belong to substation 2, 66–97 belong to substation 3, and 98–125 belong to substation 4. The analyzed data includes energy consumption and voltage data for all meters, sampled every hour, over a continuous period of 1 month. This chapter selects complete data from a single day for simulation. The voltage data is shown in Table 2, and the topology structure is illustrated in Figure 5.
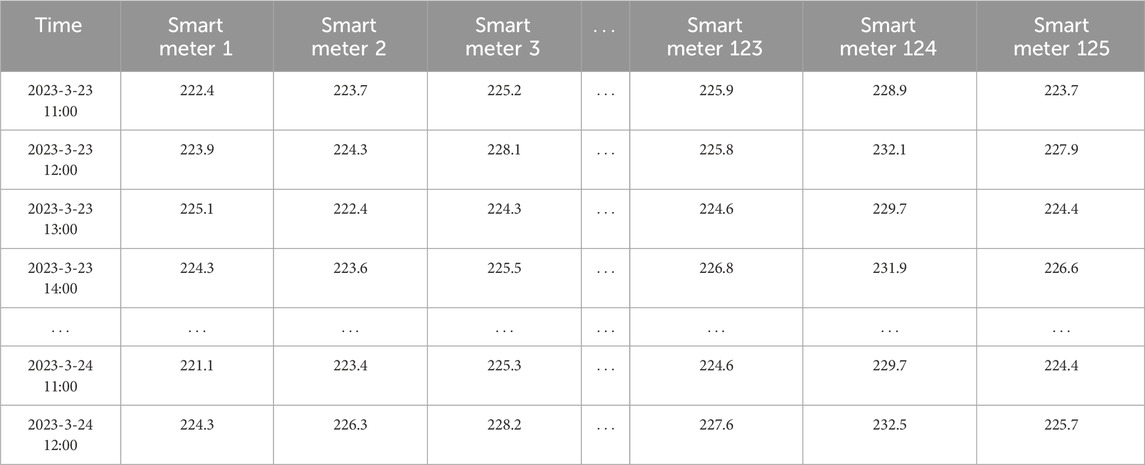
Table 2. Voltage measurement data for all smart meters.
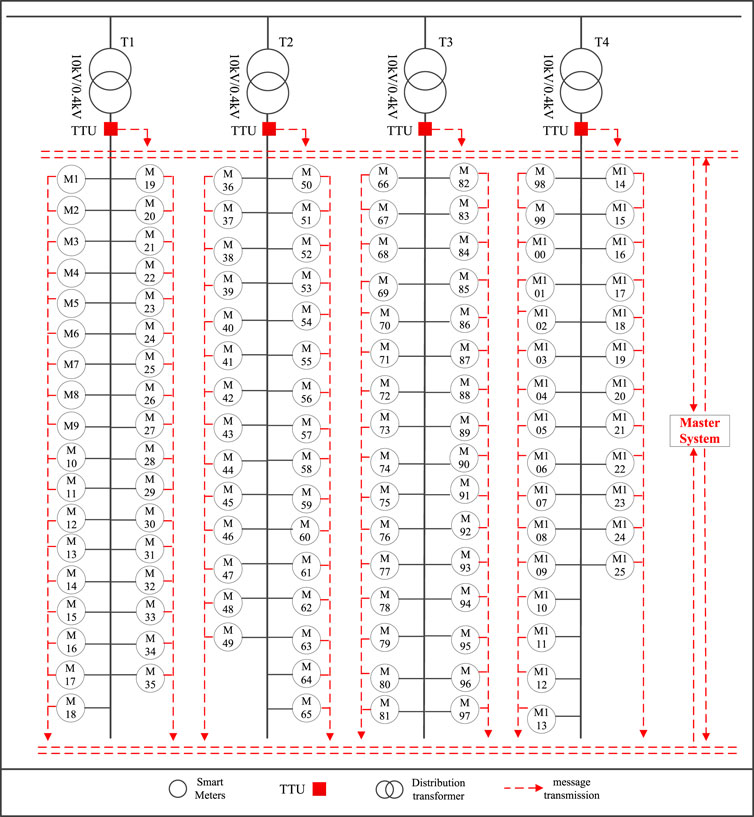
Figure 5. Network topology diagram of low-voltage distribution substation area.
To validate the identification effect of the user profiling method proposed in this paper for determining user substation affiliation, this section is divided into three parts for verification. Firstly, the identification effect of two feature labels is discussed separately, and the factors influencing the identification effect of each feature label are discussed respectively. Finally, the identification effect of user substation affiliation profiling on low-voltage distribution substation topology is analyzed.
(1) To validate the identification effect of the electricity consumption coefficient feature label on topology relationships and analyze the influencing factors.
To validate the identification effect of the electricity consumption coefficient feature label on topology relationships, this paper employs the Round half up method and the Branch-and-bound method to solve the electricity consumption coefficient and compares the effectiveness of these two methods. The electricity data from Substation 1 and Substation two are used to respectively verify the effectiveness of the rounding method and the branch-and-bound method in solving the electricity consumption coefficient. Specifically, the data from Substation 1 is used to validate the effectiveness of the Round half up method, while the data from Substation two is used to validate the effectiveness of the Branch-and-bound method.
As shown in Figure 6, there is a significant error between the electricity consumption coefficients obtained using the continuous relaxation method and the rounding method, compared to the true values, with an error rate of nearly 30%. Additionally, Figure 7 reveals that there is a considerable error in the fluctuation curve of the supply volume of Substation 1’s distribution transformer compared to the total electricity consumption of all users within the substation.
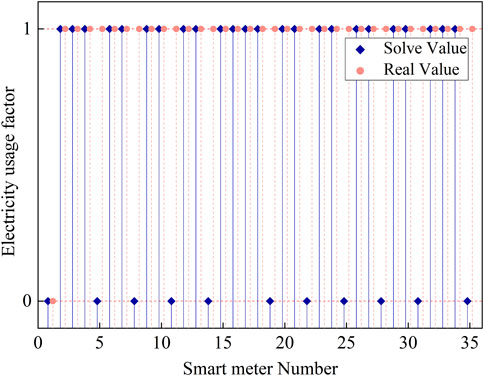
Figure 6. Comparison of solved and true values of power usage coefficient for station 1
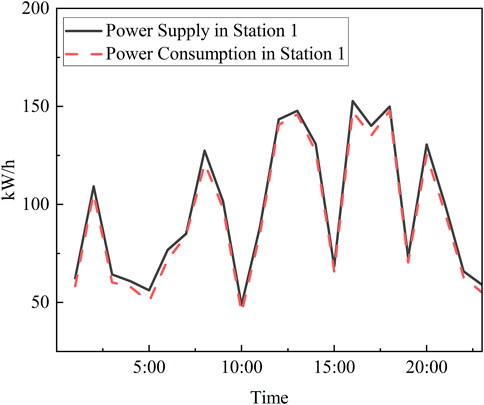
Figure 7. Energy fluctuation curve of station 1
In contrast, Figure 8 demonstrates that the error between the electricity consumption coefficients obtained using the continuous relaxation method and the branch-and-bound method and the true values is relatively small, with an error rate of only 7%. Moreover, Figure 9 shows that the fluctuation curve of the supply volume of Substation 2’s distribution transformer is very close to the total electricity consumption of all users within the substation. Therefore, the effectiveness of using the continuous relaxation method and the branch-and-bound method to solve the electricity consumption coefficients is superior to using the continuous relaxation method and the rounding method. The results indicate that using the continuous relaxation method and the branch-and-bound method to solve the electricity consumption coefficients not only improves the efficiency of the solution but also ensures that the accuracy is not compromised. However, this conclusion is limited to the case where only the electricity data from Substation 1 is involved in solving the electricity consumption coefficients.
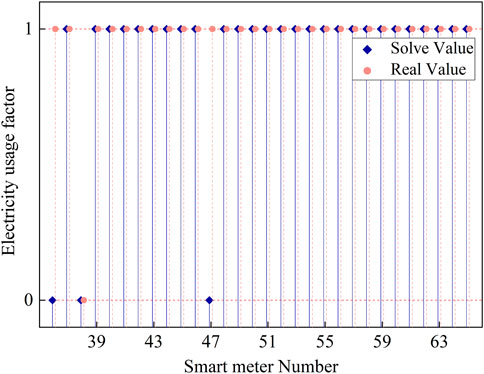
Figure 8. Comparison of solved and true values of power usage coefficient for station 2
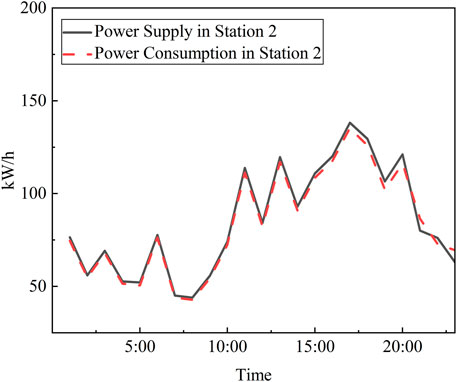
Figure 9. Energy fluctuation curve of station 2
To verify the impact of the amount of electricity data on the solution of electricity consumption coefficients using the branch-and-bound method, this paper conducts validation analysis using the electricity data from Substation three and Substation 4. When solving the electricity consumption coefficients for Substation three using the continuous relaxation method and the branch-and-bound method, the electricity data from Substation 4 are not included. Conversely, when solving the electricity consumption coefficients for Substation 4 using the continuous relaxation method and the branch-and-bound method, the simultaneous electricity data from Substation three are included. Clearly, once the data from one substation are mixed with the electricity data from another substation, the accuracy of the identification decreases, as shown in Figure 10.
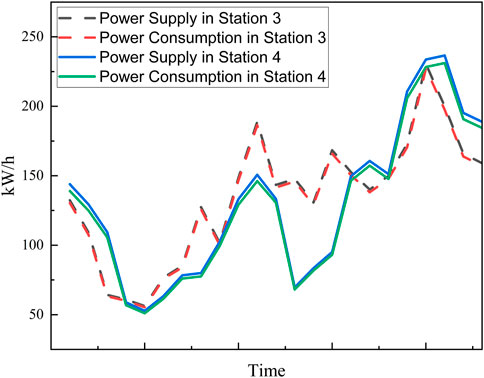
Figure 10. Energy fluctuation curve of station three and station 4
In Figure 10, the fluctuation of the supply volume of Substation 3’s distribution transformer is consistent with the total electricity consumption of all users within the substation, with almost no deviation, and the effect of solving the electricity consumption coefficients is also very good, with an error rate below 6%. Undoubtedly, the fluctuation of the supply volume of Substation 4’s distribution transformer exhibits a significant deviation from the total electricity consumption of all users within the substation, and the effect of solving the electricity consumption coefficients is poor, with an error rate reaching 13%. This is because, over long time scales, there is a certain probability that the electricity data will show similarities, and this makes it impossible for the branch-and-bound method to make a correct choice, leaving only a 50% chance of selecting the correct electricity consumption coefficient.
To further investigate the impact of the amount of electricity data on the solution of electricity consumption coefficients, we selected four different sets of data for testing. The first set of data only includes the electricity data from Substation 1. The second set includes the electricity data from Substations 1 and 2. The third set includes the electricity data from Substations 1, 2, and 3. The fourth set includes the electricity data from Substations 1, 2, 3, and 4. Regardless of how many substations’ electricity data are included, we only solve for the electricity consumption coefficients of Substation 1.
Additionally, to eliminate errors caused by random factors, we conducted 100 repeated experiments and took the average of the results from these 100 experiments. The accuracy rates of the solutions using the Round half up method and the Branch-and-bound method are shown in the following Table 3.
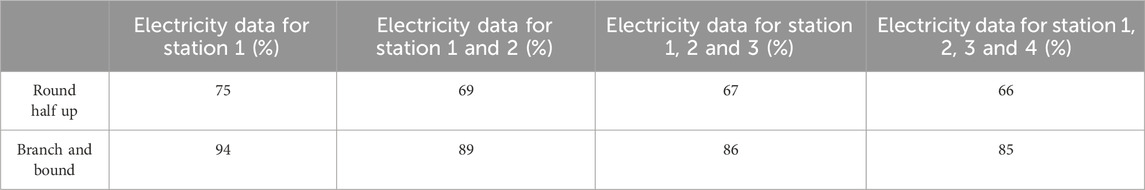
Table 3. Effect of varying amount of power data on correctness rate.
From the table above, it can be seen that regardless of whether it is the rounding method or the branch-and-bound method, as the amount of substation data increases, the accuracy rates of solving the electricity consumption coefficients using both methods gradually decrease, eventually stabilizing at 66% and 85%, respectively. However, it is evident that the accuracy rate of the Branch and bound method is approximately 20% higher than that of the round half up method. This further indicates that the branch-and-bound method selected in this paper performs relatively well.
(2) To verify the effectiveness of voltage similarity feature labels in identifying topological relationships and analyze the influencing factors.
To verify the effectiveness of voltage similarity feature labels in identifying topological relationships, this paper employs the K-means clustering method and the CNN method to cluster the voltage similarity feature labels. The clustering performance of these two methods is then compared. The voltage sequence data from Table 2 is used for simulation verification, and the classification results are shown in Figures 11, 12.
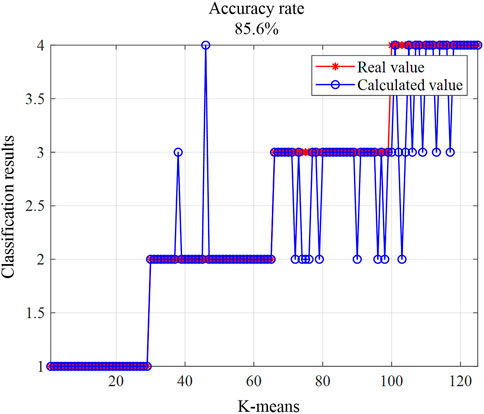
Figure 11. K-means classification accuracy demonstration.
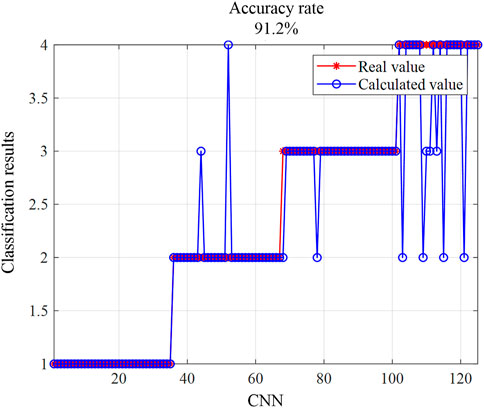
Figure 12. CNN classification accuracy demonstration.
From Figures 11, 12, it can be seen that the accuracy of the CNN method is only 91.2%, while the accuracy of the K-means clustering method is only 85.6%. Although the CNN method shows a higher accuracy, both methods do not achieve very high accuracy when used to classify solely based on voltage similarity feature labels.
Considering the impact of different parameter values on the experimental results and in order to analyze the influencing factors on the classification of voltage similarity feature labels, this paper conducts simulation verification with different values for the parameter
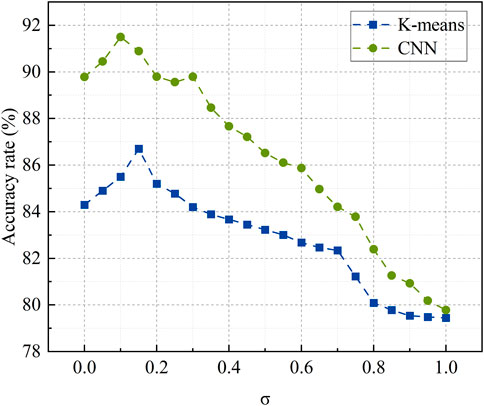
Figure 13. Effect of different values of
It can be seen that when the parameter
(3) To verify the topological identification effectiveness of user substation allocation profiles
After discussing the identification effects of the two feature labels separately, this section utilizes voltage data and electricity consumption data from four substations to calculate the electricity coefficient feature labels and voltage similarity feature labels. Then, by integrating the electricity coefficient feature labels and voltage similarity feature labels, user substation allocation profiles are constructed.
Using a CNN method, clustering is performed on the two types of labels to obtain the information on which substation each user belongs to, thereby completing the identification of the relationship between users and their respective substations. The topological identification effectiveness of the user substation allocation profiles is shown in Figure 14.
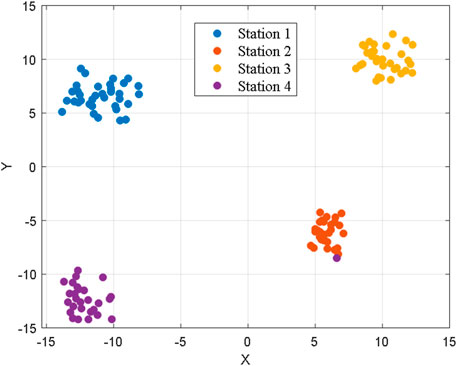
Figure 14. Visualization results of area identification.
It can be seen from Figure 14 that by constructing user substation allocation profiles, it is possible to automatically divide the 125 users in the low-voltage distribution substation into four groups without the need to pre-set thresholds. This effectively determines the relationship between each user and their respective distribution transformer, achieving a fundamentally accurate user-transformer relationship and connection. Additionally, this method overcomes the limitation of the branching boundary method, which has a low accuracy in calculating the electricity coefficient when data from other substations are mixed in.
In addition, to further analyze the classification effectiveness of the CNN method, this study also conducted simulation verification using four combination methods: K-means + Round half up, CNN + Round half up, K-means + Branch and bound, and CNN + Branch and bound. The simulation results are shown in Figure 15.
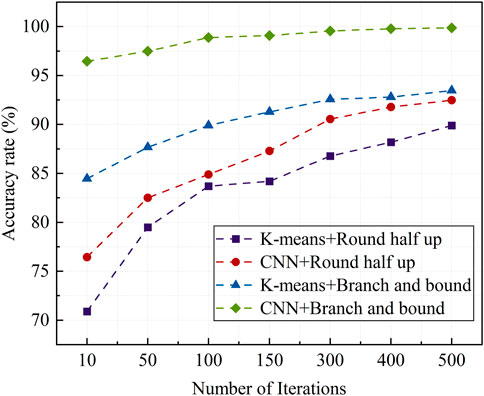
Figure 15. Effect of various methods on the accuracy of topology identification.
From the simulation results in Figure 15, it can be seen that the factors influencing the identification results mainly include the method used to calculate the electricity coefficient feature labels and the different clustering methods. It is evident that the topological identification results obtained using the Branch and bound method for solving the electricity coefficient are always better than those obtained using the Round half up method. Furthermore, the topological identification results using the CNN classification method are always superior to those using the K-means clustering method. This further demonstrates the advantages of the proposed method in the topological identification process. Additionally, this method can achieve a high level of topological identification accuracy early in the iteration process, requiring only a few iterations to identify the connection relationships between substations and users.
By introducing user profile technology into the research of substation topology identification, a comprehensive user profile is achieved through establishing voltage similarity feature tags and power consumption coefficient feature tags. This is done by solving the two types of tags to construct a comprehensive attribution feature matrix, completing the identification and verification of user substation attribution.
Simulation verification has revealed that single feature tags, whether voltage similarity feature tags or power consumption coefficient feature tags, have very limited effectiveness in identifying user relationships, with significant errors. However, by composing a comprehensive profile with both types of tags, it becomes very intuitive to identify which user substation attribution information is abnormal. Furthermore, the two types of tags can mutually corroborate each other, improving the accuracy of topology identification. However, constrained by the limitations of the algorithm itself, it is not possible to achieve 100% accurate identification, and further improvements are needed in subsequent work.
The data analyzed in this study is subject to the following licenses/restrictions: You can’t just share. Requests to access these datasets should be directed to eGlubG9uZ3lhbzE5OThAMTYzLmNvbQ==.
JL: Writing–review and editing. XY: Writing–original draft. BL: Writing–review and editing.
The author(s) declare that no financial support was received for the research, authorship, and/or publication of this article.
The authors declare that the research was conducted in the absence of any commercial or financial relationships that could be construed as a potential conflict of interest.
All claims expressed in this article are solely those of the authors and do not necessarily represent those of their affiliated organizations, or those of the publisher, the editors and the reviewers. Any product that may be evaluated in this article, or claim that may be made by its manufacturer, is not guaranteed or endorsed by the publisher.
Chen, Y., Qi, X., Gu, H., Li, C., Yang, X., and Jiang, J., (2022) “Method for consumer-transformer relationship identification based on diverse data,” in 2022 asia power and electrical technology conference (APET), November 11–13, 2022, 380–385.
Chen, S. (2021). Research on security portrait of industrial power users based on lmproved clustering algorithm [D]. South China University of Technology.
Cui, X., Liu, S., Jin, W., Lin, Z., Xuan, Y., and Wang, H. (2021). Consumer-transformer relationship and phase identification based on APAA and improved DBSCAN algorithm. Power Syst. Technol. 45 (8), 3034–3043.
Gao, Y., Kang, B., Xiao, H., Wang, Z., Ding, G., Xu, Z., et al. (2023). A model for identifying the feeder-transformer relationship in distribution grids using a data-driven machine-learning algorithm. Front. Energy Res. 11. doi:10.3389/fenrg.2023.1225407
Keming, L. I., Jiang, Y., Huang, S., et al. (2021). Topology identification method of a low-voltage distribution station area based on DTW distance and cluster analysis. Power Syst. Prot. Control 49 (14), 29–36.
Li, H., Liang, W., Liang, Y., Li, Z., and Wang, G. (2023). Topology identification method for residential areas in low-voltage distribution networks based on unsupervised learning and graph theory. Electr. Power Syst. Res. 215, 108969. doi:10.1016/j.epsr.2022.108969
Peng, Y. I. N., Haishen, L., Gu, Z., et al. (2023). Identification method for topology in distribution station area based on euclidean morphological distance and AP clustering analysis. Proc. CSU-EPSA 35 (9), 95–102.
Ren, H., Wang, Yu, Jing, L. I., et al. (2023). Dynamic identification of household-transformer relationship based on Bayesian inference and spectral clustering. Power Syst. Prot. Control 51 (10), 1–10.
Song, W., Shuai, G. U. O., Ji, L. I., et al. (2022). Intelligent identification of household-transformer relationship in distribution station area based on voltage sequence data. Proc. CSU-EPSA 34 (1), 48–55.
Su, L. I. U., Chun, H., Hou, S., et al. (2021). Identification method for household-transformer relationship based on derivative dynamic time warping distance and density-based spatial clustering of application with noise algorithm. Automation Electr. Power Syst. 45 (18), 71–77.
Wu, Y., Gao, C., Cao, H., and Tang, J. (2020). Clustering analysis of daily load curves based on GWO algorithm. Power Syst. Prot. Control 48 (6), 68–76.
Xiaodong, X. U., Ganyun, L. Ü., Lu, T., et al. (2020). Transformer area recognition based on harmonic spectrum correlation analysis and deep learning. Electrotech. Electr. (8), 7–11.
Xu, M., Zhao, J., Xiaoyu, W., and Zhu, J. (2022). Transformer-customer identification method for a low-voltage distribution network based on voltage clustering and incidence convolution. Power Syst. Prot. Control 50 (4), 92–102.
Yang, J., Zhou, Y., and Liu, J. (2022). Application of BiLSTM and TCN in abnormal identification of household-transformer relationship. Proc. CSU-EPSA 34 (5), 1–10.
Yang, T., Sun, Z., Tang, M., et al. (2021). Improved BP household-transformer relationship identification method based on TensorFlow framework. Zhejiang Electr. Power 40 (8), 25–32.
Yinjie, Z. H. U., Zhao, J., Xuan, Yi, et al. (2024). Transformer-customer relationship identification of low-voltage distribution network with high proportion of household PV system. Power Syst. Technol. 48 (3), 1160–1171.
Zeng, S., Wu, J., Xin, L. I., et al. (2021). Identification of station voltage and user relationship based on fuzzy C-means clustering algorithm. Sichuan Electr. Power Technol. 44 (3), 69–75, 87.
Zhang, H., Zhao, J., Wang, X., and Xuan, Y. (2022). Low-voltage distribution grid topology identification with latent tree model. IEEE Trans. Smart Grid 13 (3), 2158–2169. doi:10.1109/tsg.2022.3146205
Zhang, H., Cheng, L., Hu, S., et al. (2021). Topology verification method of a distribution network based on hierarchical clustering and the Pearson correlation coefficient. Power Syst. Prot. Control 49 (21), 88–96.
Zhao, J., Xu, M., Wang, X., Zhu, J., Xuan, Y., and Sun, Z. (2022). Data-driven based low-voltage distribution system transformer-customer relationship identification. IEEE Trans. Power Deliv. 7 (4), 2966–2977. doi:10.1109/tpwrd.2021.3120625
Keywords: user profiling, load balancing, voltage similarity, topology identification, convolutional neural network
Citation: Li J, Yao X and Liu B (2024) Identification of low-voltage distribution substation topology based on user profile. Front. Energy Res. 12:1427986. doi: 10.3389/fenrg.2024.1427986
Received: 05 May 2024; Accepted: 01 July 2024;
Published: 29 July 2024.
Edited by:
Feng Liu, Nanjing Tech University, ChinaReviewed by:
Bahaa Eddine Elbaghazaoui, Ibn Tofail University, MoroccoCopyright © 2024 Li, Yao and Liu. This is an open-access article distributed under the terms of the Creative Commons Attribution License (CC BY). The use, distribution or reproduction in other forums is permitted, provided the original author(s) and the copyright owner(s) are credited and that the original publication in this journal is cited, in accordance with accepted academic practice. No use, distribution or reproduction is permitted which does not comply with these terms.
*Correspondence: Jiang Li, bGlqaWFuZ19lZUBzaGllcC5lZHUuY24=
Disclaimer: All claims expressed in this article are solely those of the authors and do not necessarily represent those of their affiliated organizations, or those of the publisher, the editors and the reviewers. Any product that may be evaluated in this article or claim that may be made by its manufacturer is not guaranteed or endorsed by the publisher.
Research integrity at Frontiers
Learn more about the work of our research integrity team to safeguard the quality of each article we publish.