 Hongbo Wu1
 Weile Kong
94% of researchers rate our articles as excellent or good
Learn more about the work of our research integrity team to safeguard the quality of each article we publish.
Find out more
ORIGINAL RESEARCH article
Front. Energy Res., 25 July 2024
Sec. Smart Grids
Volume 12 - 2024 | https://doi.org/10.3389/fenrg.2024.1427614
This article is part of the Research TopicAdvances in Renewable Energy System Monitoring, Situational Awareness, and ControlView all 22 articles
With a growing focus on the environment, the power system is evolving into a cleaner and more efficient energy supply infrastructure. Photovoltaic (PV) and storage are key assets for the power industry’s shift to sustainable energy. PV generation has zero carbon emission, and the integration of a substantial number of PV units is fundamentally important to decarbonize the power system. However, it also poses challenges in terms of voltage stability and uncertainty. Besides, the daily load and real-time price are also uncertain. As a prosumer, energy storage demonstrates the capacity to enhance accommodation and stability. The adoption of Virtual Power Plants (VPPs) emerges as a promising strategy to address these challenges, which allows the coordinated orchestration of PV systems and storage to participate power dispatch as a virtual unit. It further augments the flexibility of the power distribution system (PDS). To maximize the profit of VPP, a data-driven price forecasting method is proposed to extract useful information from historical datasets based on a novel LSTM-Transformer-combined neural network. Then, an improved sparrow searching algorithm (SSA) is proposed to schedule VPPs by combining the secant line search strategy. The numerical results, obtained from testing the model on IEEE 13-node and 141-node distribution systems, demonstrate the effectiveness and efficiency of the proposed model and methodology.
According to statistics provided by the International Energy Agency, the scale of renewable energy generation in the country has reached unprecedented levels, with PV power generation dominating the landscape (IEA, 2024). The rapid proliferation of distributed resources, including solar photovoltaic power plants and wind power generation, has brought positive impacts on low-carbon and environmentally friendly energy future. The sustainable development of distributed energy provides a new pathway for constructing a cleaner, more flexible, and reliable energy system (Churkin et al., 2024). By reducing reliance on fossil fuels, promoting local economic development, and advancing energy decentralization, distributed energy is poised to play a more crucial role in driving sustainable development.
At the same time, it has introduced unprecedented challenges to power systems. The integration of distributed resources has fundamentally altered the conventional operation mode of power grids, particularly leading to concerns about stability because of multiple uncertainties (Alshehri et al., 2020; Yan et al., 2022). Behind the rapid growth of PV power generation lies a series of problems, including increased peak load pressure in the power system caused by a high proportion of distributed PV power generation and the occurrence of curtailment (Mohandes et al., 2021). The inclusion of distributed resources has given rise to challenges associated with reverse power flow. In traditional power systems, power plants supply electricity to loads, but the integration of distributed resources allows certain demand-side prosumers to feed electricity back into the grid. The aforementioned phenomenon of reverse power flow can disrupt established protective and control mechanisms, thereby potentially instigating stability issues (Massignan et al., 2017; Pinheiro et al., 2022). Moreover, overvoltage has also emerged as a pressing issue due to the exponential growth of distributed resources within the power system. The irregular power generation capacity and consumption patterns of these resources may result in excessive power injection, surpassing the normal voltage range (Padullaparti et al., 2023). Overvoltage is not only a threat to power equipment but also a risk to the overall stability of the power grid, as stated in Poudel et al. (2023).
In response to these challenges, the VPP, as an innovative energy management paradigm, provides a novel solution to address energy transition and sustainable development by aggregating and centrally managing diverse distributed energy resources (Gough et al., 2022; Zhang et al., 2023). The primary objective of a VPP is to integrate and coordinate distributed energy resources, facilitating the utilization of large-scale small-capacity units and enhancing the reliability and economics of the power system. Within the VPP framework, rooftop PV and distributed storage aggregation emerge as critical solutions. A key aspect of PV aggregation development is the incorporation of energy storage technology into distributed PV systems. The volatility inherent in PV generation can be mitigated through energy storage, thereby enhancing the stability and reliability of the power system. This allows the PV-storage system to participate in grid peak-shaving services, reduce curtailment, and enhance economic and technical efficiency (Guo et al., 2021). Additionally, the energy storage systems, acting as flexible and adjustable resources, play a pivotal role in supporting demand response and frequency regulation in the power system. Through the effective cooperation of PV and energy storage systems, VPPs can tackle the challenges posed by sustainable energy transition (Feng et al., 2023). However, VPP dispatch faces challenges. For instance, the efficient aggregation and management of large-scale small-capacity distributed energy resources present complex issues.
Various models for VPPs have been proposed in existing research, emphasizing the coordinative management of distributed generation, demand-side resources, and load devices. The primary objective is to meet the requirements of power system consumption or supply guarantee. VPP plays a crucial role in integrating multiple distributed PV power generation systems into a unified system, thereby enhancing overall performance and reliability. Fan et al. (2020) introduces an online convex distributed optimization strategy for managing multiple PVs and EVs. This strategy ensures the benefit of utilities by adjusting the setpoints of the governed PVs and EVs. Additionally, the regulation of these PVs and EVs contributes to supporting the power network by offering power and nodal voltage regulation services. In Bannavikarn and Hoonchareon (2021), a solar power aggregation framework is proposed within a VPP, aiming to optimize wholesale energy trading and grid cooperation. The study formulates an optimization problem, utilizing linear programming (LP), to maximize the VPP’s profit in the day-ahead market while adhering to required hourly ramp-rate limits. Hong et al. (2023) presents a mixed-integer linear programming (MILP) model, aiming to maximize VPP’s day-ahead profit and optimize the DERs’ operation including wind power plant, PV, energy storage, electric vehicle, and residential loads. Gao et al. (2019) proposes a mixed-integer second-order cone programming (MISOCP) model for optimal dispatch of hybrid power-hydrogen VPP, mitigating the risk of renewable and promoting renewable accommodation. It aims to maximize cooperation profits while systematically improving the security of the distribution system. Gong et al. (2019) devises a quadratic optimization model for a VPP comprising homes equipped with rooftop solar PV generation and battery energy storage. Through optimized control and scheduling of battery operations, along with peer-to-peer power flow between homes, the paper proposes solutions to mitigate the elevated costs and uncertainties introduced to the grid by high solar PV penetration. Most of the abovementioned works make strong assumptions to establish a traditional optimization model that can be solved by commercial solvers. However, the real problem of the VPP is a nonlinear nonconvex model, which is intractable for traditional methods.
Due to the complex multi-dimensional nonlinear characteristic of the optimal operation and planning model for power systems, a variety of biological population algorithms are employed to find the optimal or near-optimal points. In Ge et al. (2022), a particle swarm optimization (PSO) is introduced to obtain the global optima for the integrated energy system planning problem. It performs well in the global searching ability by improving particle diversity. However, it has the disadvantage of premature convergence and slow search speed. To schedule the demand-side flexible resources, a chicken swarm optimization (CSO) algorithm is introduced in Wang et al. (2021) for reducing the short duration of the peak load. It has a better capacity for exploration and exploitation while having a slow convergence speed on the large-scale problem. The gray wolf optimization (GWO) algorithm is used in the multi-energy hub optimization problem, which decomposes the original problem into subproblems to search for the optimum solution based on its excellent robustness and accuracy (Peng et al., 2022). It has few parameters, simple implementation, and strong searching ability, but it is restricted to the population diversity. SSA is first proposed in Xue and Shen (2020), which is proved to have better performance than other algorithms. For example, it is used in a two-layer nonlinear optimal schedule of flexible traction power supply system demonstrating higher precision and faster convergence speed than GWO and other algorithms (Chen et al., 2022). However, it may fall into the local optimum due to the insufficient search of the feasible region. To deal with the limitations, various improved SSA are proposed in existing research. In Zhao et al. (2023), an improved SSA (ISSA) is developed for the optimal scheme of a hydrogen-electric hybrid microgrid by incorporating a novel location updating scheme and nonlinear weighting factors. A random walk SSA (RSSA) is proposed in Qiao et al. (2022) for the economic dispatch of the combined cooling heating and power microgrid by improving the ability to locally search for optimal solutions. An improved version of SSA (ESSA) is suggested in Nguyen et al. (2022) to aid the microgrid operation based on a firefly algorithm mutation strategy and elite reverse learning strategy. These methods rely on the rapid convergence of discoverers and direct leap to the optimum vicinity of joiners, which restricts the population’s search range and diversity and tends to the local optima.
To immune multiple uncertainties of renewable, load, and price, robust optimization should assume an uncertain range. Stochastic optimization has to assume a probability distribution. However, due to the features of physical models on parameters inaccuracy and information ambiguity, it has limitations in practical applications. With the popularization of terminal acquisition equipment, the amount of data and information available in the power network has exploded. Thus, data-driven methods have attracted more attention, which have high prediction accuracy based on a large amount of historical data. Moreno et al. (2020) presents a hybrid irradiance forecasting approach using Artificial Neural Networks (ANNs) and a novel similar hour-based selection algorithm. This method is designed to enhance the integration of PV systems into a VPP, particularly in scenarios with limited or nonexistent historical irradiance data. In our previous work, an LSTM-XGBOOST combined model is proposed in Ma et al. (2023) to forecast the short-term heavy overload, which contributes on monitoring and controlling of heavy overload in public transformers. In Feng et al. (2023), a convolutional neural network with gated recurrent units (CCN-GRU) prediction model is proposed to predict more accurate PV power generation with weather data under complex conditions. A deep convolutional long short-term memory (CNN-LSTM) is developed in Jalali et al. (2022) to extract useful features for the accurate forecast of solar irradiance, which is important for the PV power plant participating in energy bidding. Most existing prediction methods have a challenge of low prediction accuracy stemming from the failure of thorough feature extraction of temporal data when the time series is long.
To overcome the abovementioned shortcomings of the existing methods, we propose a data-model-driven dispatch method for integrated distribution systems with VPPs, aiming to effectively combine the advantages of historical data and physical models. This approach involves integrating price forecasting and power scheduling. To accurately predict day-ahead electricity prices for economic dispatch, we propose a novel LSTM-Transformer-combined network to extract useful information from historical data. Subsequently, a novel enhanced SSA dispatching algorithm is developed to optimize the coordinated scheduling strategies of DSO and VPPs. The novel SSA incorporates population initialization, mutation strategy, and secant line search to enhance global search capability and convergence speed. The proposed method, which combines an LSTM-Transformer prediction scheme and a secant line search-aided sparrow search algorithm (SLS-SSA), offers valuable insights into the economic dispatch of DSO with multiple VPPs. The main contributions are summarized as follows:
• This paper develops a novel dual-layer LSTM-Transformer model for short-term prices, renewable output, and load forecasting. It utilizes the LSTM network to extract fundamental temporal features and then employs the self-attention mechanism of the Transformer to identify global information and the interrelationships of time-series data. This approach captures the significant features of the current interval, contributing to accurate short-term forecasting. The novel prediction model facilitates the data-driven dispatch method for VPPs by exploiting the valuable information of historical data. This contributes to the optimal decision-making of DSO and VPPs, thereby enhancing their economic performance and the integrity of the power system.
• A novel SLS-SSA is proposed for the nonconvex nonlinear optimization of PDS with multiple VPPs. By combining the sacent line search scheme, SLS-SSA can approximate rather than leap to the optima, effectively contributing to a thorough search of feasible regions and obtaining the global optimum. Moreover, it integrates circle chaotic mapping and mutation strategies to ensure even distribution during initialization and population diversity enhancing its global search capacity. Numerical results show that the proposed SLS-SSA performs well on optimal solution and convergence speed.
The remainder of this paper is organized as follows. Section 2 introduces the proposed coordinated DSO and VPP operation model. The proposed day-ahead data-driven prediction method is presented in Section 3. The novel secant line search-aided sparrow search algorithm is detailed in Section 4. Case studies are conducted in Section 5. Section 6 concludes the paper.
The collaborative operation of flexible resources within VPPs plays a crucial role in promoting the integration of distributed resources and improving the economic performance of the DSO and VPPs. This paper introduces an optimization model that adopts a distribution system perspective, considering the collaborative effects of both rooftop PVs and energy storage systems to improve the stability of the distribution system based on the predicted renewable, load, and price.
The objective function is to minimize the total operation cost among DSO and VPPs, which is formulated as Eq 1:
In the equation,
PV units are distributed throughout the distribution system, encompassing rooftop PVs. The challenges posed by small-scale impacts often make it difficult for PV units to participate in power scheduling independently. VPP presents a promising solution for the aggregation of PVs, and its detailed model is formulated as follows.
Eq 2 represents the adjustable range of PV output within its forecasted upper limit
The integration of the distributed PVs also poses a challenge to voltage stability. Without effective management of reactive power regard to the nodal voltages will cause intense voltage deviation. It is essential to share the reactive power of each PV unit contributing to voltage stability. According to Gao et al. (2022), the reactive power supply capacity is modeled in Eqs 3,4.
where
In the context of accommodating the increasing penetration of renewable energy, energy storage systems play a pivotal role in facilitating the seamless integration of renewable energy sources. By acting as a flexible resource, they enable better matching of supply and demand, thus supporting the efficient incorporation of renewable energy into the grid and contributing to a more sustainable and resilient power infrastructure. Furthermore, energy storage systems provide an effective solution for handling the inherent intermittency and unpredictability of renewable energy sources, such as PVs. Their rapid response capabilities enable them to act as a buffer, absorbing surplus energy during peak generation and releasing stored energy during periods of low generation or increased demand. This not only aids in stabilizing the grid but also enhances the overall reliability of the power supply.
Expanding on the advantages of energy storage, its inherent ability to smooth out the temporal variability in renewable energy sources, such as photovoltaics, plays a crucial role in load shifting. This time-shifting characteristic allows energy storage systems to accumulate excess energy during periods of high generation, typically during daylight hours, and discharge it during peak demand periods, thereby contributing to renewable accommodation indirectly. Based on Kong et al. (2023), the conventional battery storage model is detailed as follows.
Eq 5 represents the energy status
Similarly, battery storage can also inject reactive power flows into the grid to improve the voltage when the voltage deviation occurs. Once the active power of storage is fixed, the feasible reactive power output interval can be determined by Eq 11.
where
The most commonly used power flow model of distribution model is the distflow model. Reverse power flow often occurs in the power distribution network with the large-scale integration of distributed energy resources. The distflow model is applicable in this context, we apply a second-order cone relaxation (SOCR) distflow model to deal with the bidirectional power flow (Chowdhury et al., 2023). It is formulated as follows.
Eqs 12,13 represent the nodal power balance equations.
In the SOCR distflow model, the Eqs 18 is relaxed into Eq 19.
The proliferation of DERs in distribution networks has led to a frequent occurrence of overvoltage issues, posing significant challenges to the secure operation of power systems. Consequently, the focus of our attention is directed towards the voltage-related challenges in distribution networks. Addressing and mitigating overvoltage concerns are imperative for ensuring the reliability and stability of power systems, particularly as the landscape of energy generation shifts towards a more decentralized and renewable-oriented paradigm. In light of this, our research aims to comprehensively analyze and propose solutions to voltage-related issues in distribution networks, contributing to the overall resilience and effective management of modern power infrastructures. Based on the developed power flow model, the voltage at each node can be calculated using the following formula:
Eq 20 represents the voltage relationship of different buses. Eq 21 limits the secure voltage range of each bus.
Finally, the optimization model is formulated as (OP):min Eqs 1-21.
In recent years, deep learning has emerged as a crucial technology in artificial intelligence and has garnered significant attention for its capabilities in predicting electricity prices, a domain characterized by nonlinear and complex time series data. Among deep learning models, the Long Short Term Memory Network (LSTM) is particularly noted for its effectiveness in mitigating the vanishing gradient issue inherent in traditional recurrent neural networks (RNNs), thereby enhancing predictive accuracy in electricity price forecasting. However, when dealing with longer time series data, the recurrent input mechanism of LSTM may not effectively identify the dependencies between time features that are spaced far apart. This limitation could hinder the efficient processing of long data sequences. In contrast, the self-attention mechanism of the Transformer considers all positions within the input sequence simultaneously, thereby circumventing this issue.
To address these challenges, a novel hybrid model combining LSTM and Transformer techniques is developed. This model leverages the Transformer’s self-attention alongside the LSTM’s sequential modeling strengths, intending to improve the prediction accuracy of electricity prices. The model comprises two principal components. Initially, the LSTM layer aids in the extraction of temporal features from the input data, which are then further refined by the Transformer layer to produce the final output. This design allows the LSTM to preserve the integrity of temporal features during the sequential generation of the output, while the Transformer is capable of identifying complex relationships between different time intervals within the time series data. The proposed model’s framework is depicted in Figure 1.
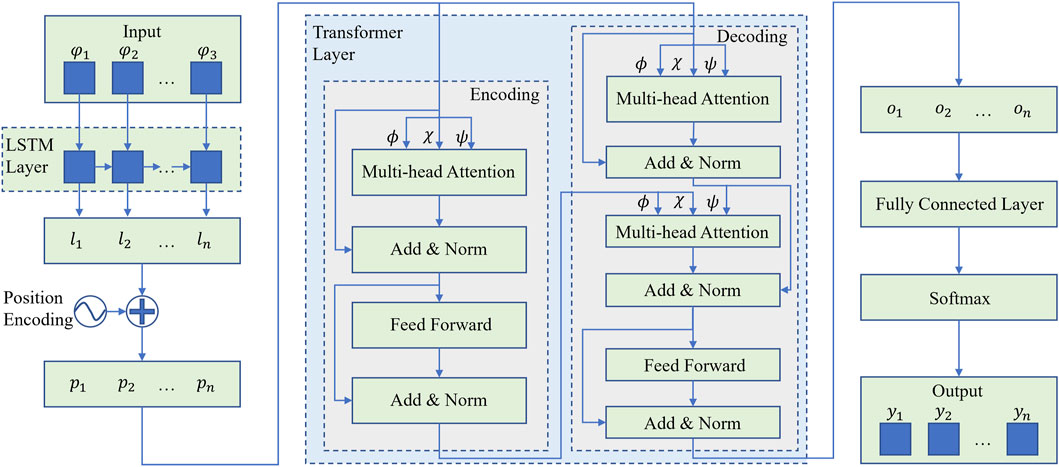
Figure 1. Illustration of the proposed model architecture.
where
The specific steps are as follows:
Step 1: The input is sent into an LSTM network, which is designed to extract temporal features from time series data.
where
Step 2: The Transformer model is utilized to process the features extracted by the LSTM layer. Since the Transformer model does not inherently recognize the order of the sequence, it processes the inputs simultaneously without acknowledging the order of the elements. To address this issue, positional encoding is added to the input time series features before they are introduced to the Transformer. Positional encoding provides positional information for each sequence element, which is crucial for maintaining the order of the time series. The positional encoding
where
Step 3: The self-attention mechanism distributes weights by evaluating the associations between each position in the input sequence and all other positions, thereby selecting the most relevant information for the current position. It comprises three components: Query
where
The Multi-Head Attention mechanism divides self-attention into several “heads,” represented by Eq 27, with each head learning different aspects of the sequence representation as Eq 28. This partitioning allows for parallel self-attention operations, and their outputs are concatenated and combined through a linear layer, enabling the model to absorb information from various representational subspaces and extract comprehensive features.
Utilizing the multi-head self-attention mechanism, each time segment of the input sequence computes weighted information from other segments, thereby capturing global feature correlations. The feedforward neural network then applies further nonlinear transformations to the output of the attention layer, enhancing the model’s representational capacity. The primary function of the encoder layer is to encode the input sequence, extracting essential information from the sequence to facilitate subsequent processing by the decoder layer.
Step 4: The decoder section also employs a multi-head attention mechanism, utilizing the inputs from the encoder layer as the Key vector and Value vector, and the outputs from the previous self-attention layer of the decoder as the Query vector for attention calculation, thereby deriving the final feature representations
Step 5: The output of the Transformer layer is passed through a fully connected layer and normalized using Softmax to obtain the final prediction result
Electricity price forecasting is a very complex task, and since electricity price is related to many factors, it is inevitable that the accuracy of the forecasted electricity price will be subject to a certain degree of error, and cannot be exactly the same as the actual electricity price. In order to evaluate the performance of the model more accurately, this paper uses four evaluation metrics to measure the model’s prediction performance from various perspectives.
MAE is used to measure the average of the absolute error between the predicted value and the true value. The advantage of MAE is that it is more intuitive and easy to understand, and can directly reflect the size of the error between the predicted value and the true value. Therefore, this paper adopts MAE to evaluate the prediction accuracy calculated by Eq 29.
Where
Root mean square error (RMSE) is a metric used to assess the magnitude of the difference between the predicted value and the true value, and is more sensitive to large errors because it squares the error. It is calculated by Eq 30:
Mean squared error (MSE) is the average of the square distances of each data point from the true value. It is the average of the sum of squared errors, and its formula in Eq 31 resembles that of variance.
The established economic dispatch model of DSO with multi-VPPs is a nonconvex nonlinear problem. As it is reviewed in Zhang and Ding (2021), SSA has a better performance than other heuristic bionic optimization algorithms. To cater to the global optimum and fast convergence, we propose a novel SLS-SSA by combining the mutation strategy and secant line search method.
Based on the traditional SSA, we directly introduce the improved part of the novel SLS-SSA as the omitted details of SSA can refer to Xue and Shen (2020). The generated initial population in basic SSA has a characteristic of uneven population distribution, which has a huge impact on the convergence speed. To generate the initial individuals with a more random and uniform distribution, an improved circle chaotic mapping strategy is applied here (Wu et al., 2023).
where
where
To overcome the limitation of the traditional SSA, we propose an improved search strategy to enhance the global search ability. The population diversity is increased by considering the mutation and greed strategy, which can avoid falling into the local optimum. Here, the improved location update process is summarized as follows.
where
The line search algorithm is a method employed to determine the step length during iterative processes aimed at identifying the minima of a function. It serves to enhance the local search capability of the SSA. As depicted in Eq. 39, the scrounger updates its position by considering the disparity between its current location and the optimal position occupied by the producer.
where
Through an analysis of the scroungers’ location update process, we observed that the traditional SSA solely designates an update direction, neglecting the importance of an appropriate step size for enhancing convergence speed. Drawing inspiration from the line search scheme, we introduce a step size parameter, denoted as
Treating
In accordance with the secant method, the iterative update for the variable can be derived from the first derivative using the following Eq 42.
Similarly, we can derive the location update of the sparrow in Eq 43.
where
To handle the binary variables in the formulated dispatch problem, they are relaxed into continuous variables within the interval [0,1]. Subsequently, the constraint
The specific steps of the proposed data-driven-based SLS-SSA for VPP dispatch are summarized as follows.
• Step 1 Train the prediction model using historical data via LSTM-Transformer-combined neural networks.
• Step 2 Forecast the day-ahead price, renewable output, and load based on the prediction model.
• Step 3 Initialize the sparrow population using the improved circle chaotic mapping strategy and relevant parameters of the dispatch problem.
• Step 4 Optimize the dispatch problem using the SLS-SSA and update the location based on the mutation strategy and secant line search method.
• Step 5 Output the final optimal dispatch strategy for VPPs and DSO.
First, the LSTM-Transformer-combined model is utilized to predict the electricity price, PV output, and load. Subsequently, case studies are conducted on the IEEE 13-Bus and 141-Bus systems to validate the proposed method, which effectively schedules various flexible resources to enhance the economic performance of both DSO and VPPs.
In this section, we utilize the proposed prediction method to conduct day-ahead electricity price forecasts, which serve as input for the optimal dispatch process in subsequent sections. Specifically, we target the hourly electricity price in our analysis. Historical electricity price data spanning from 1 January 2023, to 31 December 2023, are sourced from PJM (PJM, 2024). Given the objective of generating a day-ahead dispatch plan for both the DSO and VPPs, we predict the hourly electricity price for each of the 24 h in a day.
The dataset is divided into training, validation, and test subsets to mimic the scenario of training on historical data and assess model performance on future data. During data processing, normalization is applied to accommodate inputs with varying magnitudes and dimensions. The experimental setup utilized a computing platform with an Intel i5-11400 CPU, 32GB of RAM, Python 3.8, PyTorch 1.12.1, and an RTX2080Ti GPU. The learning rate was adjusted to 0.001, with a batch size of 256 samples. The network’s hidden layer size is set to 256 dimensions. In terms of the model architecture, the number of LSTM or GRU layers is set to two. The transformer layer comprises two encoder layers, two decoder layers, and four attention heads. For the CNN layer, we have specified a convolution kernel size of 3 and a stride of 1.
The economic performance of both DSO and VPPs heavily relies on the accuracy of the forecasted electricity price. Therefore, we utilize the proposed LSTM-Transformer-combined model to predict the day-ahead electricity price. The predicted results are illustrated in Figure 2. To further validate the effectiveness of our proposed method, we compare it with commonly used CNN-LSTM and CNN-GRU models. As depicted in the figure, the price predicted by the LSTM-Transformer-combined model exhibits closer alignment with the real price. Conversely, the prices forecasted by the CNN-LSTM and CNN-GRU models demonstrate larger deviations in certain time slots.
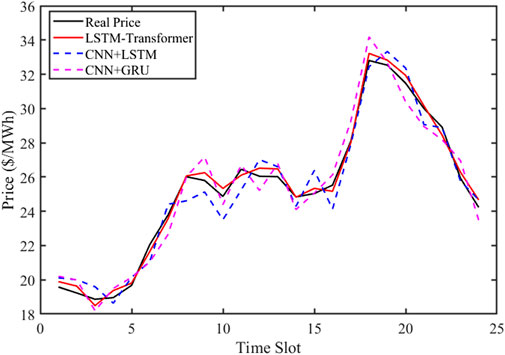
Figure 2. The predicted electricity price under different methods.
To assess the prediction accuracy of different methods, we present the MAE, RMSE, and MSE in Figure 3. Compared to the CNN-LSTM and CNN-GRU forecasting methods, our proposed model demonstrates superior performance. Specifically, the proposed LSTM-Transformer-combined model reduces the MAE by 74.53% and 69.39% compared to CNN-LSTM and CNN-GRU, respectively. Additionally, the RMSE is reduced by 72.41% and 69.09%, while the MSE is reduced by 72.40% and 69.08%, respectively. These improvements are visually apparent in the Figure, confirming that the prediction precision of our proposed method surpasses that of CNN-LSTM and CNN-GRU.
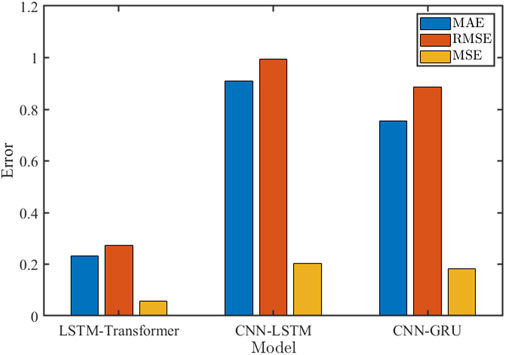
Figure 3. Precision performance under different methods.
Following a similar procedure, the day ahead PV output and load ratio are predicted. The historical data for PV output and load are obtained from PJM for the period from 1 January 2023, to 31 December 2023. Due to space constraints, we omit the detailed process of their forecast and the precision analysis. The day ahead PV output and load ratio are depicted in Figure 4.
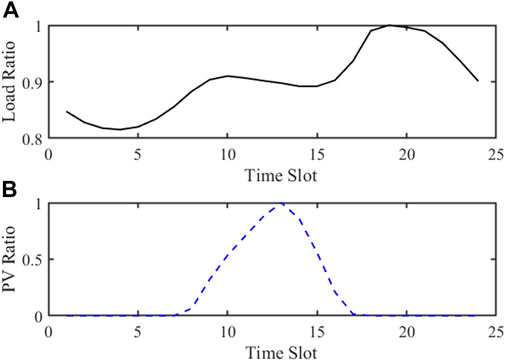
Figure 4. Base (A) load profile and (B) PV profile.
Based on the predicted price, simulations are conducted using the IEEE 13-node feeder test system depicted in Figure 5. The system consists of 13 nodes and 12 transmission lines. Two VPPs are connected to nodes 4 and 11. Additionally, each VPP is equipped with multiple battery storage units and rooftop PVs. The distribution network is linked to the main grid. Codes of optimization part are implemented in MATLAB on a personal computer equipped with a quad-core 2.5GHz processor and 32GB of memory.
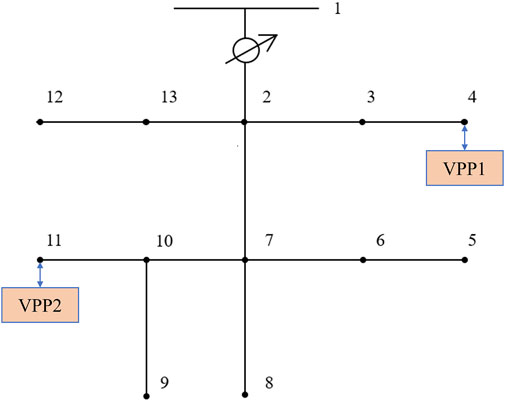
Figure 5. Topology of IEEE 13-bus distribution system.
The base load ratio and PV capacity ratio are extracted from the predictions illustrated in Figure 4. Each node’s daily load is calculated by scaling the base load ratio accordingly. Similarly, the PV output from rooftop units is determined by scaling the base PV capacity ratio. The parameters associated with storage and PV in VPPs, relevant to the experiment, are outlined in Table 1.
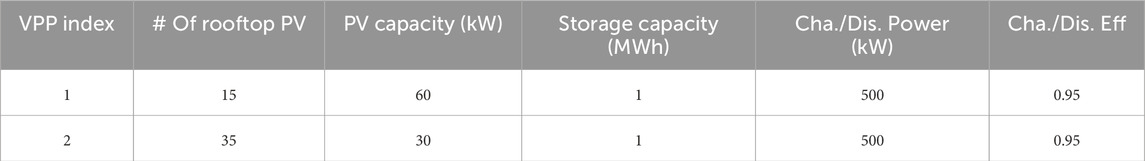
Table 1. Parameters of VPPs.
The local marginal price, represented by the red solid line in Figure 2, is predicted using the LSTM-Transformer-combined model. It signifies the power injection price from the main grid at the reference bus-1. Additionally, in order to encourage local accommodation, the power injection price from VPP is fixed at 90% of the local marginal price. Furthermore, a penalty of $10 per MWh is imposed for renewable energy curtailment.
To demonstrate the effectiveness of the proposed data-driven method in the economic dispatch of DSO, we perform simulations on the IEEE 13-Bus distribution system. Within the cases, the population size is 100. Maximum number of iterations is 300. The proportion of producer and scouter are 0.2 and 0.2, respectively. The safety threshold is 0.8.
The total daily costs incurred by DSO are compared based on the outcomes obtained from different price forecasting schemes. The simulation results are presented in Table 2. It is evident that the total cost predicted by LSTM-Transformer closely aligns with the actual price, with values higher by only 9.47% and 4.98% compared to CNN-LSTM and CNN-GRU, respectively.

Table 2. Model performance under different forecasting scheme.
To explore more details of the performance of the proposed economic dispatch method, we analyze the power injection from the main grid and the total power supply of each VPP. In Figure 6, we present the histogram of the power supply from the main grid and VPPs. The load is primarily served by the main grid supply during the early morning, evening, and at night. This is attributed to the significant presence of PVs in the VPPs, which primarily generate energy during daylight hours. Additionally, VPPs draw power from the distribution system at night when the LMP is lower during the valley periods. It is notable that the total power supply slightly exceeds demand, which is partly due to power losses accounting for approximately 3.18% of the total load.
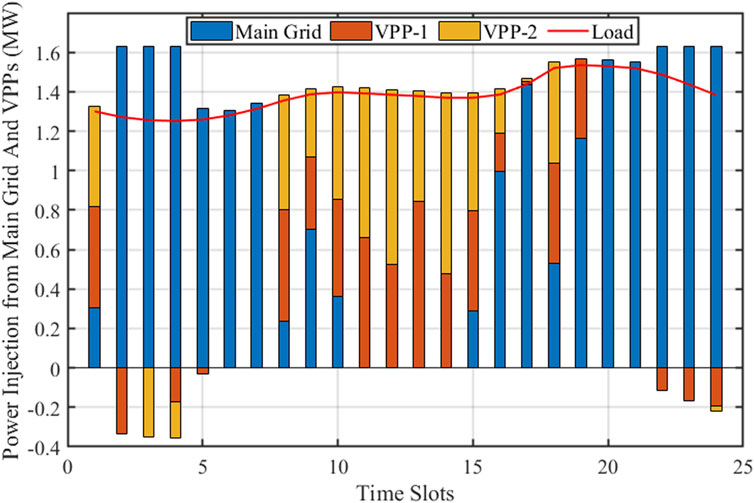
Figure 6. Total supply from the main grid and VPPs.
Figure 7 illustrates the SOC and charging/discharging status of the storage units in VPPs. The upper sub-figure represents the results in VPP-1, while the lower sub-figure represents the results in VPP-2. It can be observed that the SOC of both storage units exhibits a similar trend. They charge at night to store inexpensive power and charge during the afternoon to store surplus PV production. Subsequently, they discharge in the morning and evening to reduce costs and enable greater utilization of renewable output. These findings underscore the effectiveness of the proposed economic dispatch method.
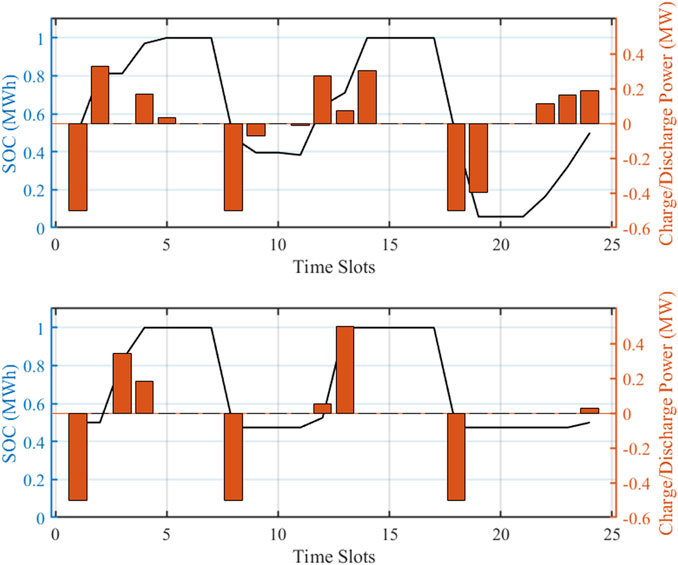
Figure 7. The status of storage in VPPs.
To explore the robustness and reliability of the proposed methods, we conduct case studies on in-the-sample data in the training dataset and out-of-sample data generated by the Monte Carlo simulation (MCS). In this work, the MCS is used to generate 1000 stochastic scenarios following the normal distribution for modeling price, renewable, and load uncertainties. The 1000 in-the-sample data is randomly sampled in the training dataset.
The operation cost and voltage magnitude are employed to assess the model performance. In each simulation, if the voltage is more than 1.05 p.u. or less than 0.95 p.u., it could be considered that this scenario is unstable. They are recorded in the boxplots which are shown in Figure 8A. Shows that the least total cost obtained from our method is $818 and the mean cost is $843. The total costs in most in-the-sample scenarios are ranging from $818 to $870. However, the least cost and mean cost in MC are $818 and $851, respectively. The total costs in most out-of-sample scenarios are ranging from $818 to $910. There are a few scenarios whose costs are more than $910 while less than $925. There is only a 4.89% cost increment in most scenarios. Figure 8B presents the voltage distribution in two kinds of samples. It is observed that voltages in all in-the-sample scenarios are distributed within 0.95 p.u. to 1.05 p.u. However, 11 scenarios occur overvoltage or undervoltage in the Monte Carlo simulation, which only occupies 1.1% of the total scenarios. Thus, the MCS shows the robustness of the proposed method under different uncertain conditions.
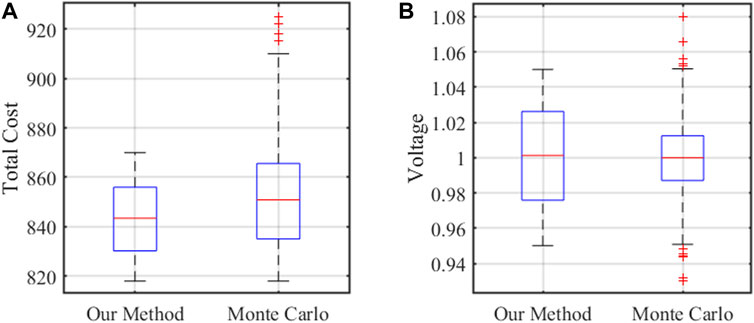
Figure 8. Performance comparison of our method and Monte Carlo simulation on (A) total cost and (B) voltage magnitude.
To further validate the effectiveness of the proposed data-driven economic dispatch in terms of system stability and convergence speed, this section conducts simulation tests on the IEEE 141 distribution network system to analyze the model’s performance.
Similarly, to assess the model performance of the proposed method on larger systems, case studies are conducted on the IEEE 141-bus system, shown in Figure 9, with 8 VPPs connected to nodes 20, 32, 58, 74, 86, 106, 116, and 130. These cases involve an increase in the total number of connected rooftop PVs and battery storage units. The parameters of storage and PV in VPPs involved in the experiment are presented in Table 3. Other parameters remain consistent with those used in the IEEE 13-bus system.
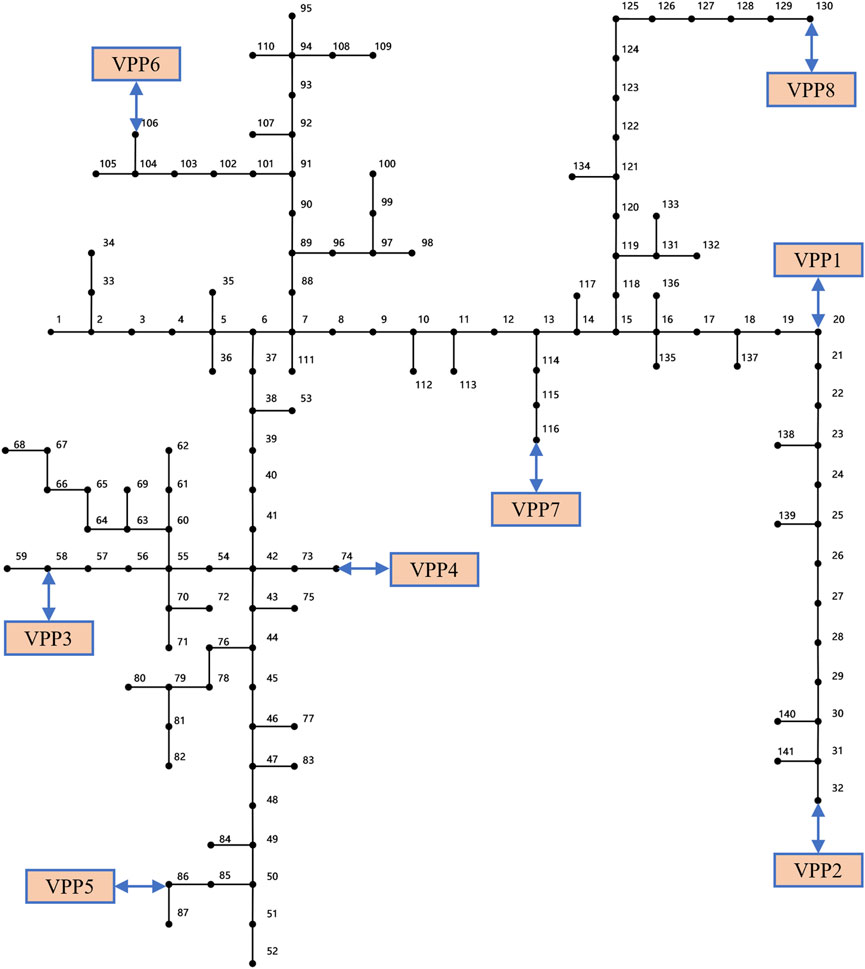
Figure 9. Topology of IEEE 141-bus distribution system.
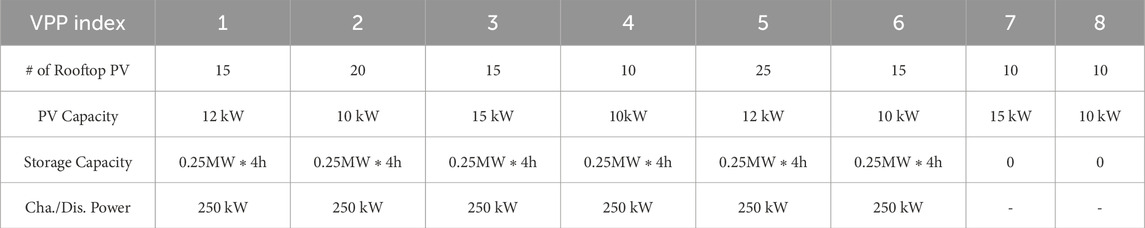
Table 3. Parameters of VPPs.
By employing the proposed method to solve the collaborative optimization problem, the aggregated output of each VPP and main grid injection are obtained, as depicted in Figure 10. It is evident that the load is primarily served by electricity from the main grid during nighttime and in the early morning. Any surplus electricity from the main grid during off-peak hours is stored in the VPPs to capitalize on the cheaper energy available during valley periods. Conversely, the demand is met by the VPPs during midday and in the evening. This observation underscores the role of VPPs as prosumers, leveraging their storage capacity to maximize the utilization of electricity generated during periods of ample sunlight and inexpensive valley periods. Moreover, when the power generated by the PV system exceeds real-time demand at midday, any excess energy can be stored in the energy storage system. Subsequently, during periods of high demand or when sunlight is unavailable in the evening, the energy storage system can discharge the stored energy, thereby bolstering the overall stability and economic efficiency of the power distribution system.
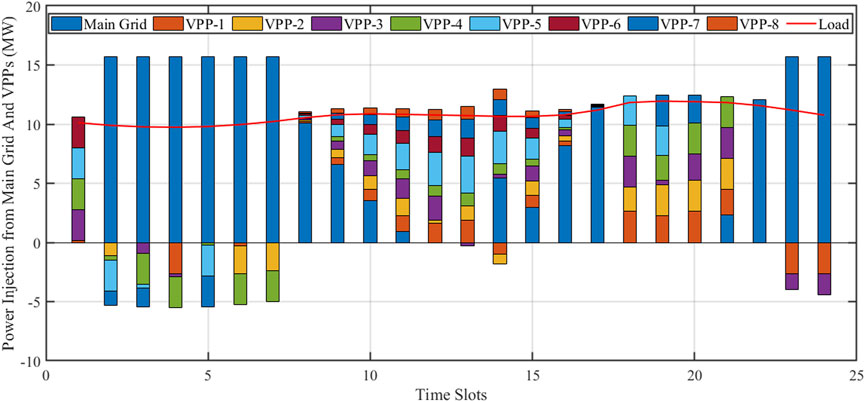
Figure 10. Total supply from main grid and VPPs in the IEEE 141-bus distribution system.
The extensive integration of distributed energy resources presents challenges such as overvoltage or undervoltage in power distribution systems. Analyzing the influence of different price forecasting schemes on nodal voltage is crucial. Here, we examine the voltage levels in the IEEE 141 distribution network under LSTM-Transformer and CNN-GRU-based dispatch to demonstrate the effectiveness of the proposed method.
Figures 11, 12 display the voltage variations throughout the day in the 141-node network under different price forecasting methods. A comparison between the two figures reveals that the proposed LSTM-Transformer method leads to relatively stable system voltage fluctuations. In Figure 11, the highest voltage magnitude is 1.067 p.u. on bus-32 at 19:00. Additionally, voltages on buses 13 to 32 and 114 to 141 exceed 1.05 p.u. between 18:00 and 19:00. Conversely, all nodal voltages fall within the range of 0.95 p.u. to 1.05 p.u., indicating an improvement in the voltage conditions of the distribution network.
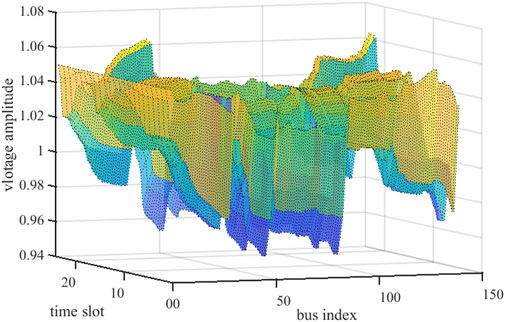
Figure 11. Voltage of IEEE 141-bus distribution network under CNN-GRU-based dispatch method.
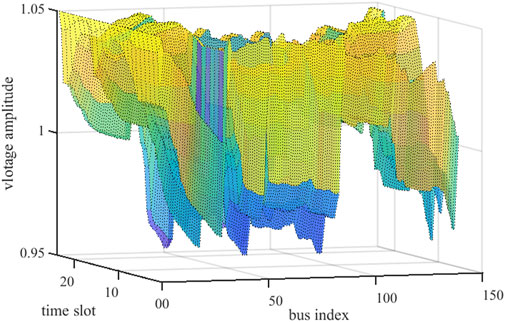
Figure 12. Voltage of IEEE 141-bus distribution network under LSTM-Transformer-combined dispatch method.
To assess the efficacy of secant line search in enhancing SSA’s convergence speed, we perform comparative experiments involving several methods, namely, SSA, PSO, CSO, and GWO. To compare the proposed method with state-of-the-art methods, the mentioned improved versions of SSA methods including ISSA, ESSA, and RSSA are also selected as the comparative methods. All methods are configured with identical parameter sets.
Figure 13 illustrates the convergence speed of the proposed data-driven SLS-SSA alongside other prominent biological population algorithms in solving VPP scheduling problems. The results demonstrate that all tested algorithms exhibit a rapid reduction in total cost within the initial 10 iterations. However, SLS-SSA shows superior convergence, achieving convergence after 37 iterations, which is notably faster than other methods. Additionally, the converged objective is significantly improved, with a reduction of 2.48% compared to SSA and CSO, 3.68% compared to PSO, and 7.50% compared to GWO. Besides, SLS-SSA also performs better on the convergence speed and accuracy compared to the three improved versions. This indicates the efficacy of the secant line search in identifying the global optimal point for the economic dispatch problem.
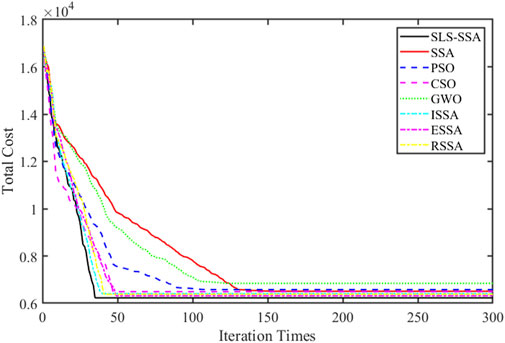
Figure 13. Convergence speed under different optimization methods.
According to the iteration times described in the previous part, SLS-SSA shows a great improvement compared to different methods. To further explore the computational effectiveness of the SLS-SSA, the averaged computational time to convergence of the comparative methods is listed in Table 4. It is observed that the average computational time used for convergence of SLS-SSA is the least than all comparative methods. It saves about 51.5% computational time compared to SSA. This is because the secant line search scheme can avoid the direct leap of discoverers in the original SSA and achieve an efficient location update. Besides, the iteration times needed to converge on SLS-SSA are much less than those of other methods, which can also save computational time. Moreover, SLS-SSA is more efficient than traditional nonlinear programming (NLP) solved by GUROBI or CPLEX. It is observed that the SLS-SSA is 6.64 times and 7.30 times faster than NLP-GUROBI and NLP-CPLEX respectively. Overall, SLS-SSA shows a better computational performance than the comparative methods.

Table 4. Average computational time for convergence of different methods.
The performance of the SLS-SSA is affected by the parameter settings. To explore the impact of population size on convergence performance, we conduct comparative experiments involving several population sizes, including 10, 50, 100, 200, and 300, respectively. The results are presented in Figure 14. It is observed that the number of iterations for convergence decreases with the increase of population size. Besides, the converged objective also decreases with the increase in population size. However, the decreasing speed of the objective is slow when the population size is big enough. The results indicate that a proper population size contributes to an efficient SLS-SSA.
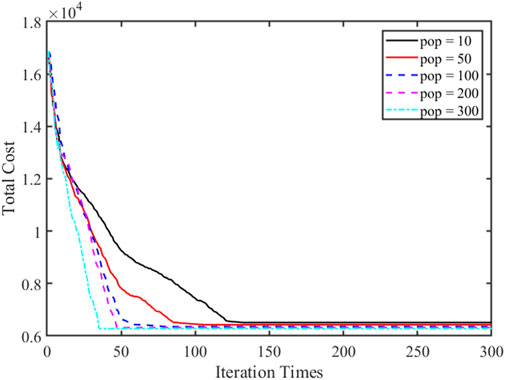
Figure 14. Convergence performance under different population sizes.
In conclusion, this research contributes to sustainability efforts by addressing challenges related to the integration of numerous distributed resources into the evolving power distribution system, with a focus on economic performance and voltage stability. By leveraging the prosumer role, the study underscores the effectiveness of VPPs in enhancing the flexibility and stability of the power distribution system. The adoption of VPPs emerges as a promising strategy for the coordinated management of distribution systems and distributed energy resources. The research introduces a data-driven price forecasting and SLS-SSA dispatching method for optimizing the day-ahead operation of PDS and VPPs. Through testing on IEEE-13 and -141 distribution systems, the numerical results confirm the effectiveness and efficiency of the proposed model and methodology, offering valuable insights for the development of cleaner and more sustainable energy supply infrastructure.
The raw data supporting the conclusions of this article will be made available by the authors, without undue reservation.
HW: Writing–original draft, Writing–review and editing. BF: Methodology, Writing–original draft. PY: Formal Analysis, Investigation, Writing–original draft. HS: Formal Analysis, Writing–review and editing. HM: Supervision, Validation, Writing–review and editing. WK: Conceptualization, Writing–review and editing. XP: Investigation, Visualization, Writing–original draft.
The author(s) declare that financial support was received for the research, authorship, and/or publication of this article. This work is supported by Science and Technology Project of State Grid Hebei Electric Power Co., LTD., under Grant 5204YF220007. (Research on source-storage resources aggregation and control technology for virtual power plant).
Author HW was employed by State Grid Hebei Electric Power Co., Ltd. Authors BF, HS, and HM were employed by State Grid Hebei Marketing Service Center. Author PY was employed by Electric Power Research Institute of State Grid Hebei Electric Power Co., Ltd.
The remaining authors declare that the research was conducted in the absence of any commercial or financial relationships that could be construed as a potential conflict of interest.
The authors declare that this study received funding from State Grid Hebei Electric Power Co., LTD. The funder had the following involvement in the study: study design, collection, analysis, interpretation of data, the writing of this article and the decision to submit it for publication.
All claims expressed in this article are solely those of the authors and do not necessarily represent those of their affiliated organizations, or those of the publisher, the editors and the reviewers. Any product that may be evaluated in this article, or claim that may be made by its manufacturer, is not guaranteed or endorsed by the publisher.
Alshehri, K., Ndrio, M., Bose, S., and Başar, T. (2020). Quantifying market efficiency impacts of aggregated distributed energy resources. IEEE Trans. Power Syst. 35, 4067–4077. doi:10.1109/TPWRS.2020.2979997
Bannavikarn, S., and Hoonchareon, N. (2021). “Solar power aggregation framework for virtual power plant’s energy trading,” in 2021 international conference on power, energy and innovations (ICPEI), 45–48. doi:10.1109/ICPEI52436.2021.9690673
Chen, M., Liang, Z., Cheng, Z., Zhao, J., and Tian, Z. (2022). Optimal scheduling of ftpss with pv and hess considering the online degradation of battery capacity. IEEE Trans. Transp. Electrification 8, 936–947. doi:10.1109/TTE.2021.3093321
Chowdhury, M. M.-U.-T., Biswas, B. D., and Kamalasadan, S. (2023). Second-order cone programming (socp) model for three phase optimal power flow (opf) in active distribution networks. IEEE Trans. Smart Grid 14, 3732–3743. doi:10.1109/TSG.2023.3241216
Churkin, A., Kong, W., Melchor Gutierrez, J. N., Martínez Ceseña, E. A., and Mancarella, P. (2024). Tracing, ranking and valuation of aggregated der flexibility in active distribution networks. IEEE Trans. Smart Grid 15, 1694–1711. doi:10.1109/TSG.2023.3296981
Fan, S., Liu, J., Wu, Q., Cui, M., Zhou, H., and He, G. (2020). Optimal coordination of virtual power plant with photovoltaics and electric vehicles: a temporally coupled distributed online algorithm. Appl. Energy 277, 115583. doi:10.1016/j.apenergy.2020.115583
Feng, C., Zheng, K., Zhou, Y., Palensky, P., and Chen, Q. (2023). Update scheduling for admm-based energy sharing in virtual power plants considering massive prosumer access. IEEE Trans. Smart Grid 14, 3961–3975. doi:10.1109/TSG.2023.3243811
Gao, J.-T., Shih, C.-H., Lee, C.-W., and Lo, K.-Y. (2022). An active and reactive power controller for battery energy storage system in microgrids. IEEE Access 10, 10490–10499. doi:10.1109/ACCESS.2022.3145009
Gao, Q., Yuan, Y., Zhu, J., Wu, H., and Luo, X. (2019). Optimal dispatching of virtual power plant considering hydrogen storage system, 1–5doi. doi:10.1109/APPEEC45492.2019.8994612
Ge, L., Liu, H., Yan, J., Zhu, X., Zhang, S., and Li, Y. (2022). Optimal integrated energy system planning with dg uncertainty affine model and carbon emissions charges. IEEE Trans. Sustain. Energy 13, 905–918. doi:10.1109/TSTE.2021.3139109
Gong, H., Rallabandi, V., and Ionel, D. M. (2019). “Load variation reduction by aggregation in a community of rooftop pv residences,” in 2019 IEEE power & energy society general meeting (PESGM), 1–4. doi:10.1109/PESGM40551.2019.8974029
Gough, M., Santos, S. F., Lotfi, M., Javadi, M. S., Osório, G. J., Ashraf, P., et al. (2022). Operation of a technical virtual power plant considering diverse distributed energy resources. IEEE Trans. Industry Appl. 58, 2547–2558. doi:10.1109/TIA.2022.3143479
Guo, Z., Wei, W., Chen, L., Dong, Z. Y., and Mei, S. (2021). Impact of energy storage on renewable energy utilization: a geometric description. IEEE Trans. Sustain. Energy 12, 874–885. doi:10.1109/TSTE.2020.3023498
Hong, N. N., Minh, Q. D., and Minh, P. V. (2023). “Two-stage optimal scheduling of virtual power plant with wind-photovoltaic-storage-electric vehicles in the day-ahead market,” in 2023 asia meeting on environment and electrical engineering (EEE-AM), 1–6. doi:10.1109/EEE-AM58328.2023.10394697
IEA (2024). Renewables 2023. Paris: IEA. Available at: https://www.iea.org/reports/renewables-2023 (Licence: CC BY 4.0)
Jalali, S. M. J., Ahmadian, S., Kavousi-Fard, A., Khosravi, A., and Nahavandi, S. (2022). Automated deep cnn-lstm architecture design for solar irradiance forecasting. IEEE Trans. Syst. Man, Cybern. Syst. 52, 54–65. doi:10.1109/TSMC.2021.3093519
Kong, W., Ye, H., Wei, N., Xing, D., Liu, S., and Chen, W. (2023). “Optimization of inter-regional flexible resources for renewable accommodation,” in 2023 5th asia energy and electrical engineering symposium (AEEES), 30–34. doi:10.1109/AEEES56888.2023.10114311
Ma, H., Yang, P., Wang, F., Wang, X., Yang, D., and Feng, B. (2023). Short-term heavy overload forecasting of public transformers based on combined lstm-xgboost model. Energies 16, 1507. doi:10.3390/en16031507
Massignan, J. A. D., Pereira, B. R., and London, J. B. A. (2017). Load flow calculation with voltage regulators bidirectional mode and distributed generation. IEEE Trans. Power Syst. 32, 1–1577. doi:10.1109/TPWRS.2016.2576679
Mohandes, B., Wahbah, M., Moursi, M. S. E., and El-Fouly, T. H. (2021). Renewable energy management system: optimum design and hourly dispatch. IEEE Trans. Sustain. Energy 12, 1615–1628. doi:10.1109/TSTE.2021.3058252
Moreno, G., Martin, P., Santos, C., Rodríguez, F. J., and Santiso, E. (2020). A day-ahead irradiance forecasting strategy for the integration of photovoltaic systems in virtual power plants. IEEE Access 8, 204226–204240. doi:10.1109/ACCESS.2020.3036140
Nguyen, T.-T., Ngo, T.-G., Dao, T.-K., and Nguyen, T.-T.-T. (2022). Microgrid operations planning based on improving the flying sparrow search algorithm. SYMMETRY-BASEL 14, 168. doi:10.3390/sym14010168
Padullaparti, H., Pratt, A., Mendoza, I., Tiwari, S., Baggu, M., Bilby, C., et al. (2023). Peak demand management and voltage regulation using coordinated virtual power plant controls. IEEE Access 11, 130674–130687. doi:10.1109/ACCESS.2023.3334607
Peng, H., Xiong, R., and Feng, T. (2022). A cloud–fog based adaptive framework for optimal scheduling of energy hubs. IEEE Trans. Industrial Inf. 18, 5681–5688. doi:10.1109/TII.2021.3133427
Pinheiro, D. d. C., Vieira, J. P. A., de Souza, V. M., de Souza, V. C., Barata, H. A., Costa, M. S., et al. (2022). Robust local inhibitor of reverse power tap changer runaway events in reconfigurable and active distribution networks. IEEE Trans. Power Deliv. 37, 813–822. doi:10.1109/TPWRD.2021.3071865
PJM (2024). Data Miner 2 — dataminer2.pjm.com. Available at: https://dataminer2.pjm.com/list (Accessed May 03, 2024).
Poudel, S., Mukherjee, M., Sadnan, R., and Reiman, A. P. (2023). Fairness-aware distributed energy coordination for voltage regulation in power distribution systems. IEEE Trans. Sustain. Energy 14, 1866–1880. doi:10.1109/TSTE.2023.3252944
Qiao, M., Yu, Z., Dou, Z., Wang, Y., Zhao, Y., Xie, R., et al. (2022). Study on economic dispatch of the combined cooling heating and power microgrid based on improved sparrow search algorithm. ENERGIES 15, 5174. doi:10.3390/en15145174
Wang, J., Zhang, F., Liu, H., Ding, J., and Gao, C. (2021). Interruptible load scheduling model based on an improved chicken swarm optimization algorithm. CSEE J. Power Energy Syst. 7, 232–240. doi:10.17775/CSEEJPES.2020.01150
Wu, R., Huang, H., Wei, J., Ma, C., Zhu, Y., Chen, Y., et al. (2023). An improved sparrow search algorithm based on quantum computations and multi-strategy enhancement. Expert Syst. Appl. 215, 119421. doi:10.1016/j.eswa.2022.119421
Xue, J., and Shen, B. (2020). A novel swarm intelligence optimization approach: sparrow search algorithm. Syst. Sci. Control Eng. 8, 22–34. doi:10.1080/21642583.2019.1708830
Yan, X., Gao, C., Song, M., Chen, T., Ding, J., Guo, M., et al. (2022). An igdt-based day-ahead co-optimization of energy and reserve in a vpp considering multiple uncertainties. IEEE Trans. Industry Appl. 58, 4037–4049. doi:10.1109/TIA.2022.3152454
Zhang, C., and Ding, S. (2021). A stochastic configuration network based on chaotic sparrow search algorithm. Knowledge-Based Syst. 220, 106924. doi:10.1016/j.knosys.2021.106924
Zhang, M., Xu, Y., and Sun, H. (2023). Optimal coordinated operation for a distribution network with virtual power plants considering load shaping. IEEE Trans. Sustain. Energy 14, 550–562. doi:10.1109/TSTE.2022.3220276
Zhao, Y., Liu, Y., Wu, Z., Zhang, S., and Zhang, L. (2023). Improving sparrow search algorithm for optimal operation planning of hydrogen-electric hybrid microgrids considering demand response. SYMMETRY-BASEL 15, 919. doi:10.3390/sym15040919
Keywords: data-driven, price forecast, LSTM-transformer, VPP, SSA, secant line search
Citation: Wu H, Feng B, Yang P, Shen H, Ma H, Kong W and Peng X (2024) Optimal schedule for virtual power plants based on price forecasting and secant line search aided sparrow searching algorithm. Front. Energy Res. 12:1427614. doi: 10.3389/fenrg.2024.1427614
Received: 04 May 2024; Accepted: 19 June 2024;
Published: 25 July 2024.
Edited by:
Yuqing Dong, The University of Tennessee, United StatesReviewed by:
Shunbo Lei, The Chinese University of Hong Kong, ChinaCopyright © 2024 Wu, Feng, Yang, Shen, Ma, Kong and Peng. This is an open-access article distributed under the terms of the Creative Commons Attribution License (CC BY). The use, distribution or reproduction in other forums is permitted, provided the original author(s) and the copyright owner(s) are credited and that the original publication in this journal is cited, in accordance with accepted academic practice. No use, distribution or reproduction is permitted which does not comply with these terms.
*Correspondence: Weile Kong, azE1MDAzMDQ4MjlAc3R1LnhqdHUuZWR1LmNu; Hao Ma, bWFoYW8zMzEzQHN0dS54anR1LmVkdS5jbg==
Disclaimer: All claims expressed in this article are solely those of the authors and do not necessarily represent those of their affiliated organizations, or those of the publisher, the editors and the reviewers. Any product that may be evaluated in this article or claim that may be made by its manufacturer is not guaranteed or endorsed by the publisher.
Research integrity at Frontiers
Learn more about the work of our research integrity team to safeguard the quality of each article we publish.