 R. Venkatesan1
 C. Kumar
94% of researchers rate our articles as excellent or good
Learn more about the work of our research integrity team to safeguard the quality of each article we publish.
Find out more
ORIGINAL RESEARCH article
Front. Energy Res., 30 July 2024
Sec. Smart Grids
Volume 12 - 2024 | https://doi.org/10.3389/fenrg.2024.1425412
Hybrid Renewable Energy Systems (HRES) have recently been proposed as a way to improve dependability and reduce losses in grid-connected load systems. This research study suggests a novel hybrid optimization technique that regulates UPQC in order to address the Power Quality (PQ) problems in the HRES system. The load system serves as the primary link between the battery energy storage systems (BESS), wind turbine (WT), and solar photovoltaic (PV) components of the HRES system. The major objective of the study is to reduce PQ issues and make up for the load requirement inside the HRES system. The addition of an Optimized Fractional Order Proportional Integral Derivative (O-FOPID) controller improves the efficiency of the UPQC. The Crow-Tunicate Swarm Optimization Algorithm (CT-SOA), an enhanced variant of the traditional Tunicate Swarm Optimization (TSA) and Crow Search Optimization (CSO), is used to optimize the control parameters of the FOPID controller. Utilizing the MATLAB/Simulink platform, the proposed method is put into practice, and the system’s performance is assessed for sag, swell, and Total Harmonic Distortion (THD). The THD values for the PI, FOPID, and CSA techniques, respectively, are 5.9038%, 4.9592%, and 3.7027%, under the sag condition. This validates the superiority of the proposed approach over existing approaches.
Renewable energy sources have increasingly acquired relevance as a result of concern about the exhaustion of fossil fuels as well as the consequences of continuous usage on the ecosystem (Naidu and Meikandasivam, 2020; Raziq et al., 2023). Photovoltaic (PV) as well as wind energy constitute the most often used forms of environmentally friendly energy. These sources of clean electricity are all quite variable due to their heavy reliance on outside variables, like sunlight and the wind. To lessen the effect of this variability, power storage techniques have been incorporated into systems that generate electricity from renewable sources, including BESS (Rawa et al., 2023; Zhou et al., 2022; Chaudhary et al., 2019).
Yet, there are several obstacles in combining HRES systems alongside load systems that are linked to the power grid. One of the major challenges is Photovoltaic (PQ) issues imposed on the system’s non-linear, critical, and unbalanced loads. These PQ problems can cause the systems to experience harmonics, voltage sags, and other disruptions. Such PQ uncertainties could have a substantial influence on the functioning and durability of the devices connected to the grid (Swapna and Gayatri, 2021; Goud and Rao, 2021; Cholamuthu et al., 2022). It is indeed essential to solve these PQ issues to guarantee that the HRES system functions dependably as well as efficiently.
The utilization of FACTS devices, as well as controllers, constitutes one of the most viable ways to increase PQ in grid-connected PV, wind, and battery systems (Jayasankar and Vinatha, 2016; Parija et al., 2019; Adefarati and Bansal, 2019; Amirtharaj et al., 2019). Power Electronics-based Flexible ac transmission system (FACTS) devices and controllers deliver swift and accurate control over a wide variety of electrical system characteristics, including voltages, current, but also power flow. They could boost the trustworthiness and dependability of the “grid-connected RES” and minimize PQ issues. The energy management system should be used efficiently (Ahmad et al., 2020a; Ahmad et al., 2020b).
One of the FACTS devices called the Unified power quality conditioner (UPQC) is found effective in reducing PQ issues including sag, swell, and harmonics. Combining two VSCs, one of which is coupled in series with the load and the other in parallel with the load, creates UPQC (Badoni et al., 2023; Berbaoui et al., 2020; Chakravorti et al., 2019; Elkholy, 2019). The shunt VSC is employed to account for harmonics and reactive power, and the series VSC is employed to account for voltage sag and swell. Unified power quality conditioner (UPQC) is a flexible and effective tool for enhancing PQ since it can concurrently address several PQ faults (Elmetwaly et al., 2020; Goud and Rao, 2020).
A variety of controllers are a suitable addition to UPQC to boost the efficiency of FACTS devices. FOPID is one such controller. The Fractional order proportional integral derivative (FOPID) controller serves as a more sophisticated modification of the traditional PID controller that offers improved performance of the controller in non-linear and dynamic environments. For controlling PQ concerns in grid-connected PV, wind, and battery systems, FOPID controllers could offer higher resilience, precision, and consistency.
The effectiveness of UPQC equipment has been enhanced using FOPID controllers (Hossain et al., 2019; Khalid et al., 2020; Lakshmi and Ganguly, 2019). FOPID controllers can perform better in system dynamics as they’re more adaptable than traditional integer-order controllers. For the UPQC devices to operate at their best, the FOPID controller’s settings must be optimized. The optimization process could be laborious and costly in terms of computing Litwin et al. (2020). To speed up the optimization process, hybrid optimization methods can be developed. A cell’s capacity as a function of its rated capacity is shown by the state of charge (SOC) of the cell. The SOC’s value ranges from zero to one hundred percent. A totally discharged cell is said to have a SOC of 0%, whereas a fully charged cell is said to have a SOC of 100%. The cell is recharged when the SOC hits 50% since in real-world applications the SOC cannot get over 50%. Similar to how a cell ages, the maximum SOC gradually drops. This indicates that a 100% SOC for an old cell would be similar to a 75%–80% SOC for a young cell.
With the decreasing supply of fossil fuels as well as the requirement to minimize greenhouse gas emissions, the integration of RES into the grid system has grown increasingly crucial (Ma and Javed, 2019; Mahela et al., 2020). Yet, the effectiveness a dependability of the power grid can indeed be significantly impacted by power quality concerns related to the grid system’s adoption of RES. To enable the seamless incorporation of clean energy into the grid system, it is indeed crucial to address power quality issues.
This research’s primary contribution is:
• This study introduces a groundbreaking approach aimed at addressing PQ challenges within grid-connected HRES. The novelty lies in the integration of a UPQC with an Optimized FOPID controller. The primary objective is to enhance the performance and efficiency of the HRES by resolving PQ issues through a unique strategy.
• Furthermore, the research introduces a novel hybrid optimization algorithm, named CT-SOA, specifically designed for optimizing the parameters, including those of the FOPID controller. This hybrid model combines the strengths of the traditional Tunicate Swarm Algorithm (TSA) and Crow Search Algorithm (CSO), resulting in an enhanced and more efficient optimization process. By amalgamating these two algorithms into the CT-SOA, the study introduces a novel and advanced optimization technique, contributing to the overall innovation in addressing PQ issues in grid-connected HRES.
The manuscript is organized as follows: The most current findings on power quality control issues are provided in Section 2. The suggested solution for PQ issue mitigation in grid-connected HRES is discussed in Section 3. In Section 4, a detailed summary of the outcomes obtained using the suggested model is presented. Section 5 winds up the paper.
Naidu and Meikandasivam (2020) used FACTS-based DPFC for resolving the PQ issues in the grid-connected HRESs. FOPID controllers as well as coordinated power quality theory have been employed in the recommended solution, which employs a DPFC based on FACTS technology. The DPFC’s series and shunt controllers effectively eliminate the PQ issues. The researchers used computer-aided design and simulation methods when conducting a test case to determine the viability of their recommended solution.
Raziq et al. (2023) developed a hybrid MMLC for resolving the power generation issues that were generated owing to the varying shading conditions in PV systems. Less IGBT switches were required with hybrid MMLC in this study to obtain the very same set of available levels, thereby reducing losses and increasing voltage output. The converter configuration joins half-bridge and full-bridge cells in both series and parallel to boost power output. Without the use of active or passive filters, the converter effectively handled the issues related to voltage, current, and power quality.
Rawa et al. (2023) employed the DVR series compensator, to study the effects of RESs like PV and wind farm systems on voltage quality and harmonic analysis. The researchers of this work employed a PI controller with GTA to operate the DVR as well as compute the proportional gain of the controllers during different PQ challenges. The study examines two switching states, such as the on and off-grid mode, both of which have sizable PV, wind, and nonlinear loads. The analysis is made to achieve an ideal result and utilize the power of the available DVR.
Chaudhary et al. (2019) have used Superconducting magnetic energy storage (SMES) and Battery energy storage (BES), in the distributed Hybrid energy storage system (HESS) to resolve the PQ issues. The BES was chosen to control the LVDC microgrid’s unpredictable output power generated by RES and load changes. The low-voltage DC microgrid has been linked to a medium-voltage system using an Energy-storage composited DC transformer (ESDCT) based on SMES. Through simulation and weighted experiments, the effectiveness of the system has been confirmed.
Swapna and Gayatri (2021) used DVR with Hybrid energy storage, to provide compensation in grid-connected PV-Wind producing units. For persistent errors, this method offered quick and immediate resolution. Using experimentation, a variety of mixed voltage sag/swell issues resulting from source disruptions, voltage instability generated by both symmetrical and asymmetrical fault states in distribution, and other situations were evaluated.
Goud and Rao (2021) presented ASO with UPQC, to address the PQ issues in an HRES system. To improve the UPQC’s effectiveness, an ASO-based FOPID controller was employed to minimize PQ issues. Using experimentation, the efficacy of the recommended approach was evaluated. To test the functionality of the presented approach in three various situations, including Sag, Swell, and interruptions, THD was studied.
Cholamuthu et al. (2022) introduced a new hybrid series active power filter to address voltage-related PQ issues. This filter provided grids of expected voltage in parallel for reducing harmonics generated by nonlinear loads. This one was recommended to use an ANFIS controller and a reduced active filter rating to produce a reference voltage signal. The simulation was performed to prove the effectiveness of the suggested approach.
Jayasankar and Vinatha (2016) suggested a unique grid-interfacing inverter for RES that functions as a shunt active filter to solve issues with power quality and energy constraints. A shunt active filter with grid integration for renewable energy has also been recommended. An appropriate control was given to give the grid-interfacing inverter the capacity to improve power quality. By replacing the conventional PI controller with a fuzzy model, the system’s efficiency was enhanced.
Parija et al. (2019) provided an assortment of wind and solar power-producing installations as a workable as well as consistent energy source, to solve the PQ issues. This research offered a hybrid version combining PV and wind systems. Particularly in remote or island sites, where grid connectivity was not particularly expensive, this kind of arrangement was beneficial. Substantial PQ problems, like harmonic generation and reactive power correction, caused either by the connection of power electronic equipment to DG systems interrupted the power distribution system. The performance of a 750 kW hybrid wind-PV producing system in grid-connected mode was assessed using simulation.
HRES are progressively becoming incorporated into the power system, generating serious concerns about the grid’s reliability and power quality. It is challenging to keep up an uninterrupted as well as reliable grid due to the uncertainty of HRES. A multitude of PQ issues is also brought on by the existence of non-linear loads in the grid. These problems on the power grid affect the operation of related equipment and cause significant monetary losses. Thus, it is indeed crucial to develop suitable techniques to lessen the power quality issues caused by the grid incorporating energy from renewable sources. Active filters, static synchronous compensators, and UPQC are indeed a few of the techniques that have been employed in several types of research to improve power quality.
The development of much more reliable and efficient methods of control for the UPQC in grid-connected HRESs is necessary. Although the UPQC has been demonstrated as an efficient way to decrease a variety of PQ issues, it is conceivable that not every operating parameter can indeed be managed to meet the prevailing control techniques, which could additionally result in enhanced performance concerning effectiveness and predictability. How and when to create a composite system that combines several RES, including PV, wind, and battery, whilst preserving the maximum possible power quality, is yet another topic of research that might have to be tackled. Although numerous studies have studied the effectiveness of different solar and wind farms and their incorporation into the grid, it is necessary to conduct more in-depth studies that take into account the interconnections between diverse energy sources and their impact on power quality.
To evaluate how effectively power quality enhancement techniques, work in real-world circumstances, a further experimental investigation is also necessary. Even though many studies have been introduced using computational methods to evaluate the effectiveness of power quality enhancement techniques, it is indeed vital to confirm these results with practical testing to ensure that the techniques can be applied satisfactorily in practical settings. However, there remain significant research gaps throughout the area of PQ improvement in grid-connected HRESs using UPQC that need to be filled. These gaps include:
• Research on the ideal location and dimension of UPQC in HRES connected to the grid is lacking.
• Research on UPQC in HRES that are linked to the grid is scarce.
• There has not been much focus on integrating BESS with UPQC to enhance power quality in grid-connected HRES.
• Inadequate information is known about how UPQC performance in HRES that are connected to the grid is impacted by uncertainty in RES.
To solve these limitations in the existing literature, the present investigation suggests an ideal hybrid model of HRES that combines wind, solar, and BESS with UPQC. The suggested framework would employ a sophisticated control strategy to improve UPQC, as well as its efficacy will indeed be evaluated in connection to the impacts of uncertainty in energy supply from renewable sources.
Due to technological advancements, emerging environmental awareness, and increased electricity demand, DG has been depending more and more on RES. Economic advantages come from RES-based DG, which also reduces pollution and global warming. Many RESs have been incorporated into traditional electrical networks, including wind, PV, FC, and biomass. Integrating these into the electrical grid has been challenging due to their special characteristics, including DC voltage in PV and either AC or DC production in offshore wind.
The output power from RESs is typically unstable due to shifting climatic conditions, demanding the usage of electrically powered devices to regulate and optimize power production. Electrical converters for power, which can modify the DC voltage levels of all DC voltage sources, connect them to the electricity network by using DC-AC inverters. Regrettably, this might lead to PQ issues including harmonics, as well as voltage sags/swells. To tackle PQ issues in grid-connected hybrid HRESs, FACTS devices are needed. The UPQC is a helpful instrument for bettering voltage management and resolving PQ issues in grid-interfaced HRESs.
Using an enhanced FOPID controller could significantly improve the administration of the UPQC in addition to minimizing PQ in grid-connected HRES. By tweaking the FOPID controller’s setting for proportional gain, integral gain, derivative gain, and fractional-order, PQ problems in grid-connected HRESs could well be minimized. As a result, this research effort presents a revolutionary HRES with a grid interface that includes UPQC as well as an enhanced FOPID controller. The structure of the suggested model is shown in Figure 1.
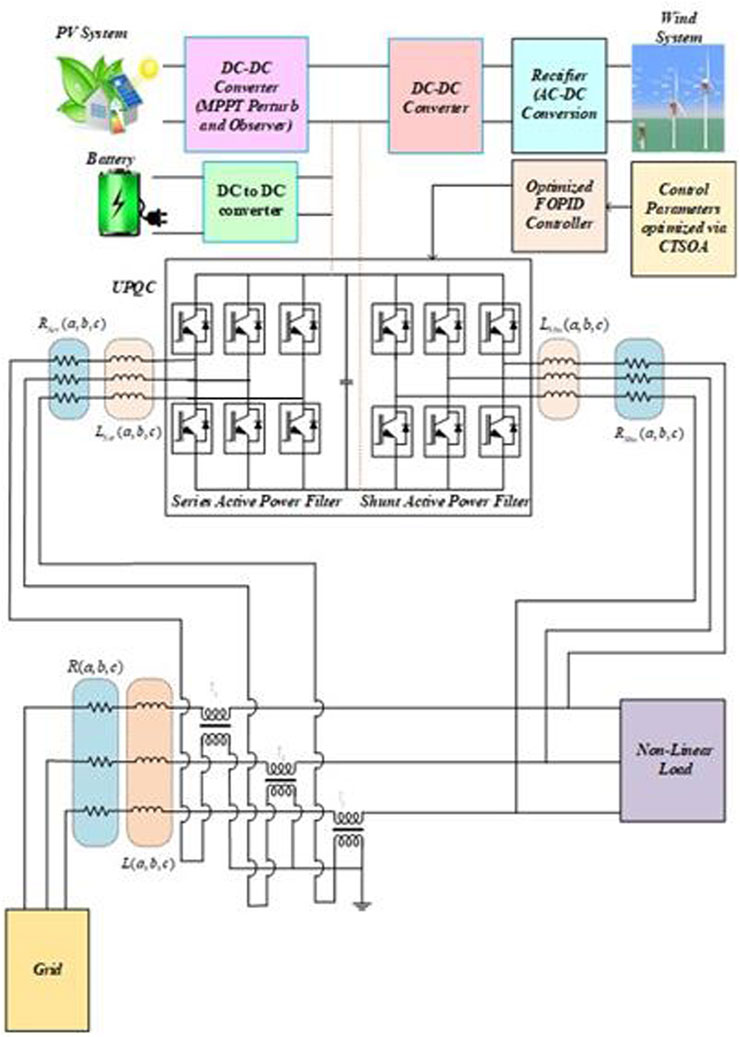
Figure 1. JPEG.
Figure 1 shows a grid-connected HRES with solar PV, Wind turbine, and storage components. The batteries have been typically utilized to store the excess energy produced by the PV and WT systems as well as to supply backup power. To meet the needs of the customer demand, RES is used. The prevalent problem with grid-connected HRES is maintaining stability and reliability, which necessitates addressing problems with power quality. A UPQC is used with HRES technology to handle PQ concerns, such as sag, swell, and interruption. To correct PQ issues, the UPQC employs control mechanisms both in series and shunt. The ideal gain values for the filters, which infuse critical power to account for sag and swell circumstances, are chosen using the FOPID controller.
A novel hybrid approach of optimization is proposed to optimize the FOPID control settings. The CSO, as well as the TSO, have been combined in the suggested hybrid optimization paradigm. Energy storage, a crucial component of HRES, provides electricity to meet load requirements whenever the system’s power supply becomes inadequate. The battery’s capacity can be estimated by the reference autonomy day
This assessment ensures that the batteries have been designed to provide adequate power for the system even when sources of renewable energy are not always capable of satisfying demand. The autonomy day (
Where,
To increase the stability of the system, it is vital to solve these power quality issues. To do this, the HRES system may incorporate a UPQC device. Eq. 3 mathematically illustrates the SoC.
Past developments have witnessed a substantial increase in interest in RESs due to concerns about ecological responsibility as well as the requirement to decrease emissions of greenhouse gases. As a consequence, it has grown increasingly typical to include RES in conventional power networks. Several types of RES, PV systems, WTs, and batteries are frequently used throughout HRESs to produce power as well as satisfy the needs of the world’s load. This study explores the properties of PV, WT, and batteries in HRES as well as their possibility for producing green technology.
PV systems are a kind of renewable energy system that uses photovoltaic cells to transform solar energy into electrical energy. To generate the necessary voltage and power output, photovoltaic cells are coupled in series or parallel with these arrangements. Semiconducting components, like silicon, are used to create the cells, which absorb light and produce an electrical current. The condition of the PV cells, the elevation, and orientation of the solar panels, as well as the number of sunrays collected, are only a few of the variables that influence the efficiency of a PV system. A PV system’s electricity production is directly related to the amount of sunrays it receives, which might change according to the moment of the day and the temperature. As the PV system’s power production fluctuates with time, storage mechanisms for energy must be incorporated into HRESs to provide a steady supply of electricity.
The two operational options for PV systems are stand-alone and grid-connected. For independent applications or off-grid uses like electricity production, telephony, and pumping systems, PV systems can function in self-contained operation. For electricity during times of low or no sunshine, such installations often employ batteries or even other forms of energy storage to preserve extra electricity created throughout maximum solar hours. To supply backup generators for many days in the event of inclement weather or even other situations, the batteries must be able to match the load requirement. While operating in grid-connected mode, PV systems transmit the extra power they produce during the sun’s peak times immediately into the grid system (Raj and Chandrasekaran, 2020; Xavier et al., 2021). As the grids function as a virtualized storage solution, these devices are not dependent on battery packs or other power storage equipment. Grid-connected PV systems have been impacted by several technological, financial, and governmental challenges Kandasamy et al. (2022). The decrease in energy efficiency represents the most severe problem of all. Figure 2A shows the PV system’s design.
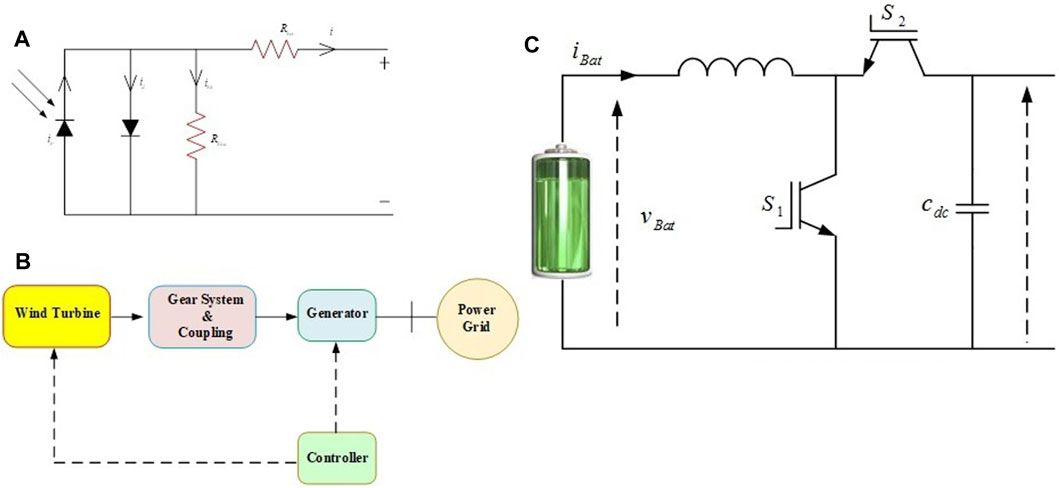
Figure 2. (A) PV System design, (B) Schematic block of wind turbine, (C) Structure of BESS.
An approach to figure out the endpoint current and voltage readings of the planned PV panel is provided by Eqs 4, 5, respectively. These formulas accommodate some variables, including the amount of solar irradiation, the panel temperature, the panel’s highest point of power, and the panel’s series resistance. These calculations can be applied to compute the current and terminal voltage values for the specified PV panel design, which would be crucial for determining the general effectiveness of the HRES system.
The energy produced by the PV panel can be calculated using Eq. 6. It incorporates several factors, including the transistor ideality element
The number of cells inside the PV system

Table 1. Hybrid parameters.
Systems that transform wind power into electrical power are termed wind turbines. The components of a conventional wind farm are rotors hooked to a shaft and a generator that transforms the mechanical power of the rotor into electrical energy. The HAWT, which seems to have blades that revolve around a horizontal axis, constitutes the most prevalent kind of wind turbine Kumar et al. (2022). The generator that generates AC energy is driven by the blades’ spinning action. According to the amount of electricity, they have been intended to produce, wind turbines can indeed be built offshore or onshore and are available in an assortment of configurations. A WT system’s generated power is inversely correlated with airspeed and blade diameter. The electricity production of the WT system may well be impacted by the wind direction, which can change according to the spot and the time during the day Murshid and Singh, (2019). In addition, other environmental elements including air pressure, roughness, and severe turbulence can all affect the electrical output of a WT system. To account for variations in wind speed, it might be necessary to put up many wind turbines of different elevations and dimensions. Figure 2B shows the conceptual circuit diagram of a wind generator.
Using Eq. 7, which contains the measured wind production energy and wind velocity symbolized by symbols
Batteries are indeed a crucial part of HRESs because they offer energy storage to compensate for variations in RES electricity production. Throughout times when demand is low, the extra energy created by RESs is capable of being utilized to recharge the battery; and when demand is greatest, it is possible to employ it to drain battery packs. If there is a high power demand or when sources of clean energy are not accessible, batteries may be used to retain surplus electricity created by these technologies and discharge it. Batteries may be employed to balance energy costs during times when demand is greatest or to supply power backup during power failures. The kind of battery chemistry employed, the charging and discharge cycles, and the temperature difference all affect a battery’s performance as well as longevity. Lead-acid, lithium-ion, and flow batteries are indeed the three batteries that are used in HRESs frequently. The much more popular batteries right now are lithium-ion batteries with increased density of energy, extended durability, and little maintenance requirements. In Figure 2C, the BESS model is displayed. The battery capacity is determined using Eq. 10.
where,
The diagram displays various symbols used in the computation of the battery’s capacity, such as Cb for capacity,
Including PV, WT, and battery packs in HRESs could offer a dependable and environmentally friendly power source. Energy storage facilities may offer a consistent power source throughout periods with low RES output, and the usage of various RESs can accommodate variations in energy capacity. In HRESs, electrical devices like DC-AC inverters may be deployed to link the PV and WT systems to the electricity network. It is possible to combine the electricity generated by the RESs and feed it into the national grid or utilize it to power nearby loads. Equipment for storing energy can indeed be utilized to hold extra power generated while demand is not high and released when demand exceeds supply. Smart control mechanisms may decrease power losses while ensuring the best performance of RESs and systems for storing electricity.
In the grid-connected HRES, the UPQC is an electrical device for power that is also frequently employed to reduce PQ issues. The UPQC technology is intended to address a variety of problems with power quality, including voltage sag, swell, harmonics, and flicker, which might take place because of grid or HRES-related disruptions. Two power converters help compensate the UPQC: “a series converter (SC) and a shunt converter (SHC)". The SC, which itself is intended to make up for power irregularities, is linked in series with the load. The SHC, which is used to account for present abnormalities, is linked in a pair with the load. At the PCC, in which the HRES is interconnected to the grid, the UPQC controls both voltage and current. Several control approaches, including PI, PR, and FLC are used to simulate the UPQC. The current and voltage at the PCC are intended to be regulated to the desired levels using these methodological approaches. The control strategy used has been determined by the system’s unique needs as well as any issues with power quality that need to be addressed. The creation of several formulae to explain the performance of the UPQC under different operation situations is a necessary step in the modelling of the UPQC. These formulas have been applied to the conceptualization and operational evaluation of UPQC’s control scheme. The behaviour of the UPQC being simulated under multiple power quality states using the UPQC model, as well as its efficacy in reducing power quality issues is assessed. Therefore, creating a reliable and effective grid-connected HRES requires careful consideration of the modelling of the UPQC. The UPQC is indeed a crucial part of the HRES because of its capacity to reduce voltage stability issues while maintaining the system stable. The basic model of UPQC is shown in Figure 3A.
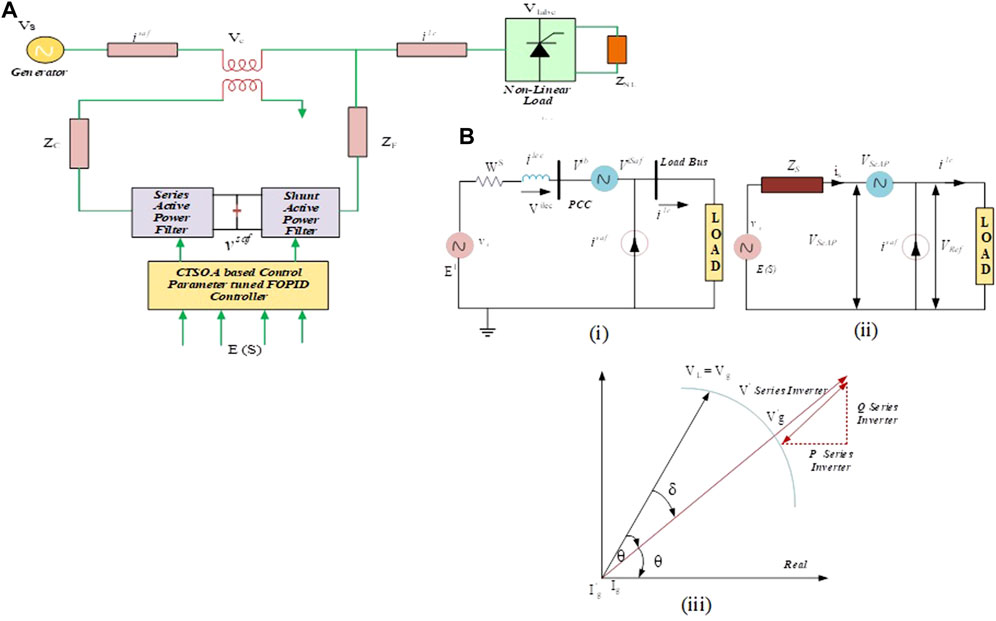
Figure 3. (A) Basic model of UPQC, (B) UPQC compensated system (i) Equivalent circuit model of UPQC, (ii) UPQC-PQ circuit, and (iii) Vector diagram for voltage compensation.
The UPQC system, elucidating the structure and operation of its DC link element and associated compensators. It emphasizes the suitability of Voltage Source Converters (VSCs) for this purpose due to their advantages, such as requiring fewer electrical components, offering control flexibility, and supporting multi-level operation. The structural block diagram and equivalent circuit of the UPQC are presented in Figures 3A, B. The described equations detail the relationship between the source grid voltage, series compensation voltage, shunt compensated current, and load current, revealing the intricate interactions within the system. The focus is on minimizing harmonic content in the injected current by the shunt compensator.
In this part, the mathematical model of UPQC for the mitigation of power quality issues is given. The power supply system, series active filter, and shunt active filter are the three primary components of the proposed model. Kirchhoff’s law is indeed the foundation for the mathematical modelling of the power supply system, as demonstrated in Eqs 11, 12 below. These equations describe the different components of the power system, including the shunt active filter output current
In Figure 3B, the UPQC compensation system is portrayed as a sophisticated solution designed to address challenges arising from unfavourable power conditions within the broader power system. Its primary objective is to actively regulate and enhance power quality by manipulating both source current and load voltage. The system achieves this through the integrated use of series and shunt active filters. Notably,
Figure 6C introduces a vector diagram illustrating the UPQC-PQ system’s voltage compensation mechanism. This visual representation offers a clear understanding of how the UPQC actively manages voltage conditions. Notably, in situations of over-voltage
By using Eq. 14, it is possible to solve the above equation.
Eq. 15 describes the current on the PCC side, assuming that the power requirement of the active power and load is equal to the PCC input, and neglecting losses in the UPQC-PQ design.
Eq. 16 and 17 provide formulations for the apparent power of the series and shunt active power filters in the UPQC.
where
In practical terms, this assumption allows for focusing specifically on the reactive power aspect of the series filter’s apparent power. By neglecting the active power, the computation of
HRES have been adopted recently to address the increasing energy demand brought on by industrial development while reducing greenhouse gas emissions. Nevertheless, while incorporating HRES into grid-connected networks, problems with dependability and power efficiency appear. The UPQC-PQ system is employed to enhance power quality to handle these difficulties. Using a control scheme along with a FOPID controller and CT-SOA boosts the effectiveness of HRES. Two controllers, “series APF and shunt APF”, are part of the UPQC-PQ system and serve as a tool to address problems with power quality. Series and shunt active power filtering are both covered in-depth in this article.
The reference voltage must be measured initially before the DQ transformation technique translates it into the D-Q axis. This approach frequently makes use of power filters to monitor UPQC-PQ and deal with systemic power quality concerns. A schematic Representation of Series APF is illustrated in Figure 4A. The first step is to measure the reference voltage, which is then converted into D-Q axes using the “DQ transformation method”. Power filters are commonly used in this method to monitor UPQC-PQ and address PQ issues in the system.
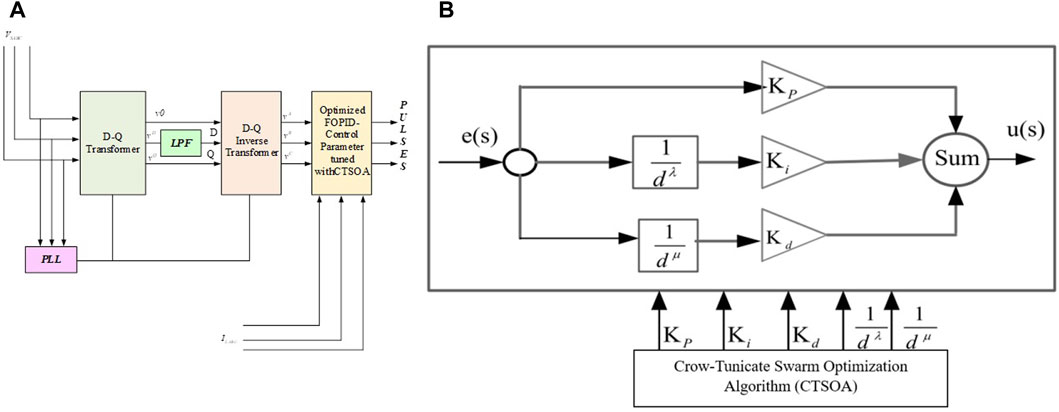
Figure 4. (A) Schematic Representation of series Active Power Filter (B) Optimized FOPID Controller.
Eq. 18 relates the direct axes voltage
Direct voltage and alternating component voltage together make up the D-axis voltage. It is possible to use an LPF to smooth the D-axis voltage. Eq. 19 provides the mathematical expression for the LPF.
Eq. 19 defines
Eq. 20 uses
Eq. 21 and 22 are used to convert the “three-phase currents and voltages” into a and b, as shown below,
This calculation is based on the phase neutral currents
The reference currents are then calculated using Eq. 24 based on the previously computed real and reactive powers.
Due to the rising need for sustainable energy, it is now more crucial than ever to integrate energy from renewable sources into the grid. Nevertheless, electrical and electrical disturbances frequently affect these systems’ PQ, which can result in decreased effectiveness and performance Raj et al. (2023). A FOPID controller is suggested as a solution to all of these challenges. In comparison to traditional controllers, like PI and PID, the FOPID controller has five parameters and can deliver greater gain values. Also, the “optimized FOPID controller” can be applied to electrical systems to reduce voltage sag, voltage swell, harmonics, and flicker. The controller can reduce erroneous signals, fix the issues with signal undershoot and overshoot, and quicken reaction times. The effectiveness of different power system components, including the UPQC, DG systems, and RES systems, can be enhanced by using the optimized FOPID controller. The CT-SOA approach is used to get the best gain values and by sending the FOPID controller the best possible pulses, the CT-SOA approach lowers the voltage and current error values. The FOPID controller is employed to regulate the series and shunt APF of the UPQC device and, therefore serves to enhance the performance of the HRES system by minimizing the PQ issues. Figure 4B depicts the architectural layout of the proposed O-FOPID controller.
The FOPID controller is capable of minimizing the error voltage as well as the error current. This is essential for maximizing production and controlling the HRES system. Overall, the suggested CT-SOA approach offers a successful means of reducing PQ issues in HRES interface grid-connected systems. It helps to increase the system’s effectiveness and efficiency and provides substantial advantages over conventional controllers.
In HRES, Eq. 25 shows the transfer function of the FOPID controller is indicated as
The hybridization of TSA and CSO offers a powerful optimization framework for addressing power quality issues in grid-connected HRES. This approach synergizes TSA’s effective exploration and CSO’s exploitation capabilities, resulting in improved convergence, adaptability to dynamic environments, and increased solution diversity. The proposed hybrid optimization model, CT-SOA, optimizes parameters, including those of the FOPID controller. This integrated optimization ensures precise tuning of FOPID controller parameters, contributing to enhanced system performance by mitigating voltage sag, swell, and THD in power systems. The balance between exploration and exploitation, coupled with the adaptability to dynamic conditions, positions the hybrid CT-SOA as a promising solution for achieving optimal and robust power quality improvements.
The control parameters of the FOPID controller, such as
Step 1. Initialization
The first step of the CT-SOA model is initializing the input parameters. Here the input parameters are the control parameters of the FOPID controller, such as
Step 2. Generic Randomization
In this step, this step involves the random generation of the input parameters.
Step 3. Fitness Evaluation
Evaluate the fitness function, denoted as
Step 4. Generate a new location for each crow in the search space
Create a new position in the d-dimensional search space for each crow. Given that a crow randomly follows a crow
Case 1. In the first scenario, crow
To align with the objective of improving Power Quality (PQ) in Hybrid Renewable Energy Systems (HRES), the Crow Search Optimization’s (CSO) Case 1 scenario parallels the complex optimization needs of HRES components such as wind turbines, solar panels, and battery storage systems. Each “crow” in CSO represents a control parameter crucial for optimizing the Unified Power Quality Conditioner (UPQC) through strategies like the Optimized Fractional Order Proportional Integral Derivative (O-FOPID) controller. CSO’s Case 1, where a crow adjusts its position without awareness of others, mirrors the need for dynamic parameter adjustments in HRES to mitigate PQ issues like sag, swell, and Total Harmonic Distortion (THD). This adaptive exploration within CSO enables the discovery of optimal control configurations, essential for maintaining stable and efficient power output in grid-connected environments, thereby enhancing the overall reliability and performance of HRES under diverse operational conditions.
Case 2. Crow
In Case 2 of Crow Search Optimization (CSO) within the context of Hybrid Renewable Energy Systems (HRES), consider a scenario where a crow adjusts its position based on knowledge of another crow’s location, symbolizing an informed adaptation strategy in optimizing system performance. In the area of HRES, this can be likened to leverage historical data or predictive analytics to refine control parameters of components such as wind turbine (WT), solar photovoltaic (PV) panels, and battery energy storage systems (BESS). By incorporating insights gained from past performance or anticipated environmental conditions, CSO’s Case 2 facilitates targeted adjustments in the settings of controller. This approach aims to preemptively address PQ issues such as voltage fluctuations or harmonic distortions, optimizing system efficiency and reliability in delivering high-quality power to the grid. Thus, Case 2 of CSO plays a crucial role in enhancing HRES operational resilience by strategically adapting control parameters based on data-driven insights, thereby ensuring robust performance under varying load and environmental conditions.
Step 5. Eliminating Disputes between Search Agents
To avoid the conflicts between search agents (crows) (i.e., between crow
Therefore,
The calculation of the vector
Where,
Step 6. Convergence toward the most Efficient Search Agent
The search agent (crow
where
Step 7. Determining the viability of each crow’s new position:
Change the crow’s position if possible, and it is not updated in any other case.
Step 8. Re-evaluate fitness:
Figure out each crow’s fitness value in their new place.
Step 9. Updating each crow’s memory matrix:
The memory matrix of each crow is updated as per Eq. 34.
Step 10. Return to the Best Position
The best position of the Search agent is finally returned after the completion of the maximum number of iterations. The pseudocode of the proposed CT-SOA algorithm is shown in Algorithm 1.
Algorithm 1.Pseudocode of proposed CT-SOA Algorithm.
Pseudo-code of proposed CT-SOA Algorithm
Step 1 Start
Step 2 Population Initialization
Step 3 Parameter initialization
Step 4 Fitness Evaluation,
Step 5 Generation of New location Case 1: Update position using Eq. 27
Step 6 Elimination of Disputes
Step 7 Update position based on Eq. 29
Step 8 Convergence of solution
Step 9 Update the solution with the most efficient search agent using Eq. 33
Step 10 Evaluate the viability of solutions
Step 11 Re-evaluate fitness
Step 12 Update the memory of the crow using Eq. 34
Step 13 Output the best solution
Step 14 Terminate
The proposed model for PQ improvement using UPQC with an optimized FOPID controller has been implemented using the MATLAB Simulink 2022b model with the RAM of 16 GB. Figure 5A depicts the simulation model for the suggested work. The suggested framework was evaluated using sag, swell, and THD analysis. By incorporating voltage sag and swell instances, the suggested model was contrasted with existing approaches including PI Bilgundi et al. (2020), FOPID Devi and Suresh Kumar (2021), TSA Kaur et al. (2020), and CSO Askarzadeh (2016), where the voltage source, load voltage, and load current are detected as independent indicators. Voltage was investigated about time in seconds. Table 2 shows the system specification. Table 3 depicts the parameters for an optimized Fractional Order PID (FOPID) controller, which include the proportional gain
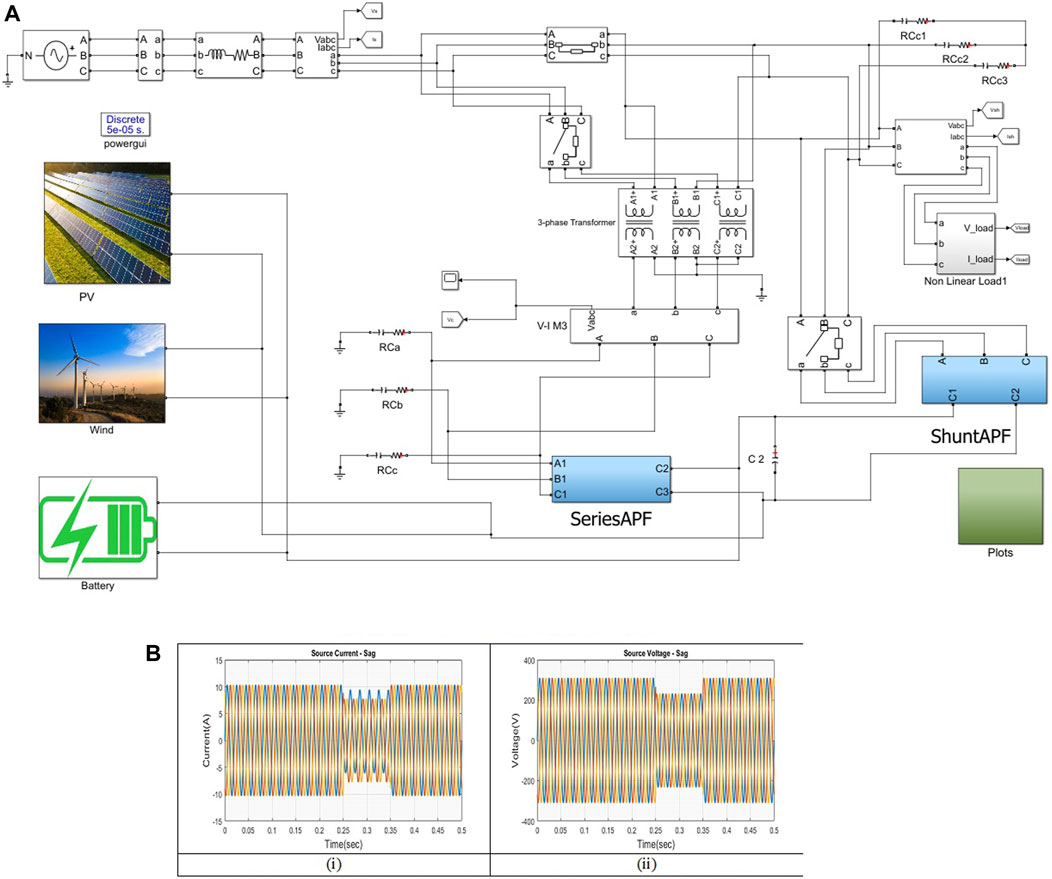
Figure 5. (A) Simulation Model of the proposed system, (B) Supply current and voltage analysis, (i) Supply Current, and (ii) Supply Voltage.

Table 2. System specification.
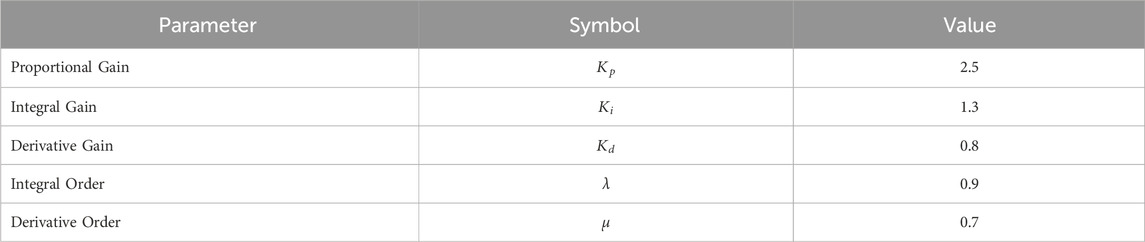
Table 3. Parameters of O-FOPID controller.
In a power system, sag can cause system breakdown, reduce the effectiveness of the system, and shorten system life.
Figure 5B depicts the source current and voltage during the sag phase. Sag occurs at intervals of 0.25–0.35 s.
C Compensator current and voltage outcomes for various techniques like PI, FOPID, CSA, TSA, and the suggested approach are depicted in Figures 6, 7, respectively. From the comparative analysis, the achievement of the suggested approach is seen as superior to the traditional methods.
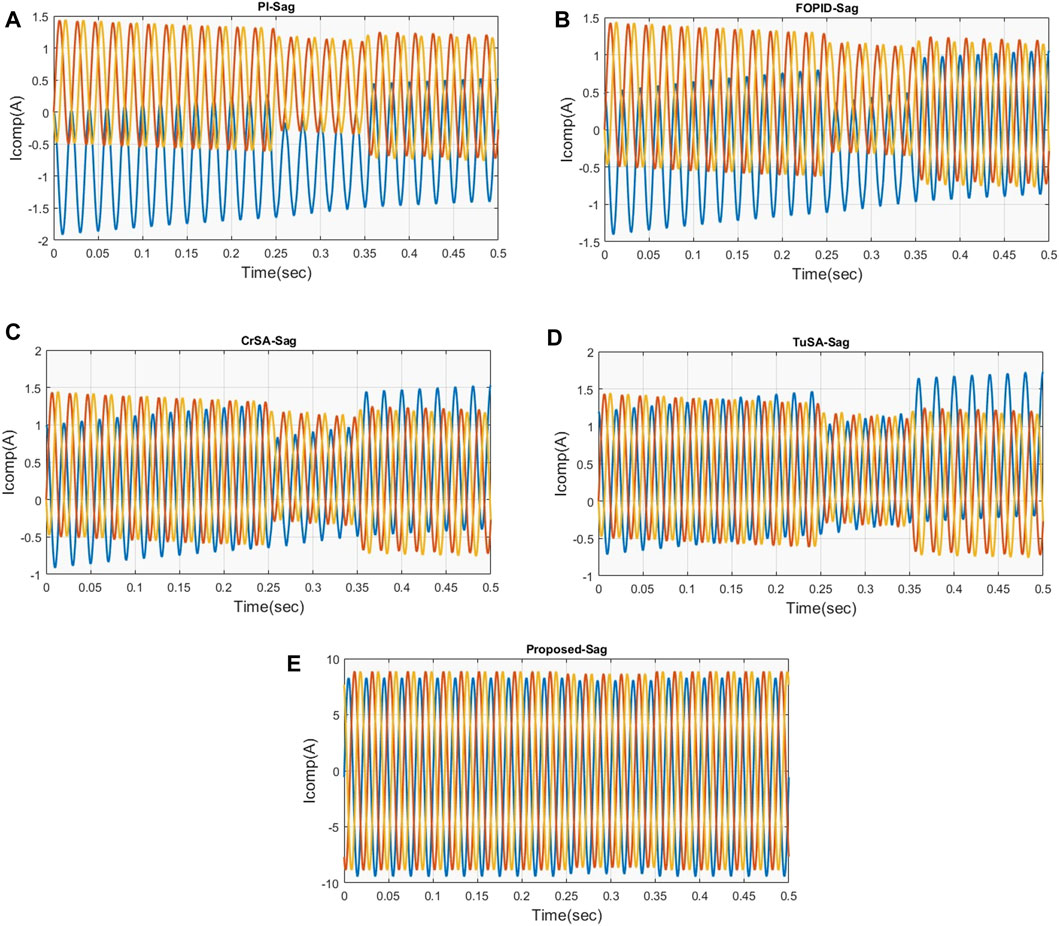
Figure 6. Compensator current waveform for various techniques.
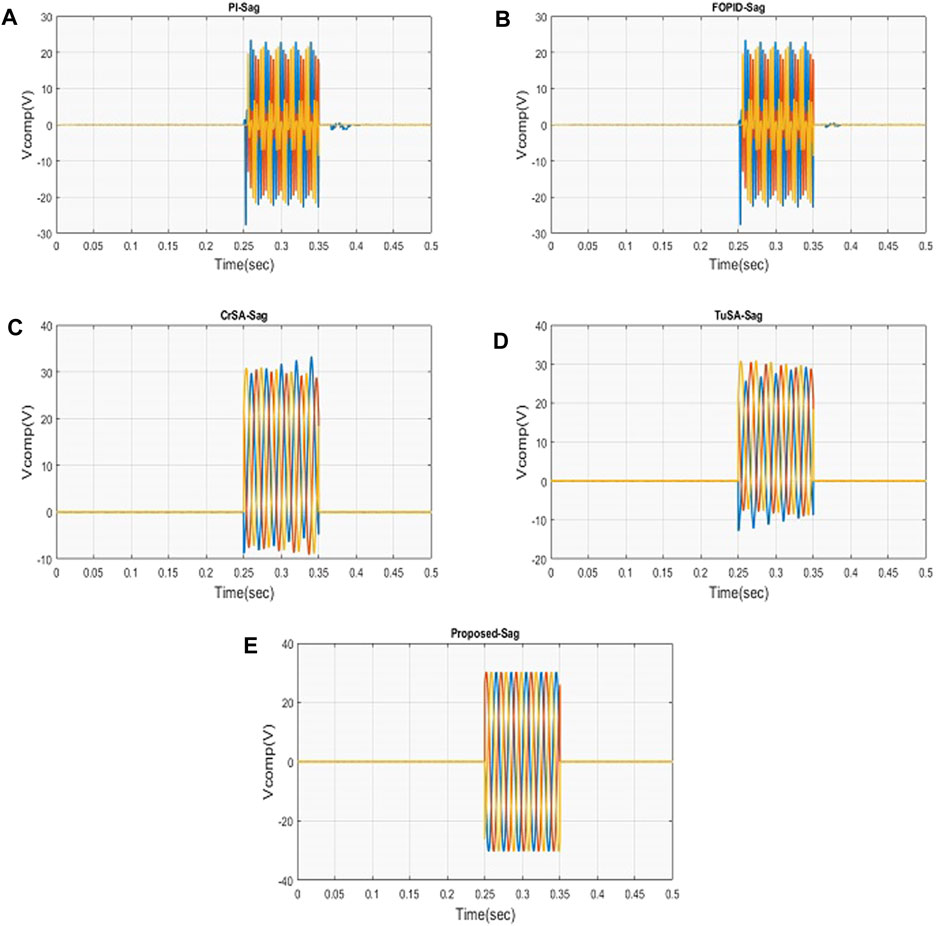
Figure 7. Compensator current waveforms for various techniques.
Figures 8, 9 portray the load current and voltage under PI, FOPID, CSA, TSA, and the proposed method. This evaluation is processed under sag condition. Hence, it is evident that the proposed method can effectively compensate for sagging while maintaining high power quality. Similar to the sag compensation, the suggested approach can successfully compensate swell while maintaining high power quality. The analysis shows the superior performance of the proposed method compared to the conventional methods.
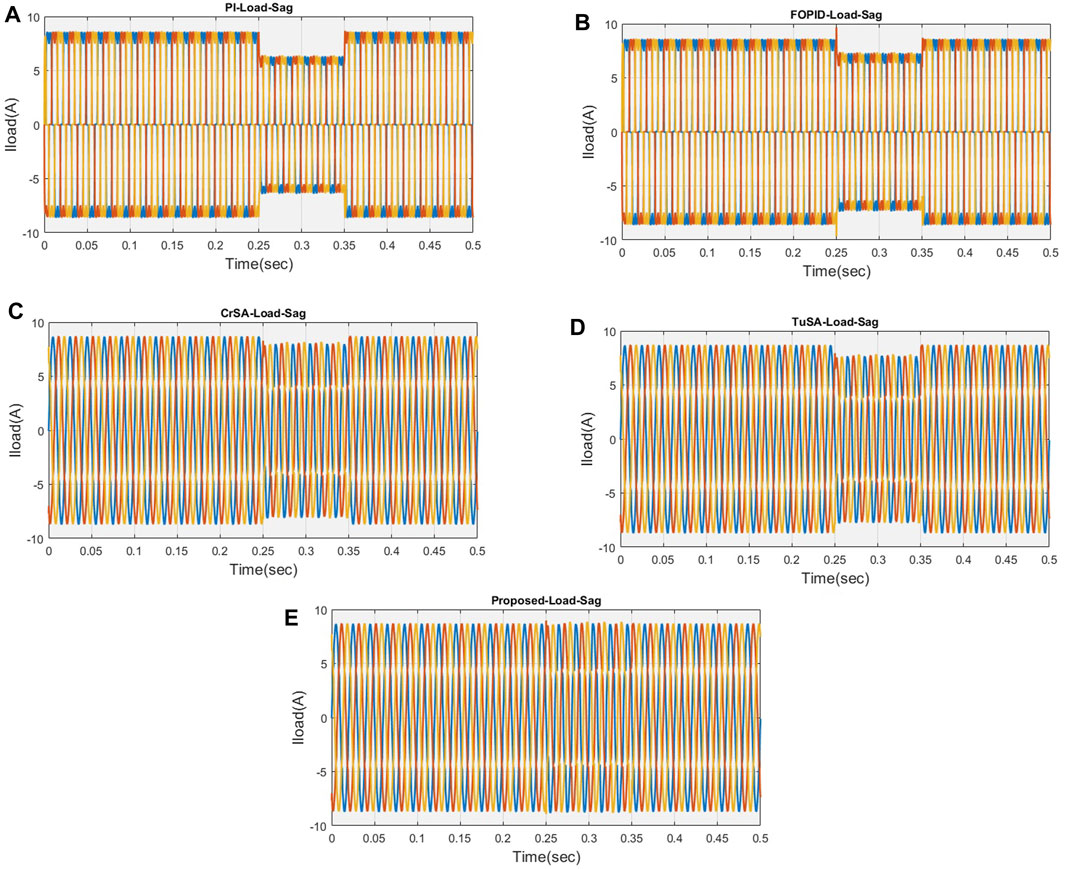
Figure 8. Load current waveforms for various techniques.

Figure 9. Load voltage waveforms for various techniques.
Figure 10A shows the successful convergence of the suggested method for the sag scenario. The fitness value decreases with iterations, which indicates that the proposed model has quickly and successfully optimized the control parameters of the FOPID controller for sag mitigation in the HRES system. The convergence of the CT-SOA model indicates that it is a reliable and efficient optimization algorithm for solving PQ issues in HRES systems.
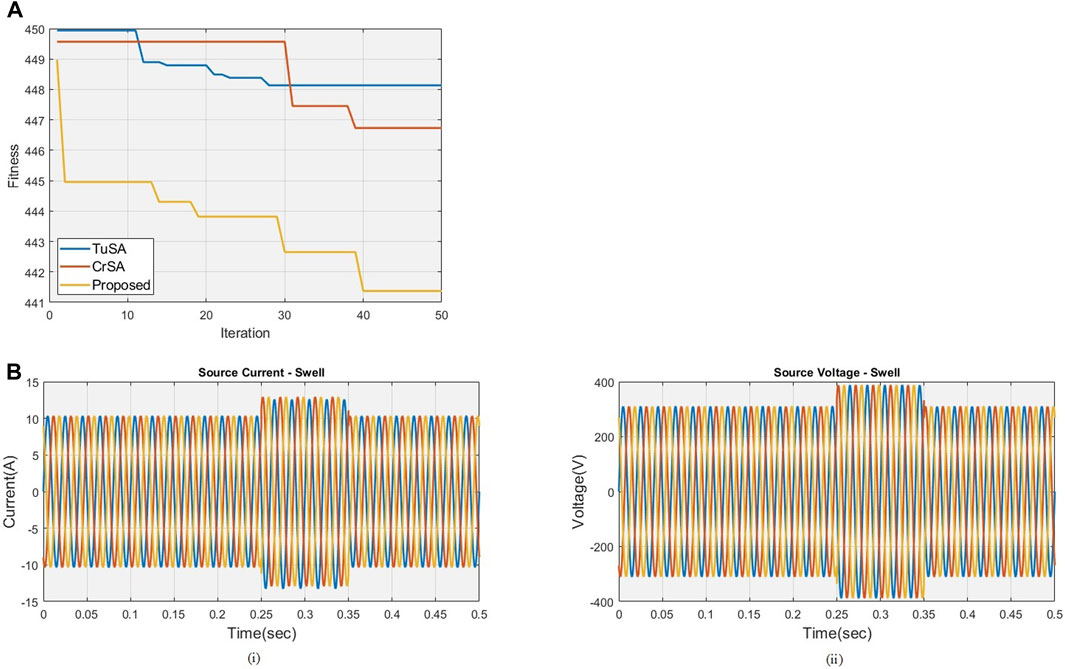
Figure 10. (A) Convergence Analysis of the proposed model in terms of Sag, (B) Supply current and voltage analysis, (i) Supply Current (ii) Supply Voltage.
Swell is the increase in RMS voltage or current that happens at the power frequency affecting the normal operation of a power system.
Compensation is required to reduce swell. Figure 10B depicts the supply voltage waveform during swell conditions. The supply voltage swells between 0.25 and 0.35 s.
Compensator voltage and current waveforms under swell conditions for various techniques like PI, FOPID, CSA, TSA, and the suggested approach are portrayed in Figures 11, 12, respectively. From the comparative analysis, the achievement of the suggested method is seen as superior compared to the traditional methods.
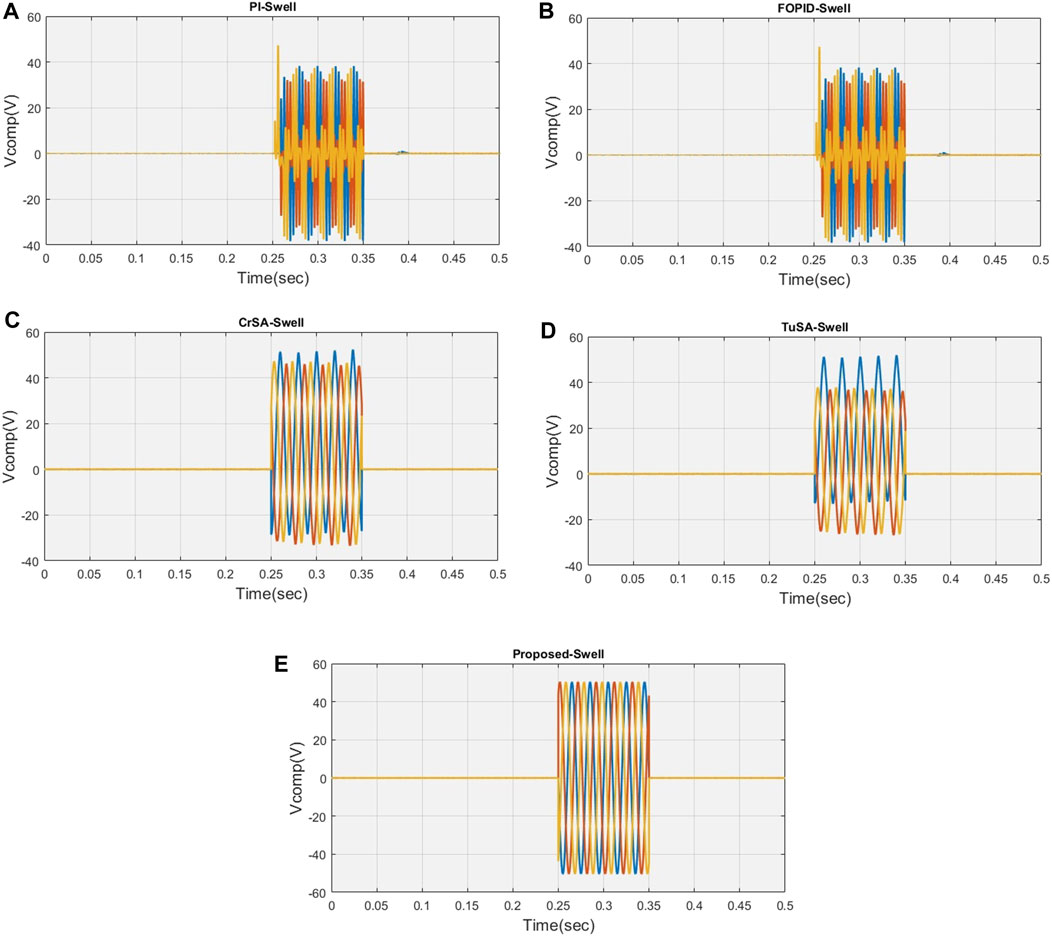
Figure 11. Compensator voltage waveforms for various techniques.
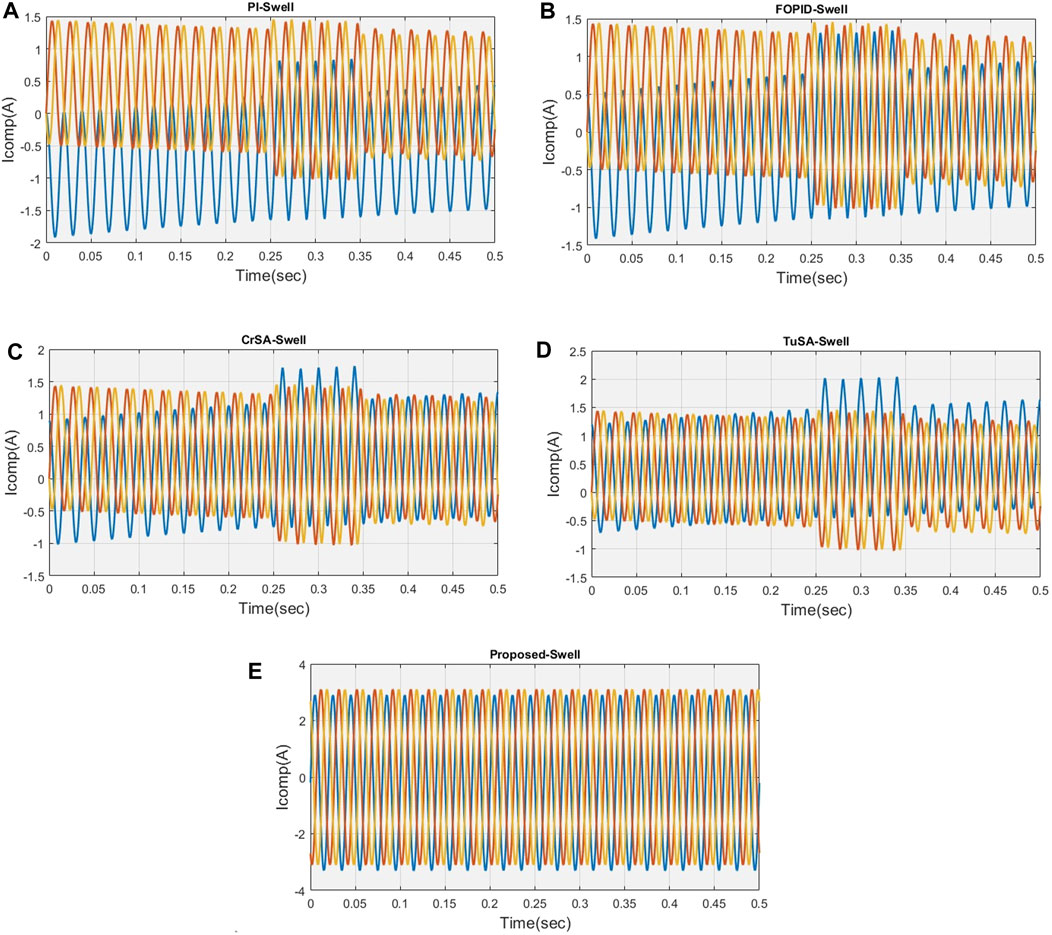
Figure 12. Compensator current waveforms for various techniques.
Figure 13; Figure 14A show the load current and load voltage attained using the PI, FOPID, CSA, TSA, and the proposed method. This evaluation is processed under swell conditions. The analysis shows that the suggested method has high performance than the conventional methods under swell conditions.
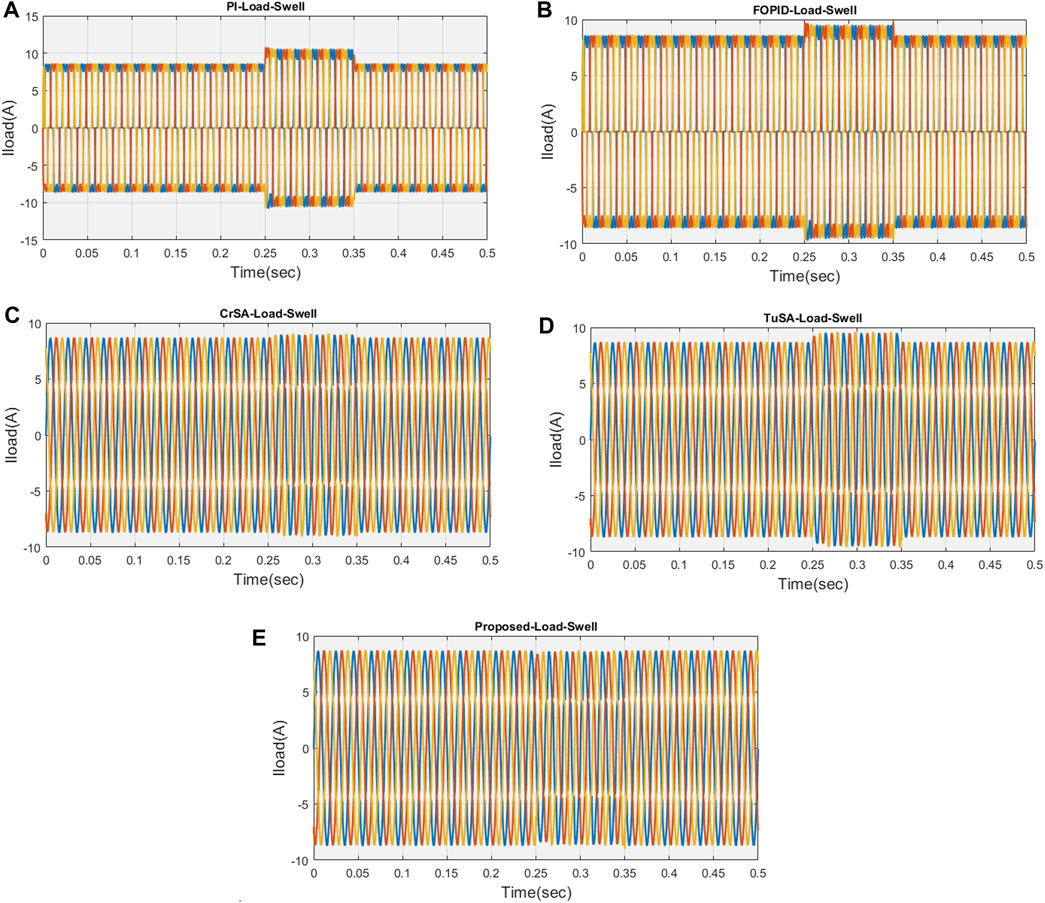
Figure 13. Load current waveforms for various techniques.
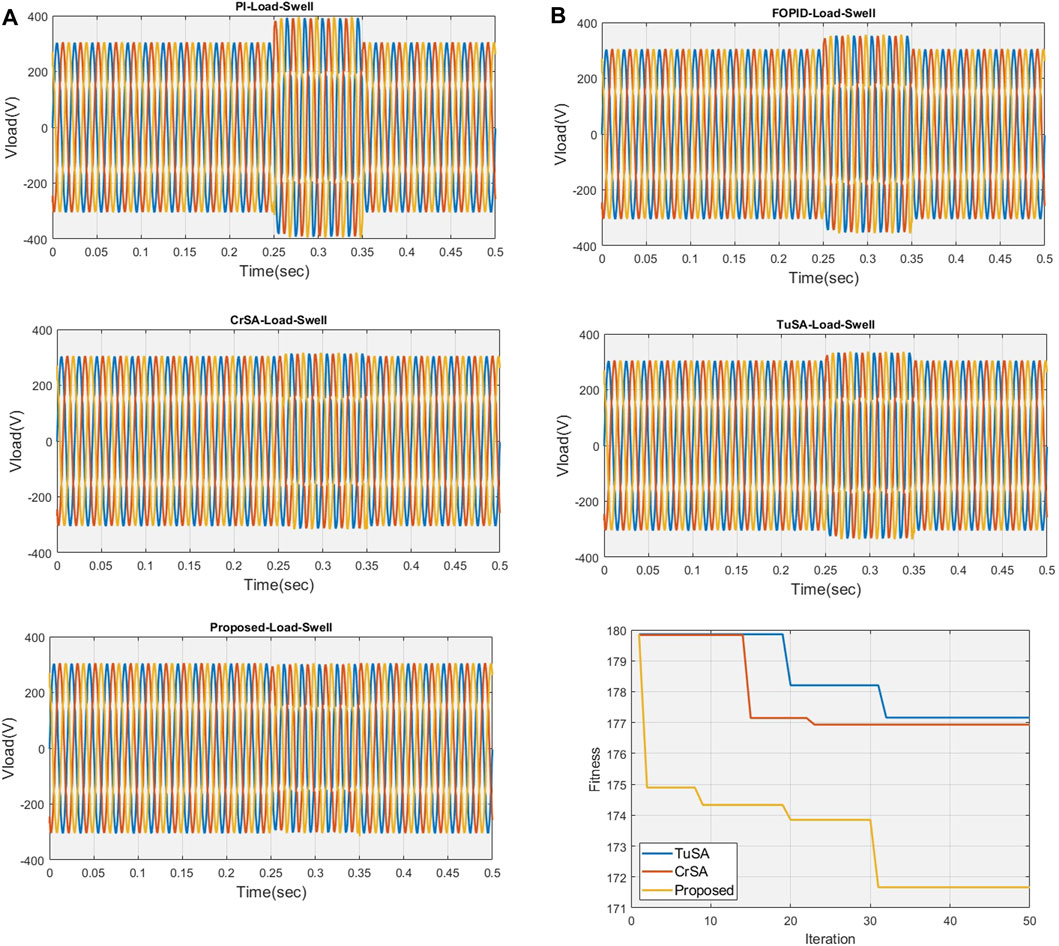
Figure 14. (A) Load voltage waveforms for various techniques, (B) Convergence Analysis of the proposed model in terms of swell.
As shown in Figure 14B, the proposed model has also achieved better convergence for the swell scenario. The fitness function specified in Eq. 26 has been satisfied by the model for every iteration count, demonstrating the effectiveness of the CT-SOA model in resolving PQI in HRES systems. The proposed CT-SOA exhibits superior fitness convergence compared to traditional optimization algorithms. The successful convergence of the suggested approach can be attributed to the hybridization of the two standard optimization algorithms, TSA and CSO. By integrating the strengths of TSA and CSO, CT-SOA achieves a refined balance between exploration and exploitation, resulting in faster and more efficient convergence to optimal solutions. Overall, the convergence analysis results indicate that the suggested model is a promising strategy for addressing PQI in HRES systems. This heightened convergence in both voltage sag and voltage swell is advantageous for addressing power quality issues in grid-connected HRES, making CT-SOA a promising and competitive tool for PQ applications.
The tables provide an analysis of optimal parameters for two control systems, Sag and Swell, using three different optimization algorithms, such as TSA, CSO, and CT-SOA. The control parameters for each algorithm are
The optimal values of
THD analysis is an important measure of the quality of power in electrical systems. In this section, the THD values obtained for different control methods applied to sag and swell compensation are presented. The performance comparison with various other controllers are presented in Table 4. The THD values obtained for the different methods are 5.9038% for PI control, 4.9592% for FOPID control, 3.7027% for CSA, 1.7341% for TSA, and 0.6131% for CT-SOA. Overall, the outcomes represent that the CT-SOA outperforms other methods in terms of THD values for both sag and swell compensation. The study’s main goal is to lessen PQ problems and compensate for the load demand inside the HRES system. The UPQC is made more effective with the addition of an Optimized Fractional Order Proportional Integral Derivative (O-FOPID) controller. The control parameters of the FOPID controller are optimized using the Crow-Tunicate Swarm Optimization Algorithm (CT-SOA), a more advanced version of the conventional Tunicate Swarm Optimization (TSA) and Crow Search Optimization (CSO). The low THD values obtained for the proposed method are an indication of its effectiveness in maintaining high power quality.
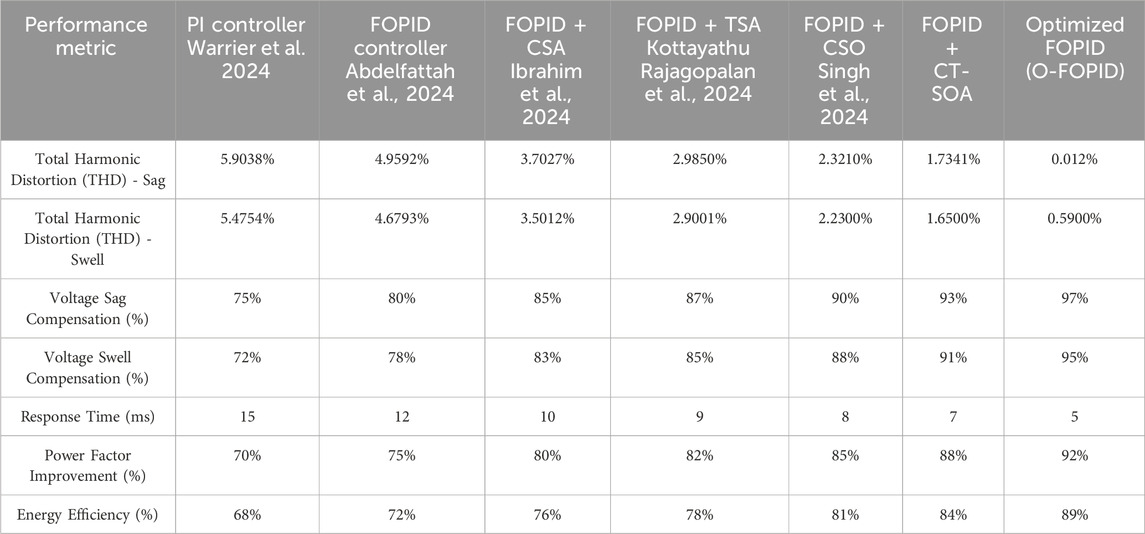
Table 4. Performance comparison with various controllers.
Figure 15 depicts the Total Harmonic Distortion (THD) analysis of the proposed model. The study reports significant improvements in THD values under sag conditions, with the optimized O-FOPID controller achieving a THD of 0.012%, compared to higher values with traditional PI and FOPID controllers. The accompanying bar graph, displaying harmonic frequencies up to 1,000 Hz, indicates a very low THD of 0.01%, underscoring the effectiveness of the proposed optimization technique in minimizing harmonics and improving the overall power quality in HRES.
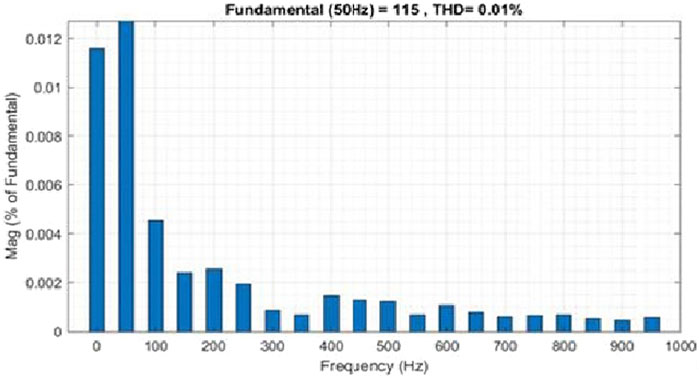
Figure 15. THD Analysis for the proposed controller.
Table 5 presents a comparative analysis of different control techniques applied in a Hybrid Renewable Energy System (HRES) to address Power Quality (PQ) issues. The metrics compared include Total Harmonic Distortion (THD) under sag and swell conditions, voltage sag and swell compensation percentages, response time, power factor improvement, and overall energy efficiency. The traditional PI controller serves as a baseline, while the FOPID controller and its variants optimized using different algorithms (CSA, TSA, CSO, and CT-SOA) demonstrate enhanced performance. The FOPID controller optimized with the Crow Search Algorithm (CSA), Tunicate Swarm Algorithm (TSA), and Crow-Tunicate Swarm Optimization Algorithm (CT-SOA) shows significant improvements over the standard PI and FOPID controllers. The FOPID optimized with CT-SOA achieves the lowest THD values under both sag and swell conditions, highest compensation percentages for voltage sag and swell, fastest response time, and notable improvements in power factor and energy efficiency. This comprehensive comparison underscores the effectiveness of advanced optimization techniques in refining controller performance and enhancing the reliability and efficiency of HRES systems.
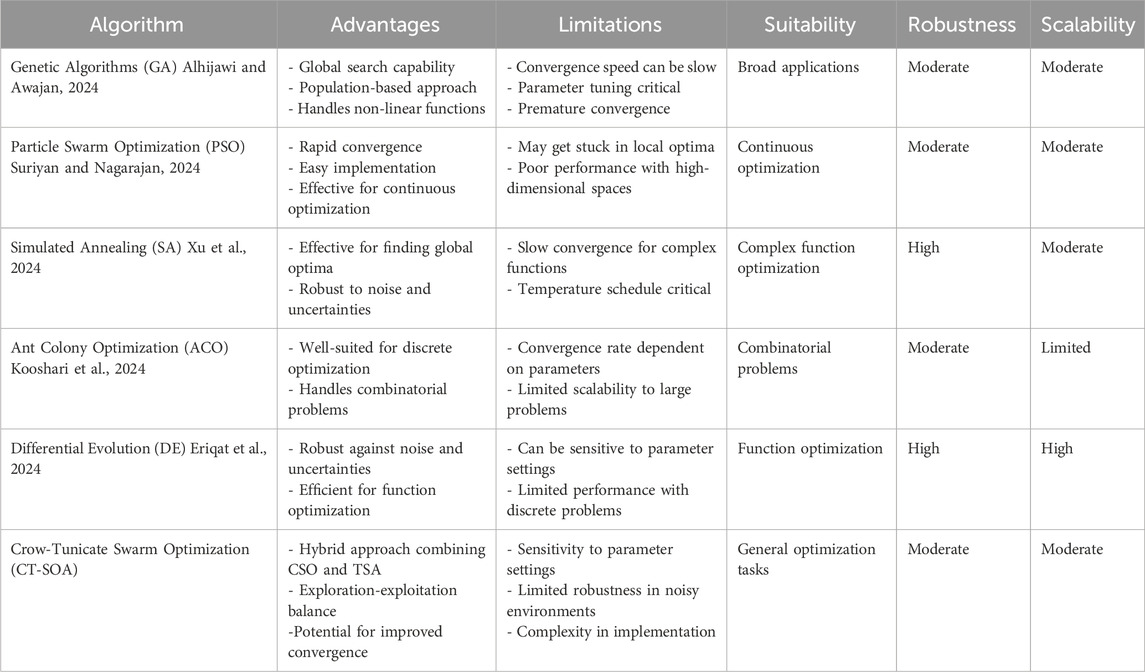
Table 5. Comparison with other optimization Algorithms.
The comparison Table 6 summarizes six prominent optimization algorithms, including Crow-Tunicate Swarm Optimization Algorithm (CT-SOA), Genetic Algorithms (GA), Particle Swarm Optimization (PSO), Ant Colony Optimization (ACO), Simulated Annealing (SA), and Differential Evolution (DE). Each algorithm is evaluated based on its unique advantages, such as GA’s global search capability and PSO’s rapid convergence, alongside limitations like GA’s sensitivity to parameter tuning and PSO’s potential for local optima trapping. Suitability for different problem types is also highlighted, with ACO noted for combinatorial problems and SA for handling complex function optimization robustly. Robustness considerations vary, with DE and SA standing out for their resilience to noise and uncertainties. CT-SOA’s hybrid nature and balance between exploration and exploitation are underscored as beneficial, but it faces challenges in parameter sensitivity and scalability compared to other algorithms.

Table 6. Cost Analysis with respect to different controllers.
The comparison table highlights several strategies for enhancing Power Quality (PQ) in Hybrid Renewable Energy Systems (HRES). Traditional methods, like the PI controller offer a cost-effective solution, but with moderate effectiveness as indicated with a THD of 5.9038%. Moving to more advanced approaches, the Fractional Order Proportional Integral Derivative (FOPID) controller shows improvement with a THD reduction to 4.9592%, demonstrating the benefits of fractional-order dynamics in PQ regulation. The proposed Optimized FOPID (O-FOPID) controller, optimized using the Crow-Tunicate Swarm Optimization Algorithm (CT-SOA), achieves a further reduction in THD to 3.7027%, illustrating the potential of advanced optimization techniques in enhancing HRES performance. Similarly, the Crow Search Optimization Algorithm (CSA) controller achieves a significant THD reduction to 1.7341%, while the CT-SOA controller further lowers THD to 0.6131%, showcasing its effectiveness in minimizing harmonic distortions. These findings underline the trade-off between implementation costs and PQ improvement, where higher investment in advanced controllers yields substantial reductions in THD, crucial for ensuring reliable and efficient operation of grid-connected HRES. Therefore, the selection of control strategies should consider both technical requirements and economic feasibility to optimize HRES performance effectively. In conclusion, while each technique offers varying degrees of PQ improvement at different costs, the choice ultimately depends on specific application needs, budget constraints, and the desired level of PQ enhancement. Advanced controllers like O-FOPID and CT-SOA show promising results in minimizing THD, suggesting their potential for future deployment in optimizing HRES operations. As technologies evolve and costs potentially decrease, these advanced control strategies could become more accessible, further improving the sustainability and reliability of renewable energy integration into existing power grids.
This research proposed a unique hybrid optimization strategy to reduce PQ issues and compensate for the load demand in HRES using the UPQC device with an O-FOPID controller. The parameters of the FOPID controller were tuned with the aid of the proposed CT-SOA. The suggested approach is executed in MATLAB/Simulink and ed under sag, and swell scenarios, and the effectiveness of the system was examined using THD. The results showed that the suggested approach effectively mitigated PQ issues and compensated for the load demand in the HRES system. The THD analysis also confirmed that the proposed strategy is effective in addressing the PQ issues in the HRES system. Overall, the results demonstrated the feasibility and effectiveness of the proposed approach for HRES systems connected to grid systems. The THD values obtained for the different methods under sag condition are 5.9038%, 4.9592%, 3.7027%, 1.7341%, and 0.6131%, respectively for PI, FOPID, CSA, TSA, and the proposed CT-SOA. Similarly, the THD values obtained for the different methods under swell condition are 8.0457%, 5.5211%, 3.4565%, 2.0737%, and 0.9407%, respectively for PI, FOPID, CSA, TSA, and the proposed CT-SOA. It is clear from the research that among all comparing techniques, the CT-SOA achieves the lowest THD value. This proves that the suggested approach may successfully reduce sag and swell while preserving good power quality in the HRES system. However, there are certain limitations of using CT-SOA Algorithm, which are high sensitive to parameters, such as crow count, convergence criteria, and search space dimensions. Also, poorly chosen parameters may lead to suboptimal solutions or prolonged convergence times. This can limit its practical applicability in scenarios requiring rapid solution discovery. Many such eventualities will be taken into consideration in the upcoming work.
The original contributions presented in the study are included in the article/Supplementary Material, further inquiries can be directed to the corresponding author.
RV: Conceptualization, Methodology, Software, Writing–original draft, Data curation, Formal Analysis, Validation. CK: Conceptualization, Methodology, Software, Writing–original draft, Project administration, Resources, Visualization. CB: Formal Analysis, Investigation, Validation, Writing–review and editing. TS: Supervision, Writing–review and editing.
The author(s) declare that financial support was received for the research, authorship, and/or publication of this article. Open Access funding provided by the University of the Ryukyus. JSPS KAKENHI Grant Number JP23K03821.
The authors also would like to acknowledge the blind reviewers for their constructive comments to improve the paper.
The authors declare that the research was conducted in the absence of any commercial or financial relationships that could be construed as a potential conflict of interest.
All claims expressed in this article are solely those of the authors and do not necessarily represent those of their affiliated organizations, or those of the publisher, the editors and the reviewers. Any product that may be evaluated in this article, or claim that may be made by its manufacturer, is not guaranteed or endorsed by the publisher.
Abdelfattah, H., Aseeri, A. O., and Abd Elaziz, M. (2024). Optimized FOPID controller for nuclear research reactor using enhanced planet optimization algorithm. Alexandria Eng. J. 97, 267–282. doi:10.1016/j.aej.2024.04.021
Adefarati, T., and Bansal, R. C. (2019). Reliability, economic and environmental analysis of a microgrid system in the presence of renewable energy resources. Appl. Energy 236, 1089–1114. doi:10.1016/j.apenergy.2018.12.050
Ahmad, S., Alhaisoni, M. M., Naeem, M., Ahmad, A., and Altaf, M. (2020b). Joint energy management and energy trading in residential microgrid system. IEEE Access 8 (2020), 123334–123346. doi:10.1109/ACCESS.2020.3007154
Ahmad, S., Naeem, M., and Ahmad, A. (2020a). Unified optimization model for energy management in sustainable smart power systems. Int. Trans. Electr. Energy Syst. 30 (4), e12144. doi:10.1002/2050-7038.12144
Alhijawi, B., and Awajan, A. (2024). Genetic algorithms: theory, genetic operators, solutions, and applications. Evol. Intell. 17 (3), 1245–1256. doi:10.1007/s12065-023-00822-6
Amirtharaj, S., Premalatha, L., and Gopinath, D. (2019). Optimal utilization of renewable energy sources in MG connected system with integrated converters: an AGONN Approach. Analog Integr. Circuits Signal Process. 101, 513–532. doi:10.1007/s10470-019-01452-8
Askarzadeh, A. (2016). A novel metaheuristic method for solving constrained engineering optimization problems: crow search algorithm. Comput. Struct. 169 (2016), 1–12. doi:10.1016/j.compstruc.2016.03.001
Badoni, M., Singh, A., Singh, A. K., Saxena, H., and Kumar, R. (2023). Grid tied solar PV system with power quality enhancement using adaptive generalized maximum versoria criterion. CSEE J. Power Energy Syst. 9 (2), 722–732. doi:10.17775/CSEEJPES.2020.04820
Berbaoui, B., Dehini, R., and Hatti, M. (2020). An applied methodology for optimal sizing and placement of hybrid power source in remote area of South Algeria. Renew. Energy 146, 2785–2796. doi:10.1016/j.renene.2019.04.011
Bilgundi, S. K., Sachin, R., Pradeepa, H., Nagesh, H. B., and Likith Kumar, M. V. (2020). Grid power quality enhancement using an ANFIS optimized PI controller for DG. Prot. Control Mod. Power Syst. 7 (1), 3. doi:10.1186/s41601-022-00225-2
Chakravorti, T., Nayak, N. R., Bisoi, R., Dash, P. K., and Tripathy, L. (2019). A new robust kernel ridge regression classifier for islanding and power quality disturbances in a multi distributed generation based microgrid. Renew. Energy Focus 28, 78–99. doi:10.1016/j.ref.2018.12.002
Chaudhary, V., Bhargava, A., and Verma, S. (2019). “Power quality enhancement using unified power flow controller in grid connected hybrid PV/Wind system,” in 2019 International Conference on Communication and Electronics Systems (ICCES), Coimbatore, India, 2064–2069. doi:10.1109/ICCES45898.2019.9002306
Cholamuthu, P., Irusappan, B., Paramasivam, S. K., Ramu, S. K., Muthusamy, S., Panchal, H., et al. (2022). A grid-connected solar PV/wind turbine based hybrid energy system using ANFIS controller for hybrid series active power filter to improve the power quality. Int. Trans. Electr. Energy Syst. 2022, 1–14. doi:10.1155/2022/9374638
Devi, M. S., and Suresh Kumar, V. (2021). Optimized FOPID controller for power quality enhancement between feeders using interline dynamic voltage restorer. Mater. Today Proc. doi:10.1016/j.matpr.2020.11.137
Dheeban, S. S., and Muthu Selvan, N. B. (2023). ANFIS-based power quality improvement by photovoltaic integrated UPQC at distribution system. IETE J. Res. 69 (5), 2353–2371. doi:10.1080/03772063.2021.1888325
Elkholy, A. (2019). Harmonics assessment and mathematical modeling of power quality parameters for low voltage grid connected photovoltaic systems. Sol. Energy 183, 315–326. doi:10.1016/j.solener.2019.03.009
Elmetwaly, A. H., Eldesouky, A. A., and Sallam, A. A. (2020). An adaptive D-FACTS for power quality enhancement in an isolated microgrid. IEEE Access 8, 57923–57942. doi:10.1109/ACCESS.2020.2981444
Eriqat, T., Saadeh, R., El-Ajou, A., Qazza, A., Oqielat, M. A. N., and Ghazal, A. (2024). A new analytical algorithm for uncertain fractional differential equations in the fuzzy conformable sense. AIMS Math. 9 (4), 9641–9681. doi:10.3934/math.2024472
Goud, B. S., and Rao, B. L. (2020). An intelligent technique for optimal power quality enhancement (OPQE) in a HRES grid connected system: ESA technique. Int. J. Renew. Energy Res. (IJRER) 10 (1), 317–328. doi:10.20508/ijrer.v10i1.10422.g7877
Goud, B. S., and Rao, B. L. (2021). Power quality enhancement in grid-connected PV/wind/battery using UPQC: atom search optimization. J. Electr. Eng. Technol. 16, 821–835. doi:10.1007/s42835-020-00644-x
Hossain, M. A., Pota, H. R., Squartini, S., Zaman, F., and Muttaqi, K. M. (2019). Energy management of community microgrids considering degradation cost of battery. J. Energy Storage 22, 257–269. doi:10.1016/j.est.2018.12.021
Ibrahim, N. M., El-said, E. A., Attia, H. E., and Hemade, B. A. (2024). Enhancing power system stability: an innovative approach using coordination of FOPID controller for PSS and SVC FACTS device with MFO algorithm. Electr. Eng. 106 (3), 2265–2283. doi:10.1007/s00202-023-02051-7
Jayasankar, V. N., and Vinatha, U. (2016). “Implementation of adaptive fuzzy controller in a grid connected wind-solar hybrid energy system with power quality improvement features,” in 2016 Biennial International Conference on Power and Energy Systems: Towards Sustainable Energy (PESTSE), Bengaluru, India, January 21–23, 2016 (IEEE), 1–5. doi:10.1109/PESTSE.2016.7516461
Kandasamy, P., Chandrasekaran, K., Natarajan, R., and Selvaraj, J. (2022). Deep CNN–LSTM-Based DSTATCOM for power quality enhancement in microgrid. J. Circuits, Syst. Comput. 31 (07), 2250130. doi:10.1142/S0218126622501304
Kaur, S., Awasthi, L. K., Sangal, A. L., and Dhiman, G. (2020). Tunicate Swarm Algorithm: a new bio-inspired based metaheuristic paradigm for global optimization. Eng. Appl. Artif. Intell. 90, 103541. doi:10.1016/j.engappai.2020.103541
Khalid, H. A., Al-Emadi, N. A., Ben-Brahim, L., Gastli, A., and Cecati, C. (2020). A novel control scheme for three-phase seven-level packed U-Cell based DSTATCOM. Electr. Power Syst. Res. 182, 106201. doi:10.1016/j.epsr.2020.106201
Kooshari, A., Fartash, M., Mihannezhad, P., Chahardoli, M., AkbariTorkestani, J., and Nazari, S. (2024). An optimization method in wireless sensor network routing and IoT with water strider algorithm and ant colony optimization algorithm. Evol. Intell. 17 (3), 1527–1545. doi:10.1007/s12065-023-00847-x
Kottayathu Rajagopalan, A. G., Mahapatra, S., and Mahapatro, S. R. (2024). Advanced tree-seed optimization based fractional-order PID controller design for simplified decoupled industrial tank systems. Int. J. Numer. Model. Electron. Netw. Devices Fields 37 (2), e3228. doi:10.1002/jnm.3228
Kumar, C., Subramaniam, G., and Jasper, J. (2022). A novel ROA optimized Bi-LSTM based MPPT controller for grid connected hybrid solar-wind system. COMPEL-The Int. J. Comput. Math. Electr. Electron. Eng. ahead-of-print 42 (2), 378–401. doi:10.1108/COMPEL-11-2021-0453
Lakshmi, S., and Ganguly, S. (2019). Multi-objective planning for the allocation of PV-BESS integrated open UPQC for peak load shaving of radial distribution networks. J. Energy Storage 22, 208–218. doi:10.1016/j.est.2019.01.011
Litwin, M., Zieliński, D., and Gopakumar, K. (2020). Remote micro-grid synchronization without measurements at the point of common coupling. IEEE Access 8, 212753–212764. doi:10.1109/ACCESS.2020.3040697
Ma, T., and Javed, M. S. (2019). Integrated sizing of hybrid PV-wind-battery system for remote island considering the saturation of each renewable energy resource. Energy Convers. Manag. 182, 178–190. doi:10.1016/j.enconman.2018.12.059
Mahela, O. P., Shaik, A. G., Gupta, N., Khosravy, M., Khan, B., Alhelou, H. H., et al. (2020). Recognition of power quality issues associated with grid integrated solar photovoltaic plant in experimental framework. IEEE Syst. J. 15 (3), 3740–3748. doi:10.1109/JSYST.2020.3027203
Murshid, S., and Singh, B. (2019). Utility grid interfaced solar WPS using PMSM drive with improved power quality performance for operation under abnormal grid conditions. IEEE Trans. industry Appl. 56 (2), 1052–1061. doi:10.1109/TIA.2019.2960453
Naidu, R. P. K., and Meikandasivam, S. (2020). Power quality enhancement in a grid-connected hybrid system with coordinated PQ theory and fractional order PID controller in DPFC. Sustain. Energy, Grids Netw. 21, 100317. doi:10.1016/j.segan.2020.100317
Parija, B., Behera, S., Pattanayak, R., and Behera, S. (2019). “Power quality improvement in hybrid power system using D-STATCOM,” in 2019 3rd International Conference on Computing Methodologies and Communication (ICCMC), Erode, India, March 27–29, 2019 (IEEE), 564–567. doi:10.1109/ICCMC.2019.8819656
Raj, T. D., and Chandrasekaran, K. (2020). Dynamic performance improvement of buck–cuk converter in renewable energy resources using EHO optimised PR controller. IET Power Electron. 13 (14), 3009–3017. doi:10.1049/iet-pel.2020.0118
Raj, T. D., Kumar, C., Kotsampopoulos, P., and Fayek, H. H. (2023). Load frequency control in two-area multi-source power system using bald eagle-sparrow search optimization tuned PID controller. Energies 16 (4), 2014. doi:10.3390/en16042014
Rawa, M., Mohamed, H. N., Al-Turki, Y., Sedraoui, K., and Ibrahim, A. M. (2023). Dynamic voltage restorer under different grid operating conditions for power quality enhancement with the deployment of a PI controller using gorilla troops algorithm. Ain Shams Eng. J. 14, 102172. doi:10.1016/j.asej.2023.102172
Raziq, H., Batool, M., Riaz, S., Afzal, F., Akgül, A., and Riaz, M. B. (2023). Power quality improvement of a distribution system integrating a large scale solar farm using hybrid modular multilevel converter with ZSV control. Ain Shams Eng. J. 14 (7), 102218. doi:10.1016/j.asej.2023.102218
Singh, M., Ralhan, S., Sonwane, A., and Kaur, S. (2024). “A novel approach for imroving transient stability and frequency regulation in microgrid systems using CSO-optimized FOTID controller,” in 2024 Fourth International Conference on Advances in Electrical, Computing, Communication and Sustainable Technologies (ICAECT) (Piscataway, NJ: IEEE), 1–7.
Suriyan, K., and Nagarajan, R. (2024). “Particle swarm optimization in biomedical technologies: innovations, challenges, and opportunities,” in Emerging technologies for health literacy and medical practice, 220–238.
Swapna, V., and Gayatri, M. T. L. (2021). “Power quality enhancement using hybrid energy storage based dynamic voltage restorer for grid integrated distributed generation,” in 2021 IEEE Bombay Section Signature Conference (IBSSC), Gwalior, India, November 18–20, 2021, 1–5. doi:10.1109/IBSSC53889.2021.9673473
Vinothkumar, V., and Kanimozhi, R. (2021). RETRACTED ARTICLE: power flow control and power quality analysis in power distribution system using UPQC based cascaded multi-level inverter with predictive phase dispersion modulation method. J. Ambient Intell. Humaniz. Comput. 12, 6445–6463. doi:10.1007/s12652-020-02253-y
Warrier, P., Shah, P., and Sekhar, R. (2024). A Comparative performance evaluation of a complex-order PI controller for DC–DC converters. Results Control Optim. 15, 100414. doi:10.1016/j.rico.2024.100414
Xavier, F. J., Pradeep, A., Premkumar, M., and Kumar, C. (2021). Orthogonal learning-based Gray Wolf optimizer for identifying the uncertain parameters of various photovoltaic models. Optik 247 (2021), 167973. doi:10.1016/j.ijleo.2021.167973
Xu, J., Wu, H., Cheng, Y., Wang, L., Yang, X., Fu, X., et al. (2024). Optimization of worker scheduling at logistics depots using genetic algorithms and simulated annealing. arXiv Prepr. arXiv:2405.11729.
Zhou, Q., Jin, J., and Yang, R. (2022). Static state power smoothing and transient power quality enhancement of a DC microgrid based on multi-function SMES/battery distributed hybrid energy storage system. Energy Rep. 8, 44–51. doi:10.1016/j.egyr.2022.08.051
Keywords: power quality, hybrid renewable energy systems, unified power quality conditioner, FOPID, total harmonic distortion
Citation: Venkatesan R, Kumar C, Balamurugan CR and Senjyu T (2024) Enhancing power quality in grid-connected hybrid renewable energy systems using UPQC and optimized O-FOPID. Front. Energy Res. 12:1425412. doi: 10.3389/fenrg.2024.1425412
Received: 29 April 2024; Accepted: 08 July 2024;
Published: 30 July 2024.
Edited by:
Marif Daula Siddique, Swinburne University of Technology, AustraliaReviewed by:
Srikanth Goud B., Anurag Group of Institutions, IndiaCopyright © 2024 Venkatesan, Kumar, Balamurugan and Senjyu. This is an open-access article distributed under the terms of the Creative Commons Attribution License (CC BY). The use, distribution or reproduction in other forums is permitted, provided the original author(s) and the copyright owner(s) are credited and that the original publication in this journal is cited, in accordance with accepted academic practice. No use, distribution or reproduction is permitted which does not comply with these terms.
*Correspondence: C. Kumar, Y2t1bWFybWU4MUBnbWFpbC5jb20=
Disclaimer: All claims expressed in this article are solely those of the authors and do not necessarily represent those of their affiliated organizations, or those of the publisher, the editors and the reviewers. Any product that may be evaluated in this article or claim that may be made by its manufacturer is not guaranteed or endorsed by the publisher.
Research integrity at Frontiers
Learn more about the work of our research integrity team to safeguard the quality of each article we publish.