- 1Kaifeng Power Supply Company, State Grid Henan Electric Company, Kaifeng, China
- 2College of Electrical Engineering, Shanghai University of Electric Power, Shanghai, China
A risk-aware scheduling method of multienergy virtual power plant (MEVPP) is proposed to measure the uncertainty in MEVPP. First, a novel day-ahead uncertainty scenario generation method based on denoising diffusion probabilistic model is proposed, and historical data are employed to learn the error relationship between real power curves and predict power curves. The probability distribution of the prediction error which describes the day-ahead output power curve of renewable energy source is learned by parameter training. Subsequently, the effect of risk aversion on decision-making is investigated by implementing conditional value-at-risk in the optimization model, MEVPP operation mode under the carbon trading and green certificate trading mechanism is analyzed. Finally, the proposed scheme is implemented on a test MEVPP with carbon trading, and green certificate trading is addressed in detail through a numerical study. Moreover, the effects of the operator’s risk-averse behavior on the MEVPP are investigated.
1 Introduction
Power system is comprehensively advancing its low-carbon energy transition, and this process is unfolding rapidly. Against the backdrop of steady development in smart energy and the gradual opening of the electricity market, the energy industry is continuously progressing toward the goals of safety, efficiency, and sustainable development (Lin and Li, 2022). Due to the flexibility and environmental friendliness inherent in distributed energy sources, their installed capacity and share of electricity generation in the power system are steadily rising. This transformation involves not only a shift toward cleaner energy sources but also research into integrated energy systems (IESs), virtual power plants (VPPs), and other collaborative operational models involving distributed energy sources. The development and application of smart energy solutions, led by distributed energy sources, are creating favorable conditions for the energy industry to embrace transformative changes. These changes are crucial in propelling the energy industry toward a future characterized by safety, efficiency, and sustainable practices.
Currently, the application of distributed energy sources still faces several challenges. First, the significant integration of renewable energy source (RES) has led to increasing uncertainty in the energy system, rendering simple uncertainty models inadequate to meet accuracy requirements. Second, due to geographical constraints, the regional limitations of IESs impede the effective coordination and operation capabilities of different distributed energy sources. To solve this problem, the concept of multienergy VPP (MEVPP) has emerged. MEVPP integrates various types of energy with regional characteristics to balance diverse energy demands in the market trading environment, aiming to achieve objectives of safety, economic efficiency, and environmental conservation. MEVPP is recognized as a crucial approach to address the current challenges in the application of distributed energy resources (Kwon et al., 2019). The flexibility and resilience offered by MEVPP are significant as they quickly adapt to supply and demand changes, reducing the reliance on centralized power plants and supporting decentralization. Technological advancements in smart grids, energy storage (ES), and intelligent management systems are driven by MEVPP, which also participate in energy markets by offering essential ancillary services. This participation not only contributes to market stability and efficiency but also opens up new economic opportunities for energy trading and services. MEVPP provides substantial environmental benefits by reducing greenhouse gas emissions and minimizing the energy sector’s environmental impact. Moreover, they assist in meeting stringent regulatory requirements for renewable energy adoption and carbon emissions reduction, aligning with global efforts to combat climate change and transition to a sustainable, low-carbon economy.
MEVPP tackles the escalating uncertainty resulting from the substantial integration of RES by introducing more refined and accurate uncertainty models. Scenario analysis is a widely used method to analyze RES uncertainty by generating a set of future scenarios representing different possible outcomes of RES behavior. By incorporating these scenarios into optimization models, operators can make more informed decisions regarding scheduling and planning schemes. In the process of scenario generation, the sampling-based method is commonly employed due to its simplicity and speed, which involves sampling from the probability distribution to generate discrete sets of scenarios. For example, an empirical distribution using Monte Carlo samples is used in Li et al. (2020) to generate a day-ahead set of scenarios. The Gaussian copula is used in Papaefthymiou and Kurowicka (2008) to analyze the uncertainty of large-scale wind power integration into the power system. However, the aforementioned model-based sampling methods require making assumptions about the probability distribution approximately conforming to a certain distribution. With the rapid development of artificial intelligence, deep generative models have been widely used in scenario generation. Qi et al. (2020) adopts VAE to generate PV scenarios in multienergy power system. In Dumas et al. (2021), NF is applied to forecast the quantiles of RES generation and is integrated into robust optimization problems. Zhang et al. (2020) uses C-WGAN-GP and support vector machine to generate scenarios by classifying errors. The quality of scenario generation by monolayer VAE is worse than GAN, NF can only be applied to certain tasks, and the results are not satisfactory. GAN-based scenario generation has high quality, but it is difficult to get good results by train. During the training process, it will encounter the problem of mode collapse and loss of diversity. There have been many techniques to improve training (Zhao et al., 2020), but it is still difficult to apply in actual engineering.
IES is a response to an integrated energy supply that can bring together multiple energy demands and supplies, making effective use of the complementary strengths of different energy sources. However, due to geographical constraints, the coordinated operational capabilities of IES cannot be effectively utilized. MEVPP integrates different types of region-specific energy sources, balancing various energy demands in the market trading environment to achieve objectives of safety, economic efficiency, and environmental conservation. In the literature, Chen et al. (2021) employs a data-driven approach to encapsulate a VPP dispatch model for real-time optimization but do not propose scheduling models between various energy sources. Zhang et al. (2023) introduces a self-conclusion and variation particle swarm optimization method to address VPP scheduling issues, yet it does not consider the uncertainty impact of RES. Good and Mancarella (2017) utilizes Weibull probability distribution functions and Monte Carlo simulation to describe the distribution of wind power generation in a VPP, employing a stochastic optimization method for dispatch tasks, but the uncertainty probability distribution excessively relies on the model. Kong et al. (2020) applies a GAN-based scenario generation method and robust stochastic optimization to describe the uncertainty of RES in an MEVPP. However, the practical applicability of the GAN-based scenario generation method remains challenging and hard to apply. Vahedipour-Dahraie et al. (2020) investigates the optimal problem of VPPs in the market but overlooks the variety of risks.
In these studies, there is a lack of adoption of a precise, easily applicable method to describe the uncertainty of RES. Moreover, the current methodology does not assess the risk of carbon emissions under the market trading mechanism, leaving gaps in the economic and environmental research within carbon trading and green certificate trading market environments. To address these issues, this paper proposes a risk-aware scheduling method. Specifically,
• to describe the inherent uncertainties of RES, a deep generate model named the denoising diffusion probabilistic model (DDPM) is used for scenario generation;
• an optimal dispatch model of MEVPP incorporating carbon trading and green certificate trading is established;
• the DDPM-based conditional value-at-risk (CVaR) risk estimation methodology is introduced to assess the risks associated with carbon emissions; and
• the proposed DDPM-based CVaR risk estimation methodology model for MEVPP participation in carbon trading and green certificate trading improves the utilization of RES and reduces the carbon emissions of MEVPP.
2 Scenario generation by DDPM
2.1 System component model
Describing the inherent characteristics of RES is the key to formulating the day-ahead optimization of MEVPP. Day-ahead scenario generation can reveal the relationship between influencing factors and RES output and accurately describe the output characteristics of RES under uncertain environments by generating a set of scenarios that may occur in the future. To analyze the scenario from the perspective of prediction error, we use the historical dataset of a certain region as the training set, and the resolution of the time series is τ; suppose that the time series predicted for a certain day is
2.2 Principle of DDPM
A DDPM is a parameterized Markov chain trained using variational inference to produce samples matching the data after finite time (Sohl-Dickstein et al., 2015). Transitions of this chain are learned to reverse a diffusion process, which is a Markov chain that gradually adds noise to the data in the opposite direction of sampling until the signal is destroyed. When the diffusion consists of small amounts of Gaussian noise, it is sufficient to set the sampling chain transitions to conditional Gaussians, allowing for a particularly simple neural network parameterization. In brief, the training of DDPM can be regarded as two parts: reverse process (denoising process) and diffusion process (add noising process).
For convenience, we use x to represent a time series, T is the number of steps of diffusion, the data distribution of the sample is represented by
where
The mean value
The second part of DDPM is the forward process, also known as the diffusion process, which differs from other implicit variable models in that it progressively adds noise to the data on a fixed Markov chain based on the variance
In the forward process, noise is gradually added to the data, with the target of making the data distribution close to the Gaussian noise distribution, the detailed method can be seen in Ho et al. (2020).
2.3 Denoising network structure
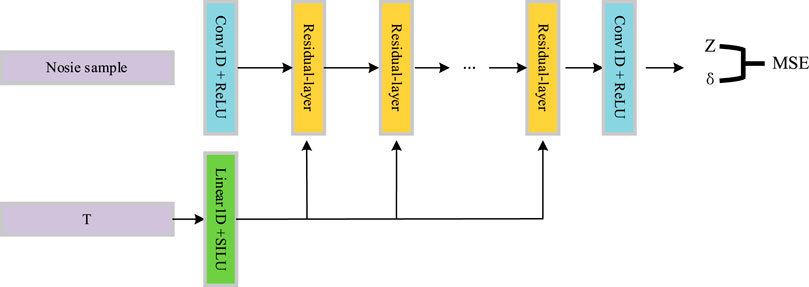
Applying DDPM to RES scenario generation, the emphasis lies in establishing the probability distribution between conditions and scenarios. By considering the influence of predicted conditions, improving the training process of DDPM is aimed at establishing the correlation of scenarios. Our model embedded the predicted power as conditional inputs into each residual layer, The noise sample is embedded into the residual network through the convolutional network, and the features of each step are embedded into the residual network; finally, the features are extracted through a layer of convolutional network to generate a removed noise. The detailed denoising network structure is depicted in Figure 1.
2.4 The process of scenario reduction
After using DDPM to generate scenarios, it is necessary to reduce the number of scenarios to an appropriate number and obtain their probability distribution, which is the process of discretization of the entire probability distribution. The process of scenario reduction has been studied in many papers (Heitsch and Römisch, 2003). In this paper, a simple spectral clustering method is adopted to set the number of scenarios to an appropriate number.
2.4.1 Scenario generation by spectral clustering
Spectral clustering, grounded in graph theory, utilizes the decomposition of datasets through eigenvalues and eigenvectors to reveal underlying structures that conventional clustering techniques might fail to detect. This technique adeptly reduces dimensionality, thereby exhibiting significant robustness against noise and outliers, which substantially improves the fidelity of clustering results. The method’s versatility is augmented by kernel methods, allowing it to effectively manage data that are not linearly separable. Within the context of this study, we employ spectral clustering to condense scenarios, with the objective of identifying renewable energy scenarios characterized by pronounced features. Our methodology meticulously sifts through the intricacies of renewable energy datasets, culminating in a curated selection of scenarios that are both quintessential and reflective of the inherent probabilistic nature of the energy sources under scrutiny (Ng et al., 2001).
2.4.2 Probability distribution of joint scenarios
Yang et al. (2015) is used to assess generation adequacy by modeling a joint probability distribution model, which is not within the scope of this paper.
We adopt the method of Li et al. (2022) and multiply the probability of two scenarios respectively, i.e., the scenario probability of wind power is Πa and the scenario probability of photovoltaic is Πb, then the joint probability is Πa*Πb.
3 Carbon trading and green certificate trading mechanism
3.1 Carbon trading mechanism
The implementation of the carbon trading mechanism involves the allocation of carbon emission rights, turning carbon into a tradable commodity. This approach utilizes market-oriented means to drive the reduction of carbon emissions.
One of the key issues in the carbon trading mechanism is the allocation of carbon emission quotas, typically determined through national carbon emission targets. In China, carbon emission policies are formulated based on the electricity production of power generation enterprises. If the carbon emissions generated by a power generation unit are less than the allocated carbon emissions quota, they can benefit by selling excess quotas. Conversely, if the carbon emissions exceed the allocated target, the entity must purchase additional carbon emission quotas.
In the MEVPP described in this paper, the carbon emission sources are gas turbines (GT) and gas boilers (GB). GT generates both electricity and heat, whereas GB produces only heat. The carbon emission quotas for the system at time t, denoted as Ep,t, are determined by equating the electrical energy produced by GT to its equivalent heat generation and allocating carbon emission quotas accordingly.
In Eq. 7, where δ represents the regional unit carbon emission allocation for electricity, determined by the “2019 Annual Emission Reduction Project Baseline Emission Factor for China’s Regional Power Grids” set by the National Development and Reform Commission. In this study, it is obtained by taking the weighted average of the marginal emission factors for electricity and capacity in the system region, yielding a value of 0.57 t/(MW·h);
where
Therefore, the actual carbon trading cost
where
3.2 Green certificate trading mechanism
The green certificate trading mechanism is a market mechanism designed to promote the development and utilization of RES, guide fair consumption by market participants, internalize environmental costs, and foster a harmonious ecosystem for sustainable development between humanity and nature.
A green certificate is a certification granted after verifying the production of RES that meets the standardized quality in the MEVPP. Market participants can acquire RES quotas based on their capacity to produce RES, and the green certificate serves as tangible proof of this production. Green certificates can be traded, allowing market entities to flexibly adjust their RES quotas. If a market entity’s consumption of RES is below the allocated quota, the entity needs to purchase tradable green certificates to fulfill its RES quota. Conversely, if the consumption of RES exceeds the allocated quota, market entities can sell surplus green certificates to generate economic profit. This mechanism encourages market entities to actively participate in the consumption and production of RES, thus driving the development of the RES market.
The transaction cost of green certificates can be expressed as Eq. 10
where kgre is the unit price of green certificate in green certificate trading. Pgre,t is the amount of RES generation in the dispatch schedule of MEVPP in the t period. The amount of RES utilized by MEVPP is transformed by 1 MW = 1 green certificate. Pre,t is the RES consumption quota of VPP in the t period. The expression of Pre,t can be seen in Wang et al. (2023).
3.3 MEVPP operating model under carbon trading and certificate trading mechanisms
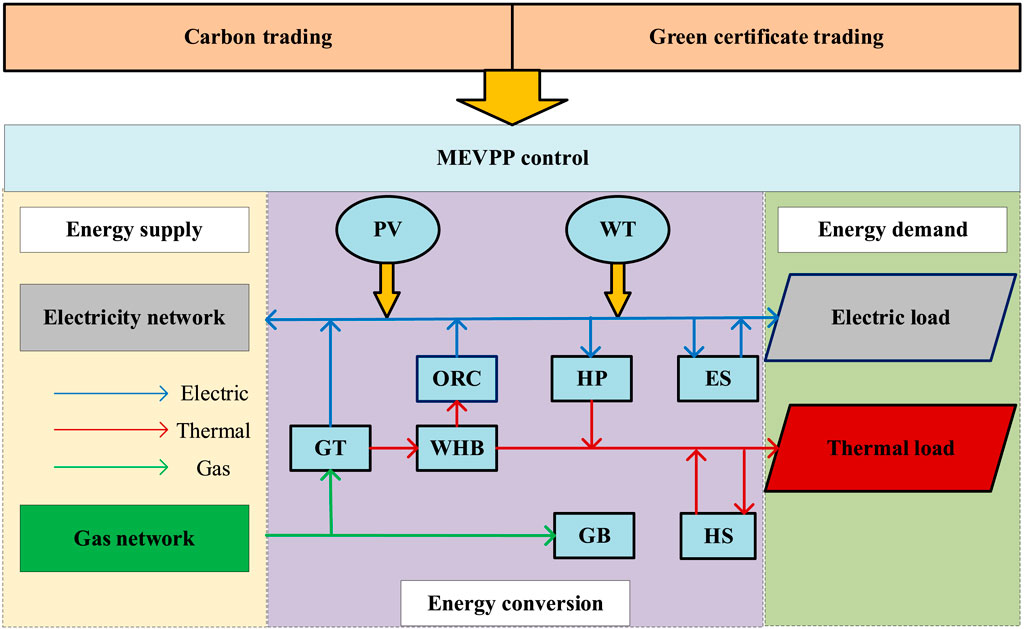
When a VPP expands beyond being confined to electricity and incorporates interactions among various energy sources to meet diverse energy procurement needs, it evolves into an MEVPP. For operators, the control platform must balance multiple energy sources and devise optimal strategies for the interaction between different types of energy.
The MEVPP architecture studied in this paper consists of a control platform, energy supply segment, energy conversion segment, and energy demand segment. It adopts a centralized control structure responsible for system scheduling, determining the purchase and sale of electricity, handling the uncertainty of RES, and obtaining the demand from the energy conversion segment. It optimizes the output of each unit.
The energy supply segment comprises three parts: electricity, heat, and gas. The power generation equipment includes GTs, wind turbines, and photovoltaic devices. The energy conversion segment includes a combined heat and power generation (CHP) unit consisting of a GT, a waste heat boiler (WHB), and a low-temperature waste heat power generation device based on the organic Rankine cycle (ORC). Additionally, it includes GBs and heat pumps (HP). Energy storage devices encompass both electric ES and thermal ES (HS). Energy demand primarily involves electrical and thermal loads. The MEVPP control center specifies scheduling schemes for the MEVPP based on market prices and the dispatch plans of the distribution network dispatch center. The transactional structure is illustrated in Figure 2.
3.4 Carbon emission with CVaR
Due to the uncertainty associated with RES and load, the system’s carbon emissions may deviate from standards. When formulating scheduling plans, the carbon emission costs arising from such an uncertainty must be considered. This paper addresses the uncertainty through a scenario-based method based on DDPM. The optimization objective is to probabilistically minimize the operational costs across various scenarios, considering the impact of both carbon trading mechanisms and green certificate trading mechanisms on carbon emissions. CVaR is introduced into the objective function to enhance the consideration of uncertainties.
VaR and CVaR are widely used for risk characterization and control. VaR is the maximum loss at a given confidence level β, related to the probability of excess loss. CVaR is the expected value of losses exceeding the VaR at a given confidence level β, related to the expected value of excess losses. Let π(x, y) denote the loss function caused by the random variable y under decision variable x. Assuming the density function of y is p(y), then for a given confidence level β, the VaR and CVaR of the loss are obtained from Equations 11 and 12, respectively.
4 MEVPP optimization model with CVaR
4.1 Objective function
We formulate a scheduling model to achieve a balance between the economic efficiency and carbon emission risk of MEVPP under user load satisfaction. The objective is articulated as a composite of the expected economic cost and the tail risk value based on CVaR, represented by Eq. 13:
where
The total economic cost can be represented as Eq. 14
The economic cost is expressed for each component as follows.
4.1.1 Total cost of the MEVPP interaction with other energy
Total cost of the MEVPP interaction with other energy is expressed as Eq. 15.
where t represents a runtime period;
4.1.2 Total cost of carbon trading
Total cost of carbon trading is expressed as Eq. 16.
4.1.3 Cost of green certification trading
Cost of green certification trading is expressed as Eq. 17.
4.1.4 Cost of operating
Cost of operating is expressed as Eq. 18.
Here, i takes values 1, 2, 3, …, 7, representing the wind turbine, PV, CHP, HP, GB, ES, and HS, respectively.
4.1.5 Risk of carbon emission based on CVaR
The risk of carbon emission by CVaR can be represented as Eq. 19.
where
4.2 Constraints
4.2.1 RES generation constraints
The generation capacity limits of RESs can be articulated as Eqs 20, 21.
where
4.2.2 Power balance constraints
The Power balance constraints of MEVPP can be summarized as Eqs 22–24.
where
4.2.3 CHP constraints
The constraints of CHP can be summarized as Eqs 25–31.
where
4.2.4 HP and GB constraints
The limits of HP and GB can be expressed in terms of Eqs 32, 33.
where
4.2.5 Energy storage device constraints
The energy storage device limits can be can be formulated as Eq. 34.
where
4.2.6 Power constraints on the distribution grid contact line
The Power constraints on distribution grid contact line can be formulated as Eq. 35.
where
5 Case study
5.1 Data setting
Wind and PV datasets are collected from the Belgian transmission operator ELIA (Yang et al., 2020), which provides the power outputs and day-ahead point forecasts for all offshore wind farms and PV plants in Belgium. In this paper, 3 years of data are adopted as the train data. One month’s data is adopted as test data. Noteworthy is that these point forecasts provided on the official website are mainly obtained through specialized forecasting tools developed by external service providers or mathematical models based on weather. Some weather point forecasts may be less accurate because of the new sensor monitoring technologies with the occurrence of extreme weather events. The detailed DDPM parameter can be found in Table 1.
Furthermore, in order to properly evaluate the performance of DDPM for scenario generation, the most popular deep generative model Conditional Generative Adversarial Network (CGAN) and the traditional method MC are selected for comparison. The detailed CGAN parameter can be found in Figure 3. This section was coded in Python with PyTorch3.7 and implemented on Inter i7-12700H 2.7-GHz CPU with RAM 64 GB personal computer accelerated by NVIDIA GTX 3080 GPU.
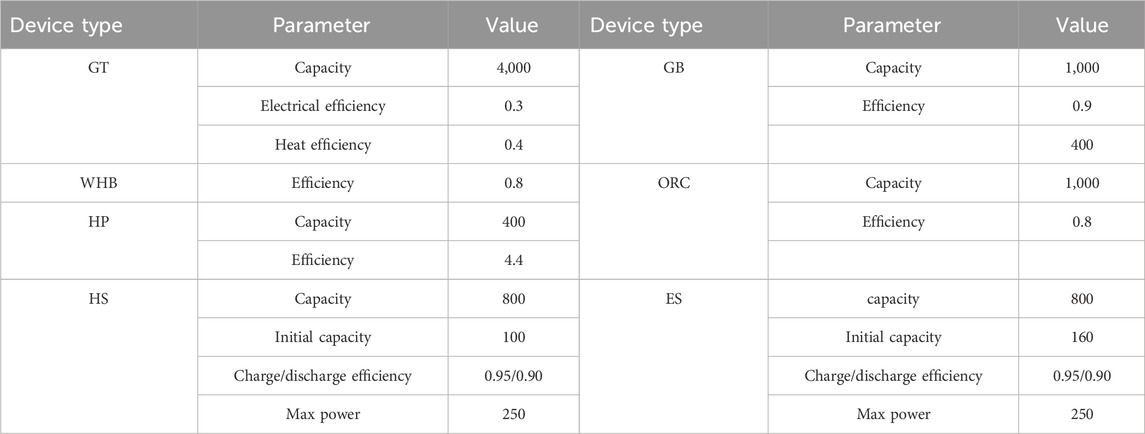
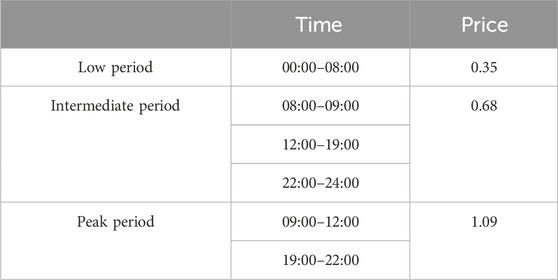
In order to verify the effectiveness of the method proposed in this paper, MEVPP parameters shown in Table 2 are used for verification. The trading price of green certificate is set at 50 RMB/(MW·h), and the carbon trading price is 150 RMB/t. The prices of electricity used by customers are shown in Table 3.
5.2 Performance analysis
A scenario analysis using DDPM and GAN is shown in Figure 4. For wind power scenarios in Figure 4A and 4B, both methods can replicate the fluctuating nature of wind power. However, the generated power curves from the GAN generation scenarios may deviate from the real power curve, particularly in the header and tail sections. These deviations prevent an accurate representation of the uncertainty associated with the real power curve. Conversely, the DDPM generation scenarios can provide a more precise coverage of the curve, offering a more accurate depiction of its uncertainty. Five centroid centers are shown in Figure 4C and 4D, by analyzing the RES scenarios; it becomes evident that the DDPM-generated scenarios with their five clustering centers can fully encompass the real power curve. In contrast, the GAN-based method shows notable deviations, underscoring that DDPM is better suited for accurately capturing the characteristics of real RESs through the reduced scenarios. The correlation between time series plays a critical role in the operation and planning of power systems, as it provides valuable insights into the temporal characteristics of RESs. By accurately capturing these characteristics, the risk of underestimating operating costs can be minimized (Villanueva et al., 2011). Therefore, it is essential to evaluate the effectiveness of generated scenarios through correlation analysis. The autocorrelation coefficient is a metric used to measure the level of correlation between time series at different periods. It quantifies the impact of past behaviors on the present state. In our analysis, we calculate the autocorrelation coefficients R(τ) of the samples by Eq. 36
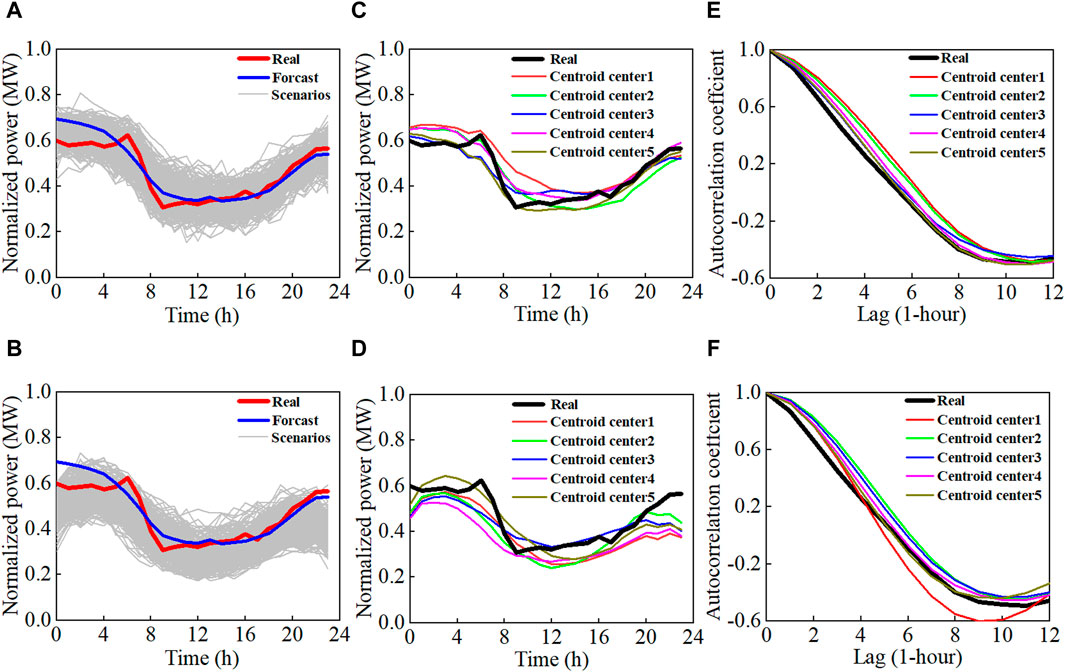
Figure 4. Scenarios analysis of the denoising diffusion probabilistic model (DDPM) and CGAN: (A) Wind scenarios generated by DDPM; (B) wind scenarios generated by CGAN; (C) DDPM generate wind scenarios cluster 5 centroid center; (D) CGAN generate wind scenarios cluster 5 centroid center; (E) time series analysis of the DDPM generate wind centroid center; (F) time series analysis of the CGAN generate wind scenarios centroid center.
where S is a random time series; µ and σ denote the mean and variance of S, respectively; and τ is the time lag. The correlation analysis presented in Figure 4E and 4F clearly indicates that the time series generated using the DDPM method closely resembles the real power curve in terms of temporal correlation.
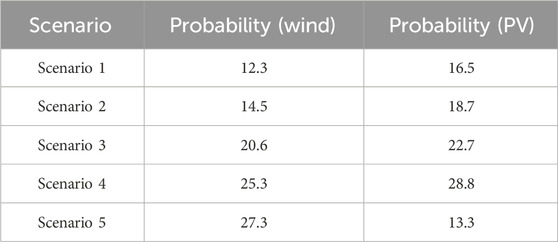
At last, the scenario probability distribution obtained by the DDPM scenario generation method and the spectral clustering scenario reduction method are shown in Table 4.
5.3 Scheme comparison analysis
To compare the performance of scenario-based CVaR under carbon trading and green certification mechanisms, four cases were established for analysis.
S1: This case represents the performance without carbon trading and green certification trading.
S2: In this case, MEVPP schedules under carbon trading.
S3: In this case, MEVPP schedules under carbon trading and certification trading.
S4: In this case, MEVPP schedules under market trading and considers the risk of carbon emission. β = 0.95, ωρ = 0.9.
5.3.1 MEVPP scheduling plan
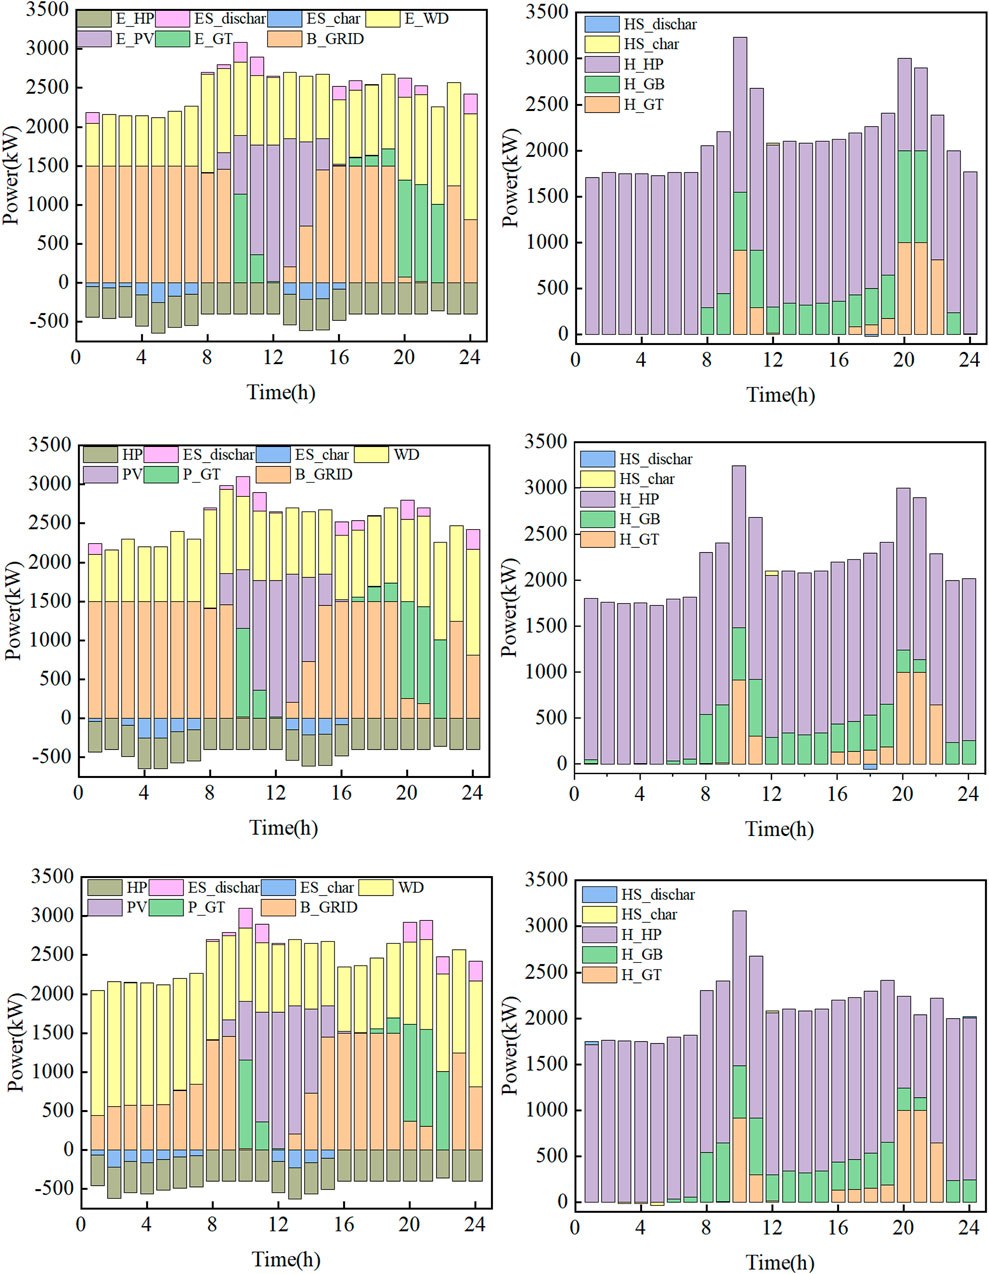
The scheduling results for S1–S3 are illustrated in Figure 5. In the low-demand periods (off-peak hours), the system relies on wind turbine output and grid electricity purchases to meet the power balance, whereas the heat demand is supplied by HP, GB, and HS to maintain thermal equilibrium. This is attributed to the lower electricity prices during grid purchases, resulting in lower costs, with the remaining electricity demand primarily met by the wind turbine output. Additionally, due to the high heating efficiency of HP, it is given priority for heating. In cases where HP and CHP cannot meet the demand, GB is employed for heating. In the intermediate demand period, the system relies on grid electricity purchases and solar/wind power output. The substantial output from photovoltaics significantly reduces the cost of purchasing electricity. During peak demand periods, when grid electricity prices are higher, the system heavily relies on solar/wind power output and CHP output to meet the load demands. The heat demand is fulfilled by HS, HP, and CHP during this period.
5.3.2 Carbon trading and green certificate trading analysis
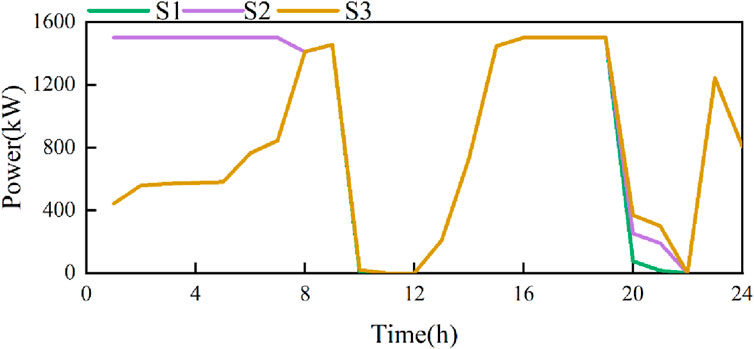
In S2, Figure 6 illustrates a distinct preference for procuring electricity directly from the grid under the influence of a carbon trading mechanism. This preference is not coincidental; it is a strategic choice stemming from the way our carbon trading mechanism is designed. It predominantly manages and facilitates transactions of carbon emissions that are produced within the confines of the MEVPP. Given this context, when the grid electricity is priced competitively, our system is naturally inclined to prioritize these purchases due to their cost-effectiveness. In contrast, scenarios that incorporate a green certificate trading mechanism demonstrate a different outcome. They are characterized by a reduction in the overall cost associated with generating power from solar and wind sources. This decrease in generation costs is pivotal as it is directly linked to the effectiveness of our approach to carbon emission reduction. By bolstering the output from renewable sources like solar and wind, we are not only promoting environmental sustainability but also indirectly influencing the economic dynamics of grid electricity purchases. The enhanced utilization of solar and wind power leads to a more significant reduction in the cost of grid electricity, making it an even more attractive option for the MEVPP’s energy portfolio. This integrated strategy harnesses the power of market mechanisms to drive down emissions while simultaneously optimizing energy acquisition costs.
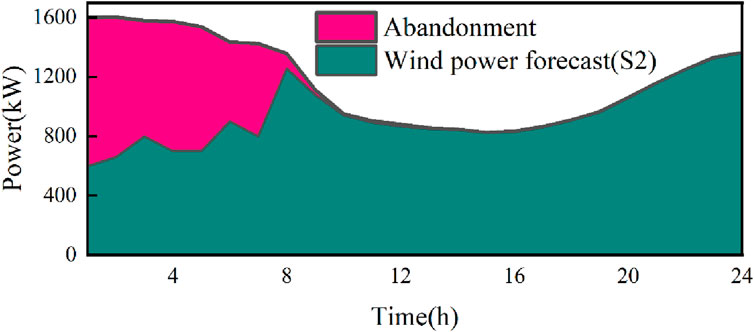
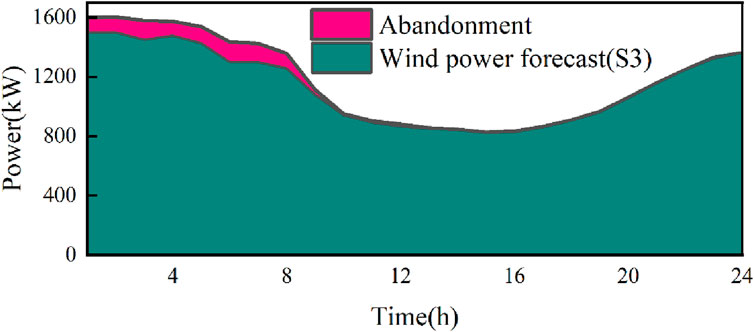
As illustrated in Figures 7 and 8, which pertain to wind power output, there is a notable reduction in the accommodation of wind energy during off-peak hours when the load demand is minimal. This is due to the system’s inclination to prioritize the fulfillment of the RES quota in order to procure additional green certificates and subsequently generate supplementary revenue through the green certificate trading mechanism. At the stroke of midnight, there is a significant surge in wind power generation, which escalates to 900 kW. Correspondingly, the integration of wind power during the nocturnal period witnesses a marked enhancement. Thus, the quintessence of the green certificate trading mechanism is encapsulated in its role of amplifying the RES absorption capacity. This is effectively achieved by leveraging the internalization of costs associated with RES, thereby fostering a more sustainable and economically viable energy framework.
5.3.3 MEVPP cost analysis
The cost comparison of different schemes for MEVPP is presented in Table 5. When applying the carbon trading mechanism, the purchasing cost of electricity decreases by 4.03%. This reduction is attributed to the introduction of carbon trading shares, which offset a portion of the electricity purchasing cost. With the implementation of the green certificate trading mechanism, the income generated from RES generation reduces the cost of RES production, leading to a 13.25% decrease in electricity purchasing costs. The system tends to prioritize the integration of RES, promoting a low-carbon development trajectory. In the case of CVaR application, carbon emissions have an impact on the scheduling plan. The system restricts the output of GT to reduce carbon emissions, sacrificing some economic costs to achieve the goal of emission reduction.
5.3.4 Carbon emission analysis
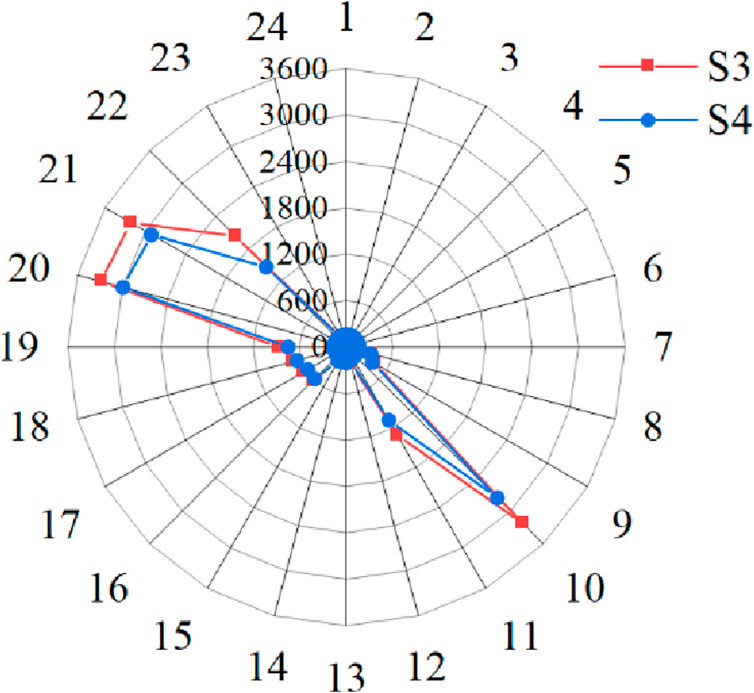
Figure 9 illustrates the impact of applying the CVaR method on carbon emissions in the scheduling plan. Under the premise of meeting load demand, there is a significant reduction in carbon emissions during the periods 10:00–11:00 and 20:00–22:00. This reduction is attributed to the relatively high output of the gas turbine during these time intervals. By decreasing the output of the gas turbine, the carbon emissions of the MEVPP are effectively reduced. In comparison to S3, the utilization of CVaR contributes to formulating a scheduling plan with lower carbon emissions within the current framework.
5.4 CVaR analysis
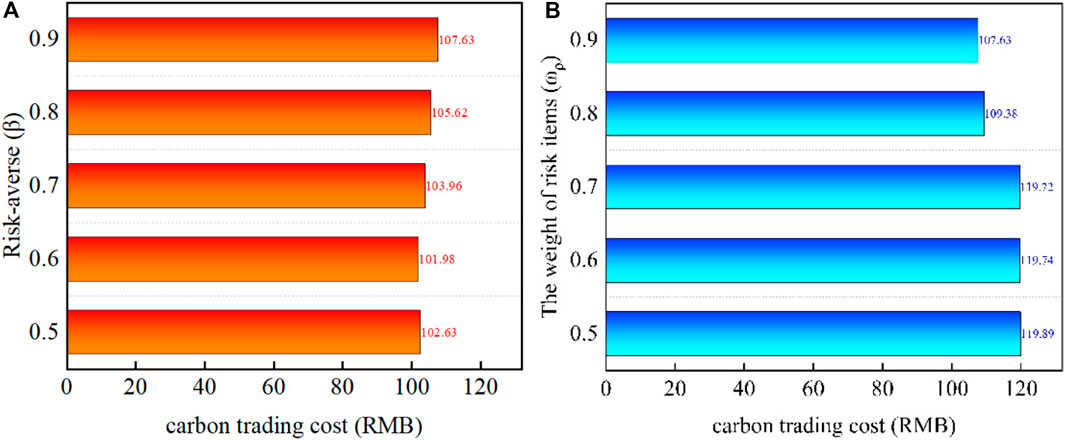
Figure 10A illustrates the impact of different β-values on carbon emissions. A smaller β-value increases the probability of carbon emission risk, making the system more inclined toward a low-carbon solution. Carbon emissions fluctuate under different β-values due to variations in discrete probabilities. When the probability of the risk value is larger, the probability of exceeding the risk value is smaller, affecting the system’s scheduling plan. In Figure 10B, the influence of varying the weight ωρ on optimization results is demonstrated when β is set to 0.9. As ωρ increases, the system’s carbon emissions decrease, suggesting that controlling the risk of carbon emissions can be achieved by increasing ωρ. However, as ωρ increases, the expected operating costs also rise. Therefore, adjusting ωρ allows for a balance between expected operating costs and carbon emissions.
6 Conclusion
To track the fluctuation of RESs, a DDPM-based scenario generation method is considered, Scenario reduced by spectral clustering. Then, based on the scenarios, a CVaR-based carbon trading risk model is constructed. A stochastic optimization model with carbon trading and green certificate trading for MEVPP is constructed. After case analysis, the following conclusions are reached:
(1) DDPM-based scenario generation method can improve the accuracy of describing the features of RES and the effectiveness of optimized models.
(2) Green certificate mechanism and carbon trading mechanism can promote the consumption of RES, reduce carbon emissions, and increase the economic cost of MEVPP operation.
(3) In the process of operation, it is necessary to consider the preference of carbon emission indicators, and the method based on CVaR can guide operators to make operation plans under the requirements of carbon emission indicators.
Data availability statement
The original contributions presented in the study are included in the article/Supplementary Material; further inquiries can be directed to the corresponding author.
Author contributions
FM: writing–original draft. YN: writing–original draft. GZ: writing–original draft. CL: writing–original draft. YM: writing–review and editing. CL: writing–review and editing. JS: writing–review and editing.
Funding
The author(s) declare that no financial support was received for the research, authorship, and/or publication of this article.
Conflict of interest
Authors FM, YN, and GZ were employed by State Grid Henan Electric Company.
The remaining authors declare that the research was conducted in the absence of any commercial or financial relationships that could be construed as a potential conflict of interest.
Publisher’s note
All claims expressed in this article are solely those of the authors and do not necessarily represent those of their affiliated organizations, or those of the publisher, the editors, and the reviewers. Any product that may be evaluated in this article, or claim that may be made by its manufacturer, is not guaranteed or endorsed by the publisher.
References
Chen, X., Pei, W., and Deng, W. (2021). Data-driven virtual power plant scheduling feature encapsulation method. CSEE (China) 41 (14), 4816–4828.
Dumas, J., Cointe, C., Wehenkel, A., Sutera, A., Fettweis, X., and Cornelusse, B. (2021). A probabilistic forecast-driven strategy for a risk-aware participation in the capacity firming market. IEEE Trans. Sustain. Energy 13 (2), 1234–1243. doi:10.1109/tste.2021.3117594
Good, N., and Mancarella, P. (2017). Flexibility in multi-energy communities with electrical and thermal storage: a stochastic, robust approach for multi-service demand response. IEEE Trans. Smart Grid 10 (1), 503–513. doi:10.1109/tsg.2017.2745559
Heitsch, H., and Römisch, W. (2003). Scenario reduction algorithms in stochastic programming. Comput. Optim. Appl. 24, 187–206. doi:10.1023/a:1021805924152
Ho, J., Jain, A., and Abbeel, P. (2020). Denoising diffusion probabilistic models. Adv. neural Inf. Process. Syst. 33, 6840–6851.
Kong, X., Xiao, J., Liu, D., Wu, J., Wang, C., and Shen, Y. (2020). Robust stochastic optimal dispatching method of multi-energy virtual power plant considering multiple uncertainties. Appl. Energy 279, 115707. doi:10.1016/j.apenergy.2020.115707
Kwon, S. Y., Park, J. Y., and Kim, Y. J. (2019). Optimal V2G and route scheduling of mobile energy storage devices using a linear transit model to reduce electricity and transportation energy losses. IEEE Trans. Industry Appl. 56 (1), 34–47. doi:10.1109/tia.2019.2954072
Li, J., Zhou, J., and Chen, B. (2020). Review of wind power scenario generation methods for optimal operation of renewable energy systems. Appl. Energy 280, 115992. doi:10.1016/j.apenergy.2020.115992
Li, Y., Wang, B., Yang, Z., Li, J., and Chen, C. (2022). Hierarchical stochastic scheduling of multi-community integrated energy systems in uncertain environments via Stackelberg game. Appl. Energy 308, 118392. doi:10.1016/j.apenergy.2021.118392
Lin, B., and Li, Z. (2022). Towards world’s low carbon development: the role of clean energy. Appl. Energy 307, 118160. doi:10.1016/j.apenergy.2021.118160
Ng, A., Jordan, M., and Weiss, Y. (2001). On spectral clustering: analysis and an algorithm. Adv. neural Inf. Process. Syst., 14.
Papaefthymiou, G., and Kurowicka, D. (2008). Using copulas for modeling stochastic dependence in power system uncertainty analysis. IEEE Trans. power Syst. 24 (1), 40–49. doi:10.1109/tpwrs.2008.2004728
Qi, Y., Hu, W., Dong, Y., Fan, Y., Dong, L., and Xiao, M. (2020). Optimal configuration of concentrating solar power in multienergy power systems with an improved variational autoencoder. Appl. Energy 274, 115124. doi:10.1016/j.apenergy.2020.115124
Sohl-Dickstein, J., Weiss, E., and Maheswaranathan, N. (2015). “Deep unsupervised learning using nonequilibrium thermodynamics,” in International conference on machine learning (PMLR), 2256–2265.
Vahedipour-Dahraie, M., Rashidizadeh-Kermani, H., Shafie-Khah, M., and Catalao, J. P. S. (2020). Risk-averse optimal energy and reserve scheduling for virtual power plants incorporating demand response programs. IEEE Trans. Smart Grid 12 (2), 1405–1415. doi:10.1109/tsg.2020.3026971
Villanueva, D., Feijóo, A., and Pazos, J. L. (2011). Simulation of correlated wind speed data for economic dispatch evaluation. IEEE Trans. Sustain. Energy 3 (1), 142–149. doi:10.1109/tste.2011.2165861
Wang, Y., Wu, X., Liu, M., Zhang, C., Wang, H., and Yue, Y. (2023). Bidding strategy of the virtual power plant considering green certificates and carbon trading. Energy Rep. 9, 73–84. doi:10.1016/j.egyr.2023.04.042
Yang, M., Lin, Y., Zhu, S., Han, X., and Wang, H. (2015). Multi-dimensional scenario forecast for generation of multiple wind farms. J. Mod. Power Syst. Clean. Energy 3, 361–370. doi:10.1007/s40565-015-0110-6
Yang, X., Xu, C., and He, H. (2020). Flexibility provisions in active distribution networks with uncertainties. IEEE Trans. Sustain. Energy 12 (1), 553–567. Available: http://www.elia.be/en/grid-data.
Zhang, L., Liu, D., Cai, G., Lyu, L., Koh, L. H., and Wang, T. (2023). An optimal dispatch model for virtual power plant that incorporates carbon trading and green certificate trading. Int. J. Electr. Power & Energy Syst. 144, 108558. doi:10.1016/j.ijepes.2022.108558
Zhang, Y., Ai, Q., Xiao, F., Hao, R., and Lu, T. (2020). Typical wind power scenario generation for multiple wind farms using conditional improved Wasserstein generative adversarial network. Int. J. Electr. Power & Energy Syst. 114, 105388. doi:10.1016/j.ijepes.2019.105388
Keywords: MEVPP, uncertainty, DDPM, CVaR, RES
Citation: Meng F, Nan Y, Zheng G, Lu C, Mi Y, Li C and Shen J (2024) A risk-aware scheduling method of multienergy virtual power plant based on the denoising diffusion probabilistic model. Front. Energy Res. 12:1425202. doi: 10.3389/fenrg.2024.1425202
Received: 29 April 2024; Accepted: 03 June 2024;
Published: 26 July 2024.
Edited by:
Hao Yu, Tianjin University, ChinaReviewed by:
Qingyu Su, Northeast Electric Power University, ChinaGuanyu Song, Tianjin University, China
Copyright © 2024 Meng, Nan, Zheng, Lu, Mi, Li and Shen. This is an open-access article distributed under the terms of the Creative Commons Attribution License (CC BY). The use, distribution or reproduction in other forums is permitted, provided the original author(s) and the copyright owner(s) are credited and that the original publication in this journal is cited, in accordance with accepted academic practice. No use, distribution or reproduction is permitted which does not comply with these terms.
*Correspondence: Changkun Lu, bGNrc3NvbGhlYXJ0QDE2My5jb20=
 Fanbin Meng1
 Yang Mi
 Chunxu Li