 Xueyan Wang1
 Jinzhou Sun
 Fei Tang
94% of researchers rate our articles as excellent or good
Learn more about the work of our research integrity team to safeguard the quality of each article we publish.
Find out more
ORIGINAL RESEARCH article
Front. Energy Res. , 30 July 2024
Sec. Energy Storage
Volume 12 - 2024 | https://doi.org/10.3389/fenrg.2024.1425197
This article is part of the Research Topic Optimization and Data-driven Approaches for Energy Storage-based Demand Response to Achieve Power System Flexibility View all 24 articles
As the physical power information system undergoes continual advancement, mobile energy storage has become a pivotal component in the planning and orchestration of multi-component distribution networks. Furthermore, the evolution and enhancement of big data technologies have significantly contributed to enhancing the rationality and efficacy of various distribution network planning and layout approaches. At the same time, multi-distribution networks have also confronted numerous network attacks with increasing probability and severity. In this study, a Petri net is initially employed as a modeling technique to delineate the network attack flow within the distribution network. Subsequently, the data from prior network attacks are consolidated and scrutinized to evaluate the vulnerability of the cyber-physical system (CPS), thereby identifying the most critical network attack pattern for a multi-component distribution network. Following this, the defender–attacker–defender planning methodology is applied for scale modeling, incorporating rapidly evolving mobile energy storage into the pre-layout, aiming to mitigate the detrimental impact of network attacks on the power grid. Ultimately, the column and constraint generation (C&CG) algorithm is utilized to simulate and validate the proposed planning strategy in a 33-node system with multiple control groups established to demonstrate the viability and merits of the proposed strategy.
With the rapid development of the global energy Internet, the distribution network has become an important part of the power system, and its operation safety is directly related to the stability and reliability of the power supply. However, with the rapid development of computers and communication technology, the traditional power system and information communication system are more and more closely combined, forming a fused power and information physical system known as a cyber-physical system (CPS). With the continuous upgrading of network attacks, the security problem of power networks is becoming increasingly prominent (Shelar and Amin, 2017). In order to cope with this challenge, this study aims to explore a multi-component distribution network planning method under power network attacks to improve the anti-attack capability and operational stability of the distribution network.
In recent years, many CPS studies have emerged. Based on the establishment of the CPS dependency model and the characterization of the coupling mechanism between them, Nguyen et al. (2013) studied and analyzed the factors affecting the vulnerability of distribution networks under network attacks. Gao et al. (2013) analyzed the interdependence and connection between power and information nodes. Through the communication process between the power system and the information system, Long et al. (2019) conducted network modeling to verify the relationship between the degree of system loss and the proportion of fault nodes in the network. Zhang et al. (2021) analyzed CPS modeling through a dependency network. However, most of the modeling processes above are mainly from a topological perspective, resulting in some differences between the final model and actual system characteristics. Currently, research on network attacks mostly focuses on large power grid information physical systems, with most information attacks concentrated in transmission grids. For example, Yu et al. (2016) verified that communication delay between AC and DC changes the optimization strategy of control centers in UHV systems. Cai et al. (2016) studied potential major failures (catastrophic failures) in different structural information networks under random or deliberate attacks. Based on the semi-Markov process, Lau et al. (2020) modeled SCADA systems and developed optimal mixed strategies for defense strategy allocation through competitive games. Yu et al. (2019) proposed a transfer model of the CPS system that integrates physical equipment and information decision making and realizes dynamic control of the transfer process by establishing an information control flow. Yi et al. (2016) analyzed, defined, and classified the network attacks suffered by CPS based on examples. At present, the network attack planning methods for distribution networks are relatively few. The influence of pre-layout defense measure configuration on network attacks is ignored, and defender–attacker–defender (DAD) planning is rarely taken into account in distribution network configuration planning.
Based on the above research background and research status, this article proposes a multi-component distribution network planning method that considers network attacks. First, vulnerability attacks under Petri net and power network attacks are used to analyze and obtain the vulnerability of distribution networks under network attacks, and with the help of data-driven (Stephane et al., 2022), the corresponding extreme scenarios are simplified and generated. Second, based on the DAD planning model, mobile energy storage is introduced for pre-layout in advance to reduce the cost of fault recovery. Third, the C&CG algorithm is used to analyze the three-layer, two-stage optimization problem of the DAD planning model. Finally, a 33-node IEEE system is tested and evaluated to verify the economy and effectiveness of the proposed method.
As the key infrastructure supporting the normal operation of society, the security and stability of the power network are very important (Yang et al., 2022). With the rapid development of computer and communication technology, traditional power systems and information and communication systems are more and more closely combined, forming a typical CPS. However, with the continuous evolution of the means of network attack, the threat to the power network is becoming more and more serious.
In the diversified and chain-oriented environment of network attacks, it is difficult for traditional methods to deal with random and highly interlocked attacks, mainly because it is difficult to describe dynamic attack and defense behaviors. The state of the whole system cannot be directly observed, which affects the selection of defense behaviors. Therefore, this article chooses a Petri net as the modeling method to describe the attack state and provides the basis for the subsequent defense strategy selection.
The elements of a Petri net include a library (Place) circular node, a Transition square node, a directed arc (Connection) that is the directed arc between a library and a transition, and a token (Token) that is a dynamic object in a library that can be moved from one library to another (Deka et al., 2014). Figure 1 shows a common network attack flow model.

Figure 1. Common network attack flow model.
When the actual transition probability and delay are determined, a Petri net can be equated with a Markov chain (MC) (Lin et al., 2005). At the same time, the trigger matrix data are easily obtained in the reachable graph. The analysis of system performance can have a very good effect. The specific method of obtaining trigger matrix parameters is as follows: a random Petri net is represented by a quadruple SPN = (P, T, Mo, Mf), where Mo represents the initial mark, and Mf represents the final mark. The calculation formula of the trigger matrix is as follows in Eq. (1) (Amini et al., 2018):
In this formula, C is the integration matrix,
With the development of information technology, the power system’s dependence on the information network also increases. Therefore, security will be seriously threatened when network attacks occur. It is necessary to assess the vulnerability of the distribution network under network attacks (Dahmen et al., 2019). Widely used mainstream evaluation methods are based on complex network and transient energy functions and service transmission (Shahsanee and Zareei, 2018).
At present, vulnerability assessment of network nodes is mainly focused on the static condition, but when the network is running, the vulnerability index will change constantly. Zhou et al. (2024) put forward the concept of destructiveness to indicate the degree to which the network is on the verge of destruction when attacked in Eq. (2):
In this expression, Pi is the destructivity index and tij is the delay range of the ith service beside j.
For the case of multiple lines, according to the change of Pij, the accuracy of vulnerability assessment is ensured by the following Eq. (3):
In this formula, Cp[Ep(i,j)]is the vulnerability of the communication branch, Ep(i,j) is the vulnerability value of the communication branch from Article i to Article j,
When the distribution network is attacked and a fault occurs, the node will lose load. Therefore, the analysis must also consider the results caused by the failure of the distribution network and the shutdown of nodes (Nazemi et al., 2019).
In view of the fact that the distribution network is generally a radial network and operates in an open loop, the impact caused by node outage can be quantitatively analyzed Eqs 4,5:
In this formula,
Considering the existence of static and dynamic indicators of the vulnerability of the distribution network, several nodes are selected from different levels of the distribution network for assessment. Different vulnerability assessment indicators are assigned according to the levels and importance of different nodes (Yan et al., 2015).
Because the existing distribution network is coupled by the power network and the communication network, the components are diverse, and the coupling relationship is complicated. The complex network theory can be used to model and analyze the distribution network. Among them, the bus and line in the power network are abstracted as nodes and edges. The relationships between intelligent terminal devices and communication nodes in a communication network are abstracted as nodes and edges. Based on this, the power–communication coupling network model of the distribution network shown in Figure 2 can be constructed.
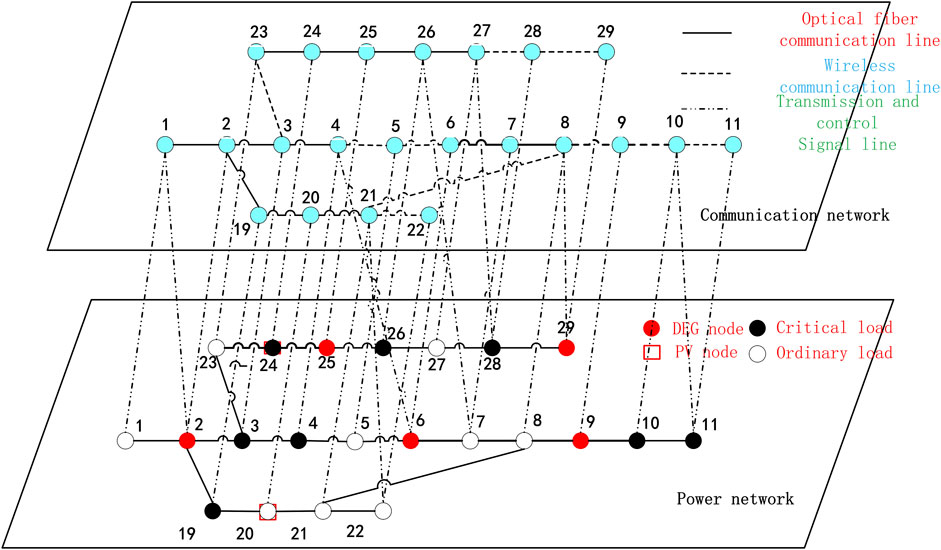
Figure 2. Power-communication coupling network model of distribution network.
The two types of nodes in the model, power node and communication node, have two operating states, namely, normal and fault. The model’s running state can be expressed by setting the state variable in Eqs 6,7 (Guo et al., 2019).
In this formula, fx,i represents the initial, power, and communication operating states of nodes, respectively; kx,i represents the actual, power, and communication operating states of nodes; fxy,i is the overall status of line xy, the power line and the communication line, respectively; Ωe、Ωc、and Ωv is the set of power, communication, and effective operation nodes, respectively; and ΩLe、ΩLc、and ΩLv is the set of power, communication, and effective operation lines, respectively.
In the power–communication network, M nodes are extracted, where M = {m1, m2, m3, ..., mn}. If there is a path between the nodes, the coefficient k is 1, and otherwise 0. Static vulnerability assessment indicators are defined as Eq. 8
In this formula, N(Mi) is the static vulnerability assessment index, a is the weight of each static factor, and Pij(mi) is the destructivity index of the mi node. N(mi) indicates the pressure indicator of the service layer. As can be seen from the above formula, the static vulnerability assessment index is a constant.
The dynamic vulnerability assessment index is defined as Eq. 9
Based on the above formula, the vulnerability assessment model is constructed, and the expression is as follows Eq. 10:
In this formula, M′ is the expression of the vulnerability assessment model, N is static loss, and P is dynamic loss. The loss of power service when the network is attacked is judged according to the change of the M′ value to realize the effective assessment of the vulnerability of the power–communication network.
Before vulnerability assessment, different network attack modes need to be analyzed; that is, attack scenarios need to be generated. In this article, the K-means clustering algorithm (Hagh et al., 2018) is used to reduce the typical Ms0 attack scenarios obtained from previous network attack data to a typical scenario set containing Md attack scenarios, in which the ith sample is represented as λi = [νi, Tst,i, Tdr,i]. The specific steps to reduce the attack scenario are as follows:
Step 1: In Ms0 samples, randomly select K(K = Md) initial cluster centers (λ1, λ2, … , λK);
Step 2: Calculate the Euclidean distance between each sample λi and the cluster center, and aggregate each sample with the nearest cluster center to form K cluster samples;
Step 3: Calculate Dkm, the sum of the distance between the sample and the respective clustering center, according to the following formula and iteratively update the contents of the K cluster sample in Eq. 11.
In this formula, z and λi are the noncentral samples and the central samples of cluster Yi, respectively.
Step 4: Calculate the iteratively updated K clustering centers according to the following formula (12):
Step 5: Repeat steps 2 to 4 until the maximum number of iterations is reached or convergence conditions are met;
Step 6: Calculate the probability distribution of the final K samples according to the Eq. 13.
In this formula, |Yi| is the number of samples contained in cluster Yi.
The probability density of the ith scenario after clustering is Pdi, and its cumulative probability distribution Fdi is shown in the following Eq. 14.
Similar to the determination of line fault state pl, the non-sequential Monte Carlo simulation method can also be used to generate uniformly distributed random numbers xd in the interval [0, 1] and randomly select attack scenarios for the subsequent resilience assessment process. When Fd(i-1)<xd < Fdi, it indicates that scenario i is selected. A set of samples[νi, Tst,i, Tdr,i] can be obtained, and the fault scenario can be further generated according to the parameters of extreme events.
With the development of global renewable energy, growing renewable energy in multiple distribution networks is increasingly important, followed by the network attack probability. The attackers may be aimed at the control system of renewable energy itself and may also use the renewable energy system as a springboard through the data exchange system to attack multiple distribution networks. Therefore, renewable energy must also be included in the construction of the network attack model. Considering the proportion and representativeness of renewable energy in the grid, wind power and photovoltaic are selected to construct renewable energy output models in this article.
In general, the probability density of the wind speed conforms to the Weibull distribution (Eq. 15):
In this formula, σ is the standard deviation of wind speed in statistical time, and μ is the expected wind speed in statistical time. Γ is a gamma function.
The output power of the fan is related to the size of the wind speed and the power characteristics of the fan itself. The output power is (Eq. 17) (Nan et al. (2022):
In this formula, vci and vco are the cut-in wind speed and cut-out wind speed of the fan, vr is the rated wind speed of the fan, Pr is the rated output power of the fan, and k1 and k2 are constants.
The output of distributed photovoltaics is directly related to the magnitude of the light intensity. However, due to the intermittent type and uncertainty of the light intensity, the photovoltaic output will also change with the light intensity. Overall, the photovoltaic output power is PPV. The probability density curve can be approximated by a beta distribution (Eq. 18):
In this formula, Pmax indicates the maximum output power of the photovoltaic power supply. α and β are the two parameters of the beta distribution probability density function, respectively, which can be calculated by calculating the average light intensity μ and the variance σ of the light intensity within a day.
Saccentie et al. (2019) proposed a way of fitting a normal distribution curve based on the analysis of extensive data, taking the expectation of a normal distribution curve as a typical load curve.
Using a large amount of power grid load data, the load data at the same time on different days are fitted to a normal distribution, and, finally, the expectation of normal distribution at each time is taken as the load value at that time of the typical day. The load data at the same time on different days were fitted by maximum likelihood estimation by calculating the load value of 24 periods to the final fitted typical day, and the fitted data were calculated (Eqs 19,20):
In this formula, xia indicates the load remaining after duplicate data are removed from the same period on different days. θi is the unknown quantity to be estimated, a represents the ath load value in the sample at time i, and bi indicates the number of repeated load values in period i. Represents the formula E(xi) expectation for period i, and xi represents the argument of the normal distribution function for the ith period.
The output of new energy units, such as wind power and photovoltaic, in the distribution network is often intermittent and uncertain. Access to energy storage equipment can suppress the output power of new energy, improve the power absorption capacity of the distribution network, and bring certain economic benefits (Nan et al., 2022).
The energy storage system is equivalent to connecting the distributed power supply to some nodes during some operating periods and connecting with different power loads during other periods. That is, the energy storage absorbs active power when charging and emits active power when discharging (Eq. 21):
In this formula, SOC(t) represents the SOC value of the energy storage system at time t, Pc and Pd represent the absorption and emitted power of the energy storage, ηc and ηd represent the efficiency of the absorption and emitted power of the energy storage system, and ∆t represents the capacity of the energy storage system and the duration of charge and discharge.
The DAD model is suitable for the development of defense plans for important infrastructure, including power systems. Generally, the interactive concept of attack and defense in traditional DAD planning models can be divided into the following three layers:
(1) System planning layer: Defenders of this layer need to consider all possible attack scenarios in advance and analyze and classify these scenarios to facilitate the development of defensive measures against these possible attacks to reduce the losses caused by attacks. Common countermeasures can include strengthening the hardened target and adding backup equipment and smart equipment, etc., to minimize the system loss caused by the attack.
(2) System damage layer: Attackers in this layer usually develop unique attack methods and approaches for these advanced layout defense measures after knowing the measures formulated by the system planning layer and try to identify the worst and most serious attack scenarios so as to cause the greatest loss to the system.
(3) System operation layer: after completing the pre-layout defense, the defender of this layer takes some recovery measures to deal with the attack after the attacker carries out the worst attack in order to minimize the system loss. Common recovery measures include load cutting, putting energy storage devices or standby devices in use, and isolating faulty or infected devices to minimize subsequent losses and impact on system operation.
In short, the purpose of the defender is to minimize the system loss, while the purpose of the attacker is to maximize the system loss.
Compared with the traditional distribution network, much energy storage equipment is connected to the current multiple distribution network. When the network attack receives faults or fluctuations, energy storage can be an important resource in the planning of the distribution network DAD. The DAD planning model of a multi-distribution network considering the participation of energy storage under network attack is shown in Figure 3.
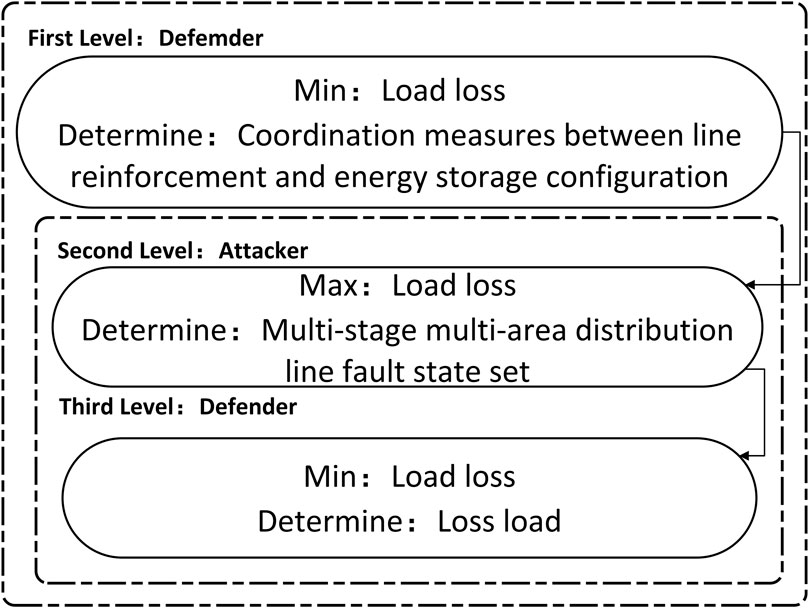
Figure 3. DAD planning model considering energy storage.
The first layer in the figure is the system planning layer. This article proposes the coordination measures of “line reinforcement and energy storage configuration” that can operate with energy storage in distant and important load disasters to reduce the investment cost of grid prevention and minimize the load loss in the distribution network emergency response. The second layer is the disaster attack layer, from the perspective of the attacker, and the third layer of system operation minimizes the load loss in the emergency response determined in the second layer.
The DAD planning model for energy storage configuration established in this article is a three-layer and two-stage optimization problem, which has the same mathematical form as the two-stage adaptive robust optimization model, namely, the three-layer and two-stage structure of min–max–min. Generally, most existing studies use the Bender decomposition and the C&CG algorithms to solve such problems. Compared with the Bender decomposition algorithm, the C&CG algorithm has stronger convergence and solution power (Nan et al., 2022). Therefore, the C&CG algorithm is used.
According to the DAD planning model constructed in Section 3.1, the following matrix is listed (Eq. 22):
In this formula, X is the optimization variable in the first stage, u is the optimization variable in the second stage, which belongs to an uncertain set Us, and Y is the optimization variable of the running layer in the second stage. A, M, N, K, and Jm are the constant coefficient matrix. a, b, and fm are the constant coefficient vector.
According to the application scope of the DAD planning model 1 and the C&CG algorithm constructed above, when using the C&CG algorithm, the solution is necessary to assemble the established model into the main problem (MP) and the subproblem (SP) in advance.
In the DAD planning model of resilient distribution network established in this article (Yang et al., 2024), pre-disaster planning measures need to be formulated for the main problem, that is, to solve the coordinated measures x1 and x2 of line reinforcement and energy storage configuration under the given distribution line fault state scenario ul (Eq. 23):
In this formula, F is the main goal of the problem, i is the number of iterations, and all the variables with subscripts i in the formula are the variables obtained by the ith iteration.
The purpose of the subproblem (SP) is to find the distribution network fault state scenario with the greatest loss. That is, in the case that the optimal solution
Following Zhang et al. (2020), this article adopts the strong duality theory to transform the inner min form of the subproblem into the max form and combine the outer problem into a single-layer optimization problem (Eq. 25).
In this formula,
In this formula,
In this formula, wi is an intermediate variable, and M is a positive integer with a relatively large value. After the above conversion, the problem is converted into a convex and linear problem, which is easy to solve.
The specific solution process is shown in Figure 4.
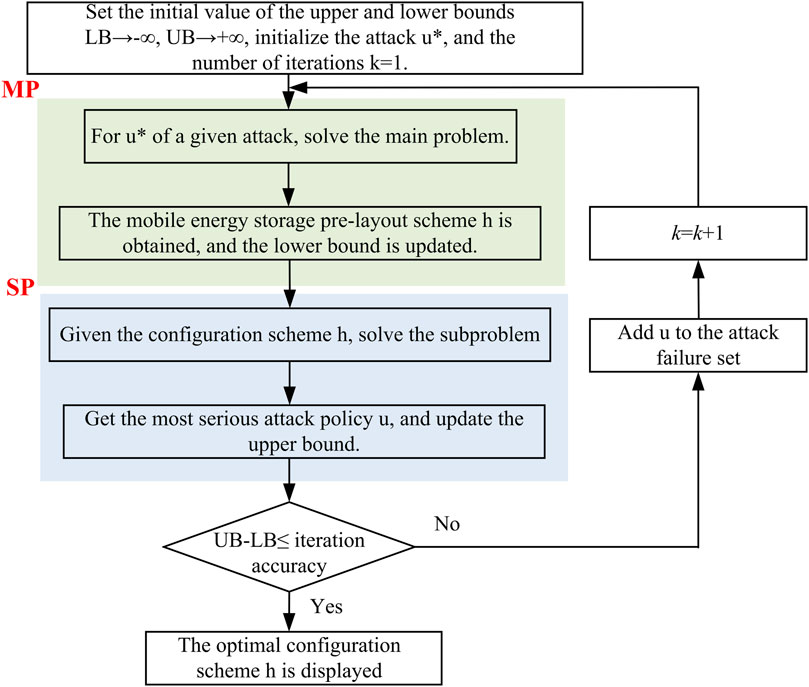
Figure 4. C&CG algorithm solution process.
Based on the above analysis, the specific process of DAD planning of the multi-distribution network for network attacks is shown in Figure 5.
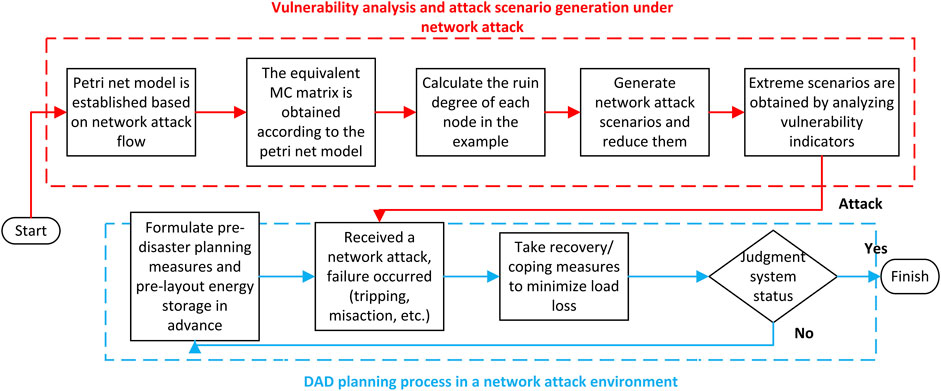
Figure 5. DAD planning process under network attacks.
As shown in the figure, the corresponding Petri net attack model is first constructed according to common network attacks and converted into the corresponding MC matrix to facilitate the subsequent calculation of power grid vulnerability and vulnerable nodes. The vulnerable nodes when network attacks occur are determined by calculating the ruin degree of each node and the MC matrix determined above, and on this basis, the fault scenario for the weak nodes under network attacks in the multi-component power grid is generated.
Considering the generation process of network attack scenarios in the distribution network established in Section 1, after analysis and in combination with the literature [19], the network attack mode in this article will attack nodes in the system and deliberately attack nodes with the most vulnerable analysis results to enhance the effectiveness of attacks and the severity of consequences. At the same time, considering that both power nodes and communication nodes exist in the physical fusion system of power information and considering the inter-network failure probability when the two types of nodes fail, this article chooses to directly attack the power nodes because, in the case of the same inter-network failure probability, continuous attacks on power nodes are more likely to cause chain failures (Wang et al., 2018).
DAD is a three-layer planning model, so it is necessary to plan the first defense layer before carrying out network attacks. Coordination measures for line reinforcement, including energy storage, are taken in this article. After network attacks, corresponding measures are taken for damage and attacks so as to minimize load loss to the greatest extent.
The simulation in this article is carried out under IEEE33 nodes. The specific node configuration and wiring are shown in Figure 6. Among these nodes, 2, 6, 9, 25, and 29 are DEG nodes, and 3, 4, 6, 10, 11, 15, 17, 19, 24, 26, 28, and 33 are important loads; 13, 18, 20, 24, and 33 are PV nodes. The remaining parts are ordinary load nodes.
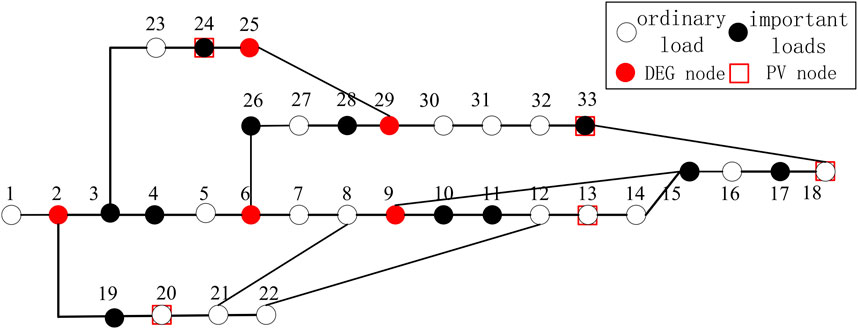
Figure 6. 33 Node distribution.
The main objective is to reduce the cost of the overall pre-layout and ensure as few island nodes as possible after the fault branch is disconnected. Each unit cost is shown in Table 1.

Table 1. Unit costs.
Based on the model established above, this article sets the following scenarios for verification and comparison:
1) A pre-layout robust optimization planning model considering energy storage coordination participation;
2) A robust optimization planning model considering energy storage coordination participation;
3) A pre-layout deterministic optimal planning model considering energy storage coordination participation;
4) A deterministic optimal planning model considering energy storage coordination participation.
Under the above scenario, the pre-layout cost of various optimization planning models and the node wiring situation after failure are shown in Figure 7.
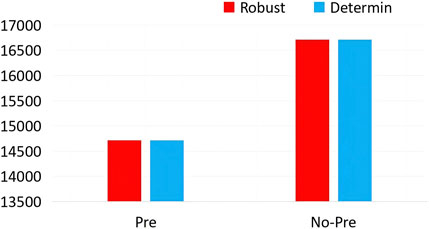
Figure 7. Cost/thousand yuan under each simulation scenario.
The figure shows the sum of the various costs in each of the four cases, that is, whether pre-layout is performed and whether robust or deterministic optimization is used. In the figure, the two columns on the left show the impact of pre-layout on cost when robust optimization is adopted. It can be seen that the cost of the scheme with pre-layout is lower than that without pre-layout. On the right is the cost situation under the condition of deterministic optimization. The pre-layout has obvious advantages, and the cost will be reduced by approximately 15%–20%. For the same pre-layout scheme, robust optimization and deterministic optimization also have a certain impact on the cost, as shown in the blue columns in the figure. A comparison indicates that under the premise of the same pre-layout, the robust optimization method has a lower cost than the deterministic optimization method, and the cost can be reduced by approximately 10%. Based on the above simulation results, we can find that the pre-layout and robust optimization methods have better effects and more advantages for cost control.
Figures 8–11 show the cable connections between nodes after faults in the four scenarios.

Figure 8. Pre-layout robustness optimization.
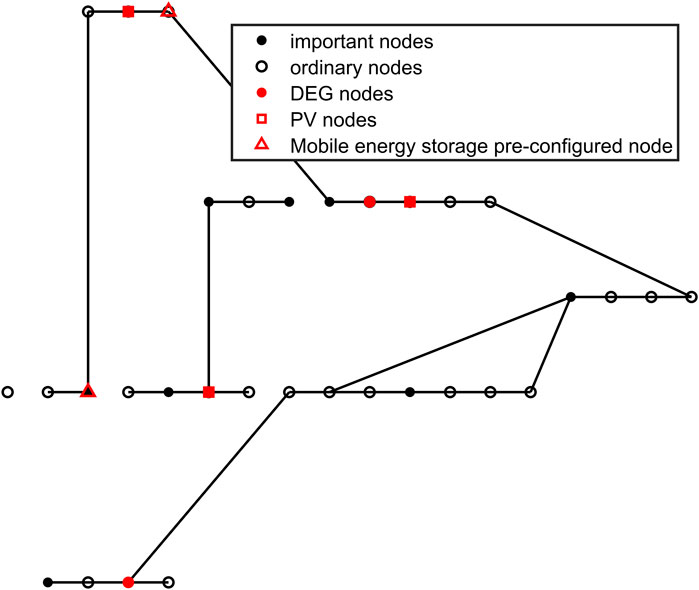
Figure 9. Pre-layout deterministic optimization.
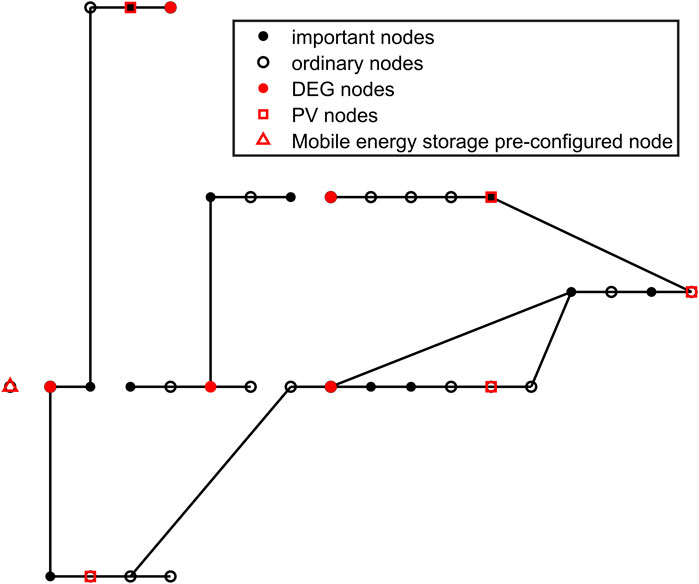
Figure 10. Robust optimization without prelayout.
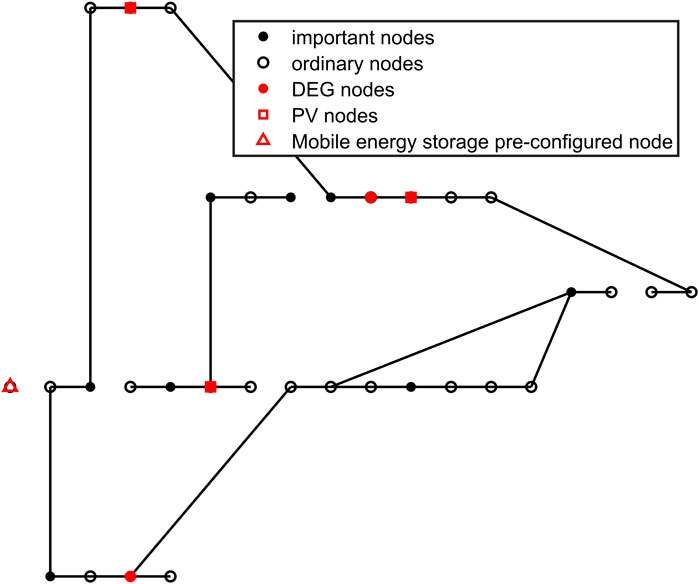
Figure 11. Deterministic optimization without prelayout.
In view of the introduction of energy storage coordination and participation in the previous DAD planning model, the impact of the addition of energy storage equipment on the overall layout cost and line operation status is verified in the simulation. The main scenarios are as follows:
1) The pre-layout robustness optimization planning model considering the participation of energy storage coordination;
2) The pre-layout robustness optimization planning model without considering the participation of energy storage coordination.
In the above scenario, the cost and failure of the node distribution of each scheme are shown in Figures 12, 13 and Table 2.
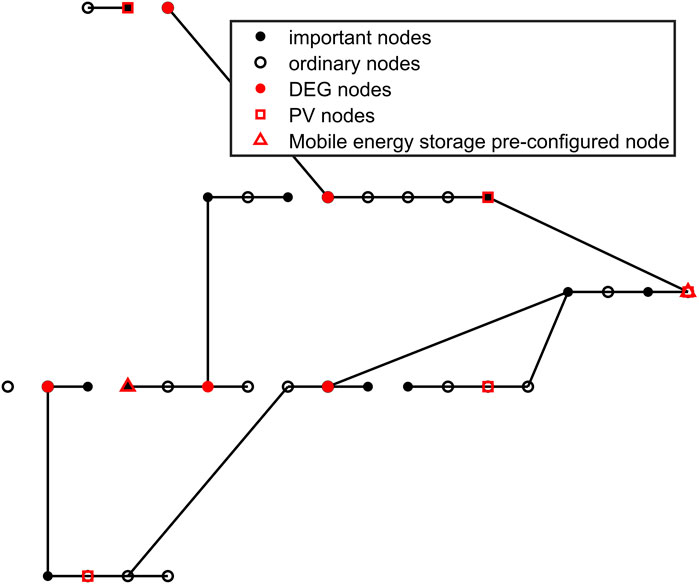
Figure 12. Robust optimization of prelayout considering the participation of energy storage.
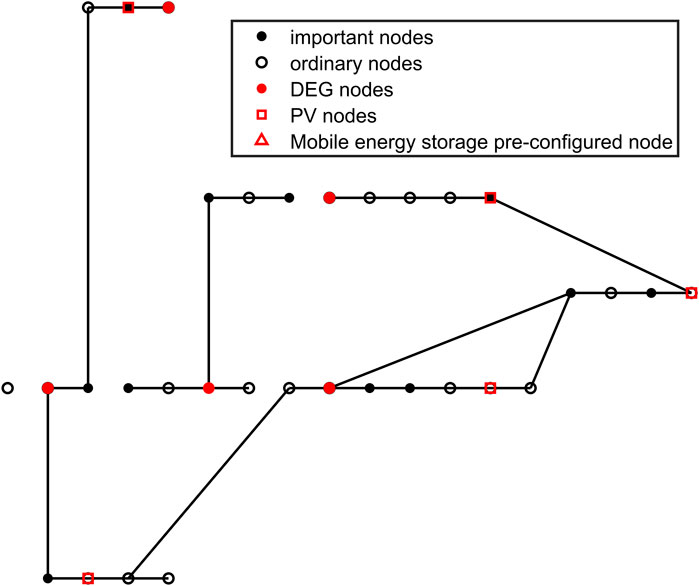
Figure 13. Prelayout robust optimization without energy storage participation.
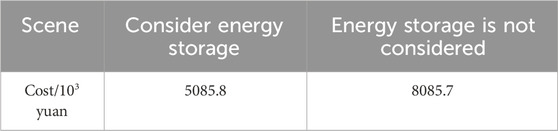
Table 2. Overall layout cost of each scenario.
From the above simulation results, it can be observed that before energy storage is taken into account, the overall layout cost and fault recovery cost are approximately 8085.7 thousand yuan. When mobile energy storage is introduced, the overall cost is reduced to 5,085.8 thousand yuan, a reduction of approximately 40%. In addition, on the premise of fault recovery and line connection operation, comparing Figures 12, 13 indicates that when energy storage is involved, the number of islands composed of three or fewer nodes is three, including one of the important users, and one island is equipped with mobile energy storage, which can be temporarily used as power supply. When energy storage is not considered, the corresponding number of islands is four, including one important user, and there is a DEG node disconnected from the network.
It can be seen that the participation of energy storage has a better effect on the operation of the distribution network after the failure. The main reason for the 60% overall layout cost reduction caused by energy storage participation is that when energy storage is not considered and the network is attacked, the layout mode without energy storage will cause more important load nodes to disconnect, thus increasing the cost. At the same time, the number of island nodes is large, which affects the normal operation of the network. This fully proves the effectiveness and superiority of energy storage coordination participation.
In the context of the integration of traditional power systems with information and communication systems, resulting in a distinctive power information physical fusion system, this article delves into and validates the influence of a DAD planning model that incorporates mobile energy storage coordination on the layout cost and line operation of a multi-distribution network in the event of network attacks. The key contributions of this work are as follows:
1. First, a common network attack flow model is built using a Petri net model, which is transformed and simplified with a matrix. On this basis, considering the vulnerability of the multi-distribution network under network attacks, two parameters, namely, the degree of failure and the degree of failure impact, are introduced to analyze the vulnerability strength of each node in the power-communication network under network attacks. The network attack scenario of the multi-distribution network is simulated and simplified with the help of big data from previous network attack scenarios.
2. Characteristic analysis and model construction are carried out for wind power, photovoltaic, and mobile energy storage that frequently appear in current multi-component distribution networks. At the same time, on the basis of the traditional DAD planning model, mobile energy storage is introduced into the planning to complete the DAD planning model construction under network attacks. In this article, the C&CG algorithm is used to solve the three-layer, two-stage problem of the DAD planning model, and the specific solving steps and flow chart are given.
3. Based on the DAD planning model proposed above, a robust pre-layout optimization planning scheme considering the participation of mobile energy storage is proposed in order to reduce the cost required for adjustment after failure and improve the operation condition. To verify the effectiveness and superiority of the scheme, a control group is also set up according to whether pre-layout is carried out and whether robustness optimization or deterministic top optimization is adopted. A control group was set to determine whether mobile energy storage participated in the pre-layout robustness. The simulation results are verified in a 33-node system.
Finally, according to the simulation results, it is concluded that a DAD planning pre-layout in advance and robust optimization methods have certain effects on cost reduction, and their effects can be superimposed. On the basis of the robustness optimization method of pre-layout, the introduction of coordinated control of mobile energy storage has a significant effect on cost reduction, which proves its effectiveness and superiority.
The original contributions presented in the study are included in the article/Supplementary Material; further inquiries can be directed to the corresponding author.
XuW: conceptualization, visualization, and writing–review and editing. BZ: data curation, validation, and writing–review and editing. DL: formal analysis, supervision, and writing–review and editing. JS: conceptualization, funding acquisition, and writing–original draft. YW: investigation, project administration, and writing–review and editing. XiW: data curation, investigation, and writing–review and editing. QL: investigation, methodology, and writing–review and editing. FT: conceptualization, funding acquisition, and writing–review and editing.
The author(s) declare that financial support was received for the research, authorship, and/or publication of this article. This research was funded by Taizhou Hongchuang Power Group Co., LTD., Science and Technology branch. (SGTYHT/20-JS-224).
Authors XuW, BZ, DL, YW, XiW, and QL were employed by Taizhou Power Supply Company of State Grid Zhejiang Electric Power Co., Ltd.
The remaining authors declare that the research was conducted in the absence of any commercial or financial relationships that could be construed as a potential conflict of interest.
The authors declare that this study received funding from Taizhou Hongchuang Power Group Co, LTD. Science and technology branch. The funder had the following involvement in the study: Study design, data collection and analysis, decision to publish and preparation of the manuscript.
All claims expressed in this article are solely those of the authors and do not necessarily represent those of their affiliated organizations, or those of the publisher, the editors, and the reviewers. Any product that may be evaluated in this article, or claim that may be made by its manufacturer, is not guaranteed or endorsed by the publisher.
Amini, S., Pasqualetti, F., and Mohsenian-Rad, H. (2018). Dynamic load altering attacks against power system stability: attack models and protection schemes. IEEE Trans. Smart Grid 9 (4), 2862–2872. doi:10.1109/tsg.2016.2622686
Cai, Y., Cao, Y., Li, Y., Huang, T., and Zhou, B. (2016). Cascading failure analysis considering interaction between power grids and communication networks. IEEE Trans. Smart Grid 7(1):530–538. doi:10.1109/tsg.2015.2478888
Dahmen, T., Trampert, P., Boughorbel, F., Sprenger, J., Klusch, M., Fischer, K., et al. (2019). Digital reality: a model-based approach to supervised learning from synthetic data. AI Perspect. 1 (1), 2–12. doi:10.1186/s42467-019-0002-0
Deka, D., Baldick, R., and Vishwanath, S. (2014) “Data attack on strategic buses in the power grid:design and protection,” in 2014 IEEE PES general meeting | conference and Exposition. July 27-31, 2014. MD,USA: IEEE National Harbor, 1–5.
Gao, J., Buldyrev, S. V., Stanley, H. E., Xu, X., and Havlin, S. (2013). Percolation of a general network of networks. Phys. Rev. E. 88 (6), 062816. doi:10.1103/physreve.88.062816
Guo, D. R., He, X. T., Lin, G. Q., Luo, C., and Zhong, B. (2019) “Service recovery algorithm for power communication network based on SDN multi-mode channel,” in Proceedings of the 9th International Conference on Computer Engineering and Networks, Changsha, China, October 18–20, 2019.
Hagh, M. T., Amiyan, P., Galvani, S., and Valizadeh, N. (2018). Probabilistic load flow using the particle swarm optimisation clustering method. IET Generation Transm. Distribution 12 (3), 780–789. doi:10.1049/iet-gtd.2017.0678
Lau, P., Wei, W., Wang, L., Liu, Z., and Ten, C.-W. (2020). A cyber security insurance model for power system reliability considering optimal defense resource allocation. IEEE Trans. Smart Grid 5 (11), 4403–4414. doi:10.1109/tsg.2020.2992782
Lin, C. (2005). Stochastic Petri net and performance evaluation of system[M]. 2nd ed. Beijing: Tsinghua University Press, 1–42.
Long, Q., Wang, T., Gu, X., and Wang, T. (2019). Modeling of power communication dependent network and its damage resistance analysis based on community overlap. Power autom. Equip. 39 (11), 165–173 + 204.
Nan, Y., Qin, T., Wu, L., Huang, Yu, Huang, Y., Xing, C., et al. (2022). A multi-agent game based joint planning approach for electricity-gas integrated energy systems considering wind power uncertainty. Electr. Power Syst. Res. doi:10.1016/j.PSR.2021.107673
Nazemi, M., Moeini-Aghtaie, M., Fotuhi-Firuzabad, M., and Dehghanian, P. (2019). Energy storage planning for enhanced resilience of power distribution networks against earthquakes. IEEE Trans. Sustain. Energy ([43]GB/Z29328-2012), 1.
Nguyen, D. T., Shen, Y., and Thai, M. T. (2013). Detecting critical nodes in interdependent power networks for vulnerability assessment. IEEE Trans. Smart Grid 4 (1), 151–159. doi:10.1109/tsg.2012.2229398
Saccentie, E., Hendriks, M., and Smildeak, A. (2019). Corruption of the Pearson correlation coefficient by measurement error and its estimation, bias, and correction under different error models. Sci. Rep. 10 (1), 438. doi:10.1038/s41598-019-57247-4
Shahsanee, S., and Zareei, S. A. (2018). Seismic vulnerability evaluation of power substations' equipment: a review. Infrastruct. Asset Manag. 5 (4), 145–150. doi:10.1680/jinam.17.00008
Shelar, D., and Amin, S. (2017). Security assessment of electricity distribution networks under DER node compromises. IEEE Trans. Control Netw. Syst. 4 (1), 23–36. doi:10.1109/tcns.2016.2598427
Stephane, D., Raja, C., Sirko, S., and Kirchner, F. (2022). Human-centered AI and robotics. AI Perspect. 4 (1), 1. doi:10.1186/s42467-021-00014-x
Wang, T., Sun, C., Gu, X., and Qin, X. (2018). Modeling and vulnerability analysis of power communication coupling network. Proc. CSEE 38 (12), 3556–3567. doi:10.13334/J.0258-8013.PCSEE.170233
Yan, J., Tang, Y., He, H., and Sun, Y. (2015). Cascading failure analysis with DC power flow model and transient stability analysis. IEEE Trans. Power Syst. 30 (1), 285–297. doi:10.1109/tpwrs.2014.2322082
Yang, N., Dong, Z., Wu, L., Zhang, L., Shen, X., Chen, D., et al. (2022). A comprehensive review of security-constrained unit commitment. J. Mod. Power Syst. Clean Energy 10 (3), 562–576. doi:10.35833/mpce.2021.000255
Yang, N., Xun, S., Liang, P., Ding, L., Yan, J., Xing, C., et al. (2024). Spatial-temporal optimal pricing for charging stations: a model-driven approach based on group price response behavior of EVs. IEEE Trans. Transp. Electrification, 1. doi:10.1109/TTE.2024.3385814
Yi, T., Qian, C., Mengya, L., Qi, W., Ming, N., and Yun, L. (2016). Network attack in power information physical fusion system Analysis on. Automatization electromechanical Syst. 40 (6), 1–4. doi:10.7500/AEPS20160315001
Yu, An, Dong, L., Chen, F., and Wei, W. (2019). Risk analysis of cyber physical distribution network operation considering cyber attack. Power Syst. Technol. 43 (7), 2345–2352. doi:10.13335/j.1000-3673.pst.2018.1483
Yu, W., Xue, Y., Luo, J., Ni, M., Tong, H., and Huang, T. (2016). An UHV grid security and stability defense system:considering the risk of power system communication. IEEE Trans. Smart Grid 7 (1), 491–500. doi:10.1109/tsg.2015.2392100
Zhang, P. (2020). Research on Collaborative optimal allocation of distributed power and energy storage in distribution network based on two-layer programming model [D]. Xian Univ. Sci. Technol. doi:10.27398/dcnki.gxalu.2020.000621
Zhang, P. (2021). Research on risk assessment and network attack of power distribution network information physical system [D]. Beijing: North China Electric Power University.
Keywords: multi-component distribution network, cyber attack, DAD planning model, mobile energy storage, C&CG algorithm, data-driven
Citation: Wang X, Zhang B, Li D, Sun J, Wang Y, Wang X, Liang Q and Tang F (2024) Research on data-driven, multi-component distribution network attack planning methods. Front. Energy Res. 12:1425197. doi: 10.3389/fenrg.2024.1425197
Received: 29 April 2024; Accepted: 18 June 2024;
Published: 30 July 2024.
Edited by:
Yitong Shang, Hong Kong University of Science and Technology, Hong Kong SAR, ChinaReviewed by:
Xiaolong Jin, Technical University of Denmark, DenmarkCopyright © 2024 Wang, Zhang, Li, Sun, Wang, Wang, Liang and Tang. This is an open-access article distributed under the terms of the Creative Commons Attribution License (CC BY). The use, distribution or reproduction in other forums is permitted, provided the original author(s) and the copyright owner(s) are credited and that the original publication in this journal is cited, in accordance with accepted academic practice. No use, distribution or reproduction is permitted which does not comply with these terms.
*Correspondence: Jinzhou Sun, MTA5NDc5MDk3OUBxcS5jb20=
Disclaimer: All claims expressed in this article are solely those of the authors and do not necessarily represent those of their affiliated organizations, or those of the publisher, the editors and the reviewers. Any product that may be evaluated in this article or claim that may be made by its manufacturer is not guaranteed or endorsed by the publisher.
Research integrity at Frontiers
Learn more about the work of our research integrity team to safeguard the quality of each article we publish.