 Yibin Fang
 Wanneng Yu
 Weiqiang Liao1,2,3
 Xin Dong
94% of researchers rate our articles as excellent or good
Learn more about the work of our research integrity team to safeguard the quality of each article we publish.
Find out more
ORIGINAL RESEARCH article
Front. Energy Res., 24 July 2024
Sec. Advanced Clean Fuel Technologies
Volume 12 - 2024 | https://doi.org/10.3389/fenrg.2024.1423931
This article is part of the Research TopicLife Cycle Analysis of Alternative Fuels for the Maritime Sector and Similar IndustryView all 5 articles
Aiming at the solid oxide fuel cell (SOFC) applied to the ship DC microgrid in the face of pulse load disturbance is prone to make the SOFC voltage drop too large leading to the DC grid oscillation problem. In this paper, a stability criterion method for SOFC-Li battery DC system based on hybrid potential function is proposed. Firstly, a mathematical model of shipboard DC microgrid with SOFC-Li battery is established and the accuracy of the model is verified. Then, the stability criterion of the system based on the hybrid potential function under large disturbances is constructed. Subsequently, the effects of system stability under impulse load conditions were analysed under different parameters. Based on the constructed criterion, simulation verification of the stability boundary conditions of the SOFC system operating independently or jointly with a lithium battery system is carried out. The experimental results show that the proposed stability criterion and control strategy are effective in accurately predicting the system stability boundary. The experimental results verify the effectiveness of the proposed method in improving the stability of the system and provide a theoretical basis for further research on the dynamic characteristics of SOFC systems under complex load conditions.
The Earth is currently experiencing natural disasters as a consequence of global warming, with greenhouse gas emissions increasing annually. The promotion of the green and low-carbon transformation of energy will propel the world’s renewable energy sector into a new phase of development. Accelerating the application of hydrogen energy and fuel cell technology on ships Fuel cells can effectively reduce greenhouse gas emissions, alleviate marine pollution caused by diesel generator leakage, and increase the proportion of green hydrogen energy used in the transport sector (Ali et al., 2021). Although there are many studies that make important contributions to diesel generator performance, fuel and emissions, (Chen et al., 2015; Chen et al., 2022; Wang et al., 2022), fuel cell power generation technology has a high application value in ships as a future energy source. According to the literature, fuel cells can be classified into direct, indirect and regenerative types according to the fuel type, and alkaline fuel cells, phosphoric acid fuel cells, molten carbonate fuel cells, solid oxide fuel cells (SOFC) and proton exchange membrane fuel cells according to the electrolyte type (EG and G Technical Services, 2004). Literature studies (Steele and Heinzel, 2001; Ding et al., 2021) have shown that SOFCs offer greater fuel flexibility as high temperature fuel cells. In addition, according to the literature (Duong et al., 2022), SOFCs offer higher value and efficiency as small-signal distributed generation systems. Literature (Zhu and Tomsovic, 2002) proposes to model the performance analysis of microturbine and fuel cell load following capability using an embedded power distribution system for a microturbine power plant and an integrated fuel cell power plant as an example. The control strategy and load following service of this distribution system were simulated to demonstrate that the micro gas turbine and fuel cell can track the load changes and thus significantly improve their economic value. Therefore, the application of SOFC in ships is promising.
Microgrids consist of multiple renewable energy systems, energy storage systems and various loads (Du et al., 2013; Shekhar et al., 2017; Zhou et al., 2020a; Zhou et al., 2020b). They operate flexibly and are highly reliable, making them one of the most effective ways to integrate renewable energy. Among them, DC microgrids have been widely studied due to their high efficiency, simple control structure, and the absence of phase and reactive power problems associated with AC systems (Liu and Bian, 2017). Therefore, DC microgrids have been successfully applied in various fields such as electric ships, electric vehicles, aircraft, data centres, etc (Hayashi et al., 2015; Buticchi et al., 2017; Chub et al., 2018; Zhao et al., 2018)
In practical applications, DC microgrids are susceptible to large-signal disturbances such as impulsive loads, large load variations or severe grid faults, especially in shipboard DC microgrids. These large-signal disturbances can cause transient responses that do not reach a steady state, highlighting the nonlinearity of the system (Kwasinski and Onwuchekwa, 2011). Under large disturbances, the nonlinearity of the power electronic systems in DC microgrids may lead to system collapse, requiring appropriate control strategies. Therefore, in order to guide the formulation of control strategies, it is necessary to analyse the large signal stability of the system and to quantitatively investigate the influence of system and control parameters on the stability.
The Brayton-Moser mixed-potential theory is an effective tool for analysing the large-signal stability of nonlinear systems and can derive analytical stability criteria for nonlinear systems (Brayton and Moser, 1964). A mathematical model based on mixed potential function theory is established for a constant power load (CPL) system with a two-stage LC filter, and stability criteria for the system under large disturbances are derived. Constraints on the parameters of the filter components are given. However, the case where the DC power source is the source converter has not been considered (Liu and Zhou, 2011). Stability analysis under large disturbances was carried out in a DC system with an 18-pulse rectifier, but the influence of control parameters was not considered (Griffo and Wang, 2012). Stability criteria for the large signal stability of a BUCK/BOOST converter with a CPL load were derived using mixed potential theory and the effect of controller parameters on stability was analysed (Huang et al., 2017). A method of deriving stability criteria suitable for droop control systems was proposed based on the proportion of output power from multiple sources, and the stability limit of the droop coefficient under multiple sources was analysed (Li et al., 2018). However, none of the above literature provided analytical stability criteria, and their guidance for system parameter design was relatively weak. They did not consider BOOST converters when all the converters on the power source side were BUCK converters, and they also did not consider the influence of the power source characteristics.
The application of the hybrid potential function in current research scenarios rarely focuses on the Boost converter in power source-side systems, especially concerning SOFC systems. There is a lack of consideration for power source characteristics and the derivation method for the transition from the power source side to the output side of the Boost converter, which hinders the analysis of system stability under large disturbances. Therefore, it is crucial to consider the power source characteristics and study the Boost converter on the power source side. To improve the accuracy of the derived criteria, the hybrid potential function containing both power source and converter parameters needs to be verified. This will effectively prevent errors or simulation failures due to the complexity of the criteria. In summary, this paper derives stability criteria for large disturbances based on the characteristics of the SOFC system and conducts MATLAB/Simulink simulations to verify the proposed method and the accuracy of the derived stability criteria. Finally, system parameters are adjusted to meet the requirements of the International Association of Classification Societies (IACS) “Electrical and Electronic Installations” for DC power systems.
The dynamic model of the SOFC system is shown in Figure 1. Starting from the fuel input, the dynamic structural system of the SOFC is modelled by several inertial elements that are used to simulate the phases of the fuel cell system such as the measurement link, the fuel valve control function, the fuel handling delay, and the electrochemical dynamic link (Padullés et al., 2000). In Figure 1,
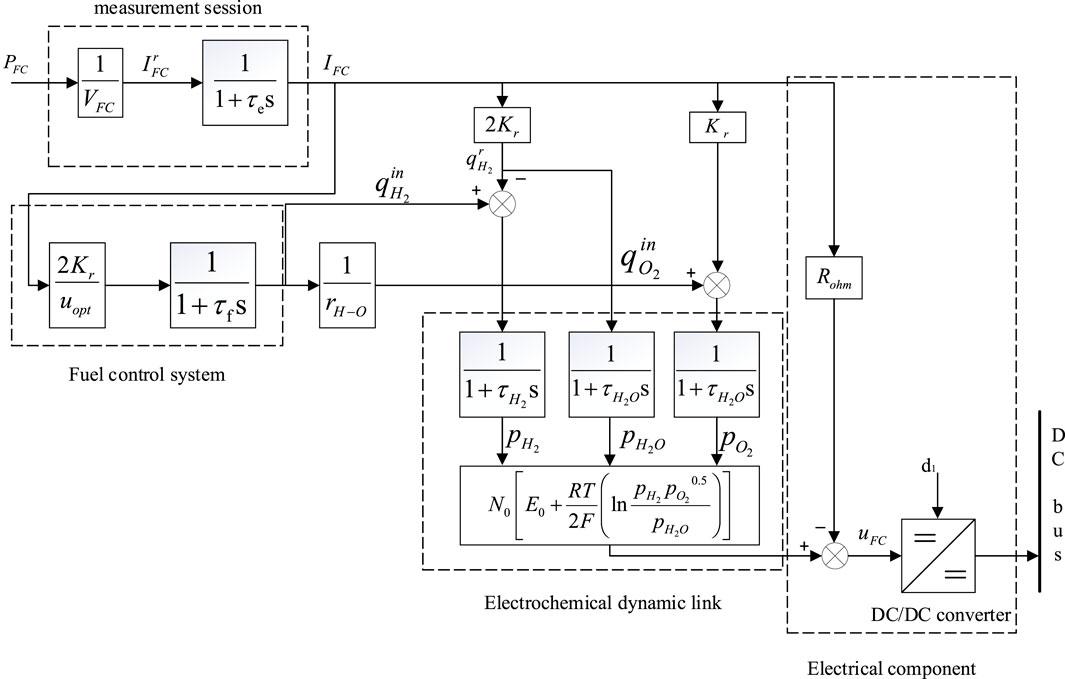
Figure 1. Dynamic model of SOFC.
The open-circuit voltage (OCV) of a series-connected SOFC unit and the Nernst voltage can be expressed as (Blomen and Mugerwa, 1993; Mohan et al., 1993):
Where,
The formula for the partial pressure of hydrogen, oxygen and water is:
Where,
The ohmic voltage can be expressed as:
Where,
Applying Nernst equation and Ohm’s law to consider Ohm loss, the voltage of a solid fuel cell can be expressed as:
Where,
The role of the fuel utilization control system is to ensure that the fuel cell operates within a safe and reliable range by controlling the rate of fuel intake. In the model, the ratio of molar flow rates of hydrogen to oxygen is defined. The stoichiometric ratio of the complete reaction between hydrogen and oxygen is 2:1. To ensure complete reaction between oxygen and hydrogen while keeping the pressure difference between the anode and cathode below a certain threshold, an excess of oxygen needs to be provided.
The formula for optimal fuel cell utilization is:
Where,
Insufficiently used fuel, the current of the fuel cell must not fall below the minimum stack current (the cell voltage will rise rapidly). Excessively used fuel, the current of the fuel cell must not exceed the maximum stack current (fuel shortage will cause permanent damage to the cell). Under normal circumstances, the utilization rate is set at 80%–90%, from which Eq. 6 can be derived as a safe operating range for the battery current.
As shown in Figure 1. Specifically, the SOFC must operate within its rated power range and must be maintained within the range described earlier. Moreover, in practical applications, it must be constrained within a certain range to meet the voltage specifications of the load.
By applying the Nernst equation, based on Eqs 1, 2, 5, the following steady-state:
Finally, Substituting Eq. 4 based on Eqs 3 and 7 gives the output voltage of SOFC as:
Eq. 10 represents the output voltage of SOFC during steady-state operation. Its operating parameters are shown in Table 1.
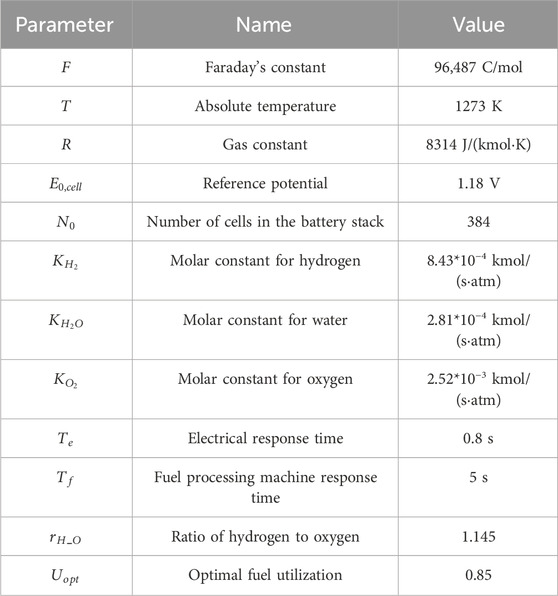
Table 1. SOFC system model parameters.
The mathematical model of the shipboard DC microgrid studied in this paper is shown in Figure 2, which consists of the following components:
1) Solid oxide fuel cell (SOFC) and lithium battery energy storage units are connected to the DC bus through DC-DC converters.
2) Loads are connected to the DC bus through closed-loop DC-DC (DC-AC) converters, with external characteristics as constant power loads.
3) The shipboard DC microgrid has relatively short lines, and line impedance is not considered.
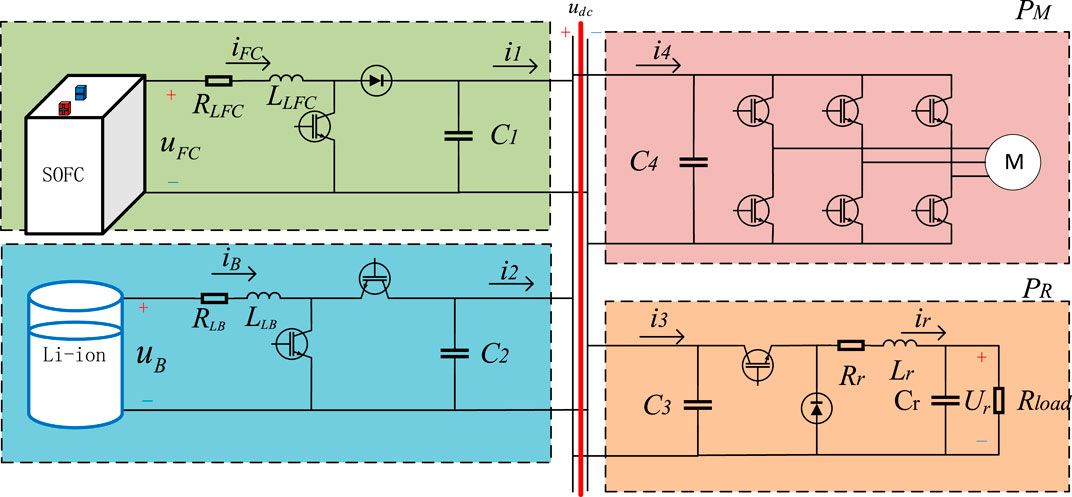
Figure 2. Topological structure of shipboard DC microgrid.
The simplified cascaded converter system of the shipboard DC microgrid includes two source converters, one load converter, and one propulsion motor inverter. According to the state-space averaging modeling method, the dynamic representations of the source converter is as follows:
Where,
As shown in Figure 3, a two-loop control strategy is used to regulate the DC bus voltage and current, using proportional-integral (PI) controllers.
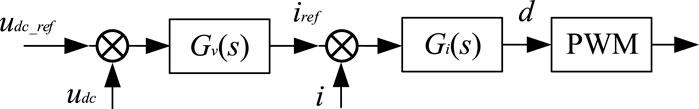
Figure 3. Voltage-current double closed-loop control structure.
The transfer function representations of the current loop and voltage loop are expressed as follows:
Where,
For BUCK converters and DC/AC inverters with voltage closed-loop control, the output dynamic characteristics can be equivalent to constant power load, and the external negative impedance characteristics are shown, and the voltage and current relationship is as follows:
Where,
The hybrid potential function is a special form of the Lyapunov function first proposed by R. K. Brayton and J. K. Moser for its application in nonlinear circuits (Brayton and Moser, 1964). In this paper, the hybrid potential function theory is applied to study the stability of constant power load systems under large disturbances, which is particularly suitable for analysing the stability of circuits containing negative impedance elements (Jeltsema and Scherpen, 2009). The hybrid potential function includes the voltage potential function and the current potential function (Weiss et al., 1998). The application of the hybrid potential function method involves two steps:
(1) Construct the hybrid potential function model of the system;
(2) Based on the characteristics of the model, apply the corresponding stability theorem to obtain stability criteria under large disturbances. The hybrid potential function model P can be constructed directly based on resistors, capacitors and inductors in nonlinear circuits. If
In Eq. 13, the first term on the right-hand side represents the current function of all non-energy-storing branches in the circuit, and the second term represents the sum of the energies of all capacitive branches in the circuit. Here
According to Kirchhoff’s law, the differential equations of the nonlinear circuit can be expressed as follows:
Based on the above analysis, the unified form of the hybrid potential function can be obtained as follows:
Where,
The theory of mixed potential functions has three stability theorems. In this article, the third stability theorem is adopted to analyse the stability of the system under large disturbances. To facilitate the application of the third stability theorem of the mixed potential function theory, the stability criterion is reformulated as follows:
Let
The reconstructed hybrid potential function is as follows:
If for any
Firstly, an equivalent model applicable to the stability analysis of ship DC microgrid is established. Then, based on the theory of hybrid potential functions, the hybrid potential function of this system is constructed, taking into account the influence of nonlinear control loops. The stability criterion for the ship DC microgrid is derived. Finally, the stability of the system under large disturbances is analysed using the stability criterion.
As there is a current inner loop controller in the source converter, it has the characteristics of a controllable current source. As the voltage on the source side decreases or increases, the current will change, further exacerbating the voltage fluctuations. Therefore, the load-side converter can also be modelled as a controllable current source. Thus, the boost on the source side, the bidirectional DC-DC converter, and the buck on the load side, the DC/AC converter, can be simplified as controllable current sources, denoted by
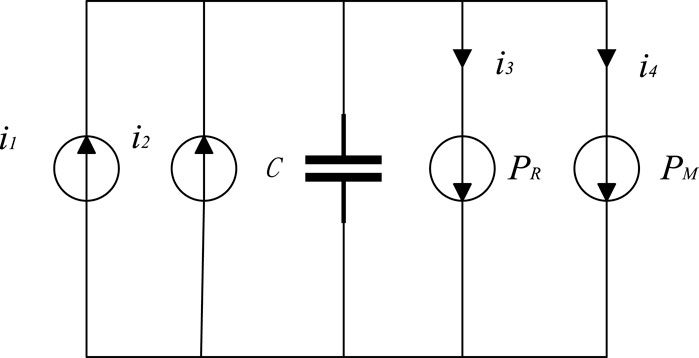
Figure 4. Simplified model of the system under large disturbances.
The hybrid potential function is obtained by summing the current potential function of the non-energy storage components and the product of voltage and current in the capacitor branches.
For the circuit shown in Figure 4, the current potential functions are as follows:
The product of voltage and current in the capacitor branch is obtained from Figure 4 and transformed from i3 and i4 by Eq. 12:
The sum of Eqs 18, 19 yields the system’s hybrid potential function:
By substituting Eq. 20 into Eq. 14, we can verify the correctness of the obtained hybrid potential function:
The results of Eq. 21 show that the derived hybrid potential function of the system is correct and from Eq. 17 when
Then, transforming the derived hybrid potential function (20) into the unified expression shown in Eq. 15, we obtain:
From Eq. 22, it can be seen that the hybrid potential function of the system satisfies the third stability theorem and is given by Eq. 16:
According to the theorem, we have:
To derive the rate of change of the output current of the power source converter relative to the bus voltage, we first solve the differential equation represented by the first term of Eq. 9:
Where,
At steady state,
Similarly, from Eqs 9 and 11 we can obtain the output current i2 of the bidirectional DC-DC converter:
According to Eqs 27, 28, we can obtain the partial derivatives of
Combining Eq. 24 and 29, we can derive the stability criterion for the direct current microgrid with dual closed-loop control containing SOFC as shown in Figure 2 under large disturbances.
Considering the safety constraints of the SOFC on the large signals of the system, we derive the stability criterion for the DC microgrid with motor shock loads and direct loads under large disturbances. This derivation is based on the steady-state electromotive force of the SOFC obtained from Eq. 8 and the stability criterion provided by Eq. 30 for the two DC-DC converters on the power source side operating simultaneously under dual control, as shown in Figure 2.
Furthermore, the prerequisite for the stable operation of the system is to ensure power balance, meaning that the power of the constant power load should be less than the maximum power that the system can provide. Therefore, we have:
Equations 31, 32 are the large disturbance stability criteria of the DC ship microgrid of SOFC.
The primary focus of this study is the impact of SOFC power and converter parameters on the large signal stability of system. A transfer function model of the circuit was established in MATLAB/Simulink. The initial values of state variables and intermediate variables were calculated using a steady-state model. The step responses of the simulation circuit model and the transfer function model were compared. A step signal was applied at t = 0.5 s. The waveforms of the SOFC voltage, SOFC current, DC bus voltage, and DC bus current are shown in Figure 5. It can be observed that the step response curves of the simulation circuit model and the transfer function model have an error of less than 11%, demonstrating high consistency. Furthermore, the bus voltage and current are almost identical in steady-state, thereby validating the effectiveness of the simulation model.
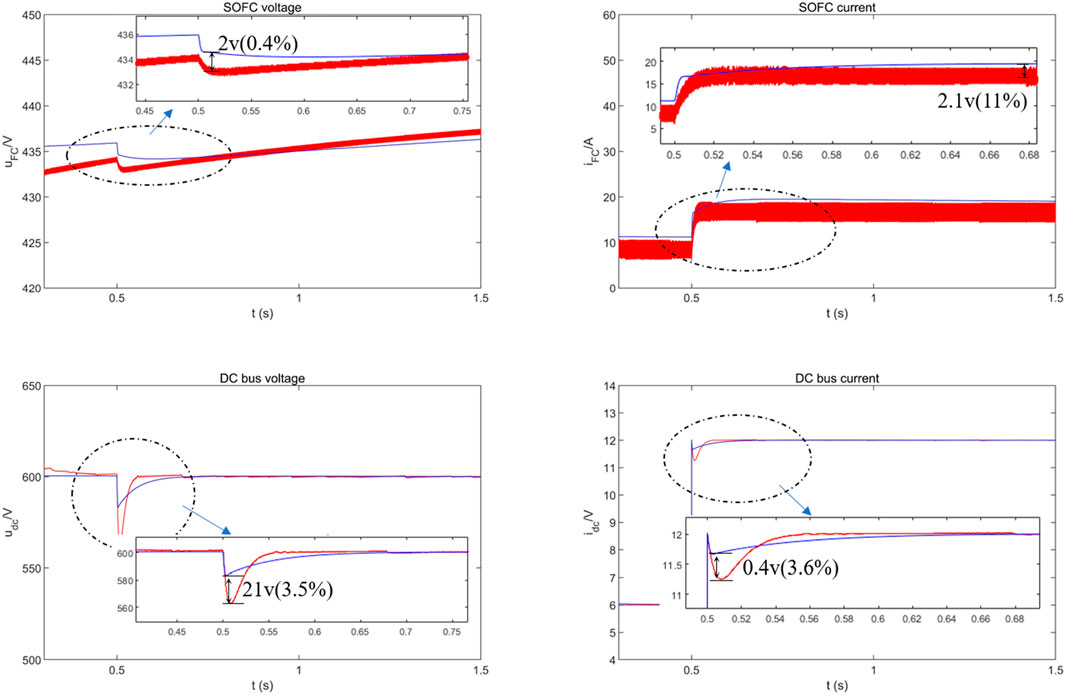
Figure 5. Validation of circuit model and transfer function model.
Due to the slow response characteristics of the SOFC, the output voltage is greatly affected by the current, especially under large loads. Therefore, the large disturbance stability of the system is analyzed in the scenario where the energy storage system is not involved in supporting the bus voltage and the SOFC supports the load alone.
A case study was conducted on Boost and bidirectional DC/DC converters utilising dual closed-loop control. A simulation model of the system depicted in Figure 3 was constructed on the Matlab/Simulink platform for validation purposes. The system parameters are presented in Table 2.
Table 2. System parameters.
In order to investigate the impact of SOFC output voltage on stability, while maintaining
To verify the validity of the proposed stability limits, the initial load of the DC load is 20 kW, the power of the drive motor is 50 kW, and the loads carried by the SOFC and the Li-ion battery are 40 kW and 30 kW respectively, while the system parameters remain unchanged. The large perturbation settings of the system are as follows: the Li-ion battery is disconnected at t = 4 s, resulting in a sudden increase of the load by 30 kW. The critical value of the large signal stability of the system is
From the above, it can be seen that at t = 4 s, the Li-ion battery is disconnected and the system large perturbation is 30 kW, and according to the large-signal stabilisation condition in Eq. 33, the system satisfies the large-signal stabilisation condition before the jump. However, after the jump, the voltage gradually drops to the stability boundary due to the slow response characteristic of SOFC and does not satisfy the stability condition. The simulation results are shown in Figure 6: the system is stable before t = 4 s. After t = 4 s, it can be seen that the dc bus voltage drops and oscillates after the sudden increase of the load disturbance. When the SOFC voltage drops below the stability boundary condition, it causes the system to collapse, indicating that the system is unstable.
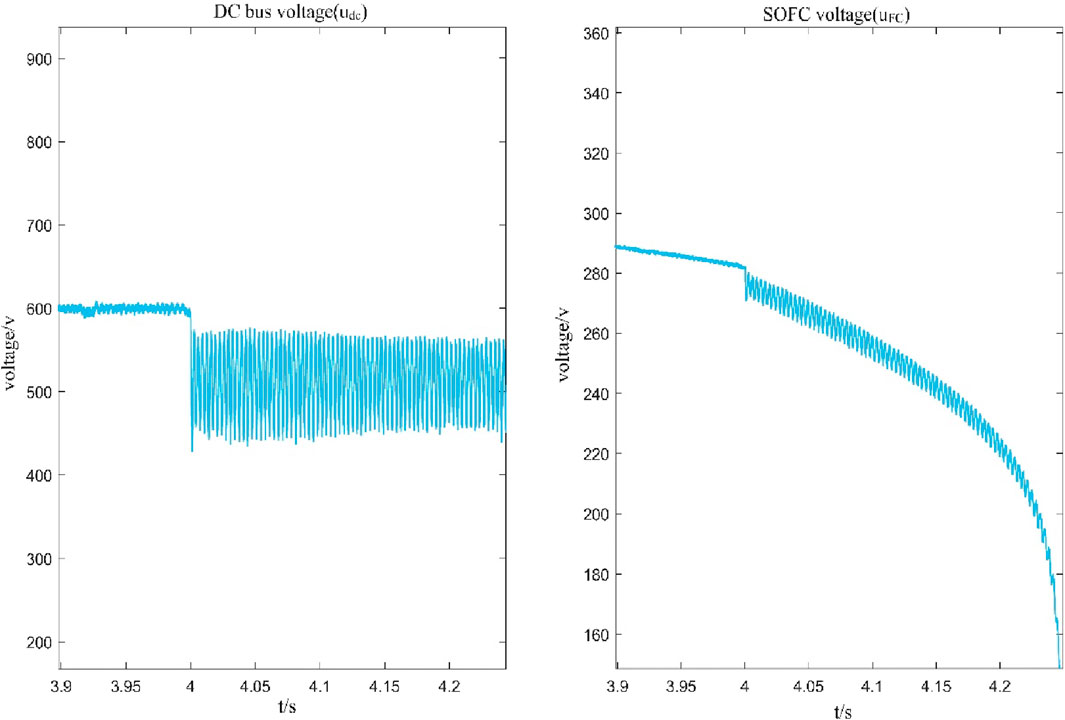
Figure 6. Shows the simulation waveform when the load Li-ion battery is disconnected and the major system disturbance is 30 kW.
The SOFC and the Li-ion battery carry a load of 20 kW and 30 kW respectively when the engine power is 30 kW, while other system parameters remain unchanged. The large disturbance of the system is set as follows: the Li-ion battery is disconnected at t = 4 s, resulting in a sudden increase of the load by 30 kW. The critical value of the system’s large signal stability is
The system rapidly increases from 20 kW to 50 kW at t = 4 s. The simulation results are shown in Figure 7: before t = 4 s the system is stable. After t = 4 s, it can be seen that the DC bus voltage drops and oscillates after a sudden increase in the load disturbance. However, the system eventually returns to equilibrium under large disturbances as the
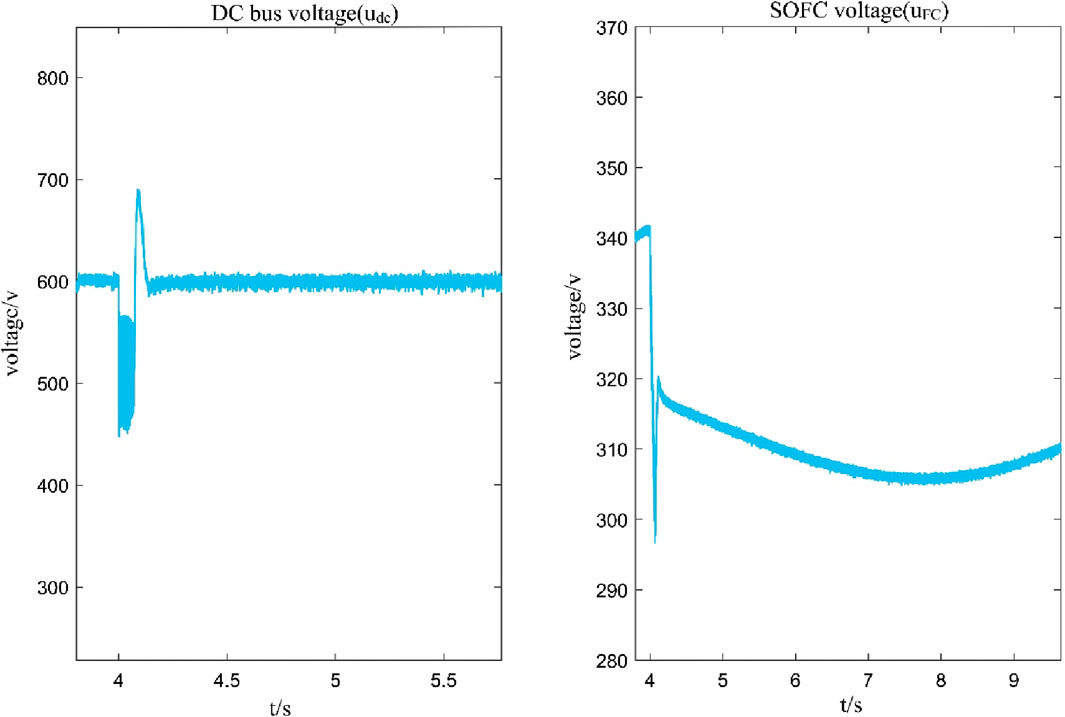
Figure 7. Depicts the simulation waveform when the load power switches from 20 kW to 50 kW.
The above two simulation results confirm that the proposed stability boundary can effectively predict the drop limit of
According to the stability criterion Eq. 33 of the system, it can be seen that the stability of the system under large disturbances is closely related not only to the SOFC power voltage
The large perturbation of the system is set to occur at 4 s. To simulate various operating conditions during ship operation, the propulsion motor load is gradually increased from an output power of 30 kW to a rated power of 150 kW. As analysed in the previous section, the DC load is equivalent to the CPL. Eq. 32 shows that different control parameters lead to different boundary conditions. Due to the large load disturbances, it is necessary to change the control parameters of the lithium battery to improve the system’s resistance to disturbances. Based on the parameters in Table 2, the boundary conditions under the above mentioned large disturbances can be calculated as follows:
Here five sets of Boost converter double loop control parameters are used as shown in Table 3. The simulation results of the dynamic response characteristics of the ship DC microgrid system under its control are shown in Figure 8. The reference value of DC bus voltage is

Table 3. Stability prediction of variables
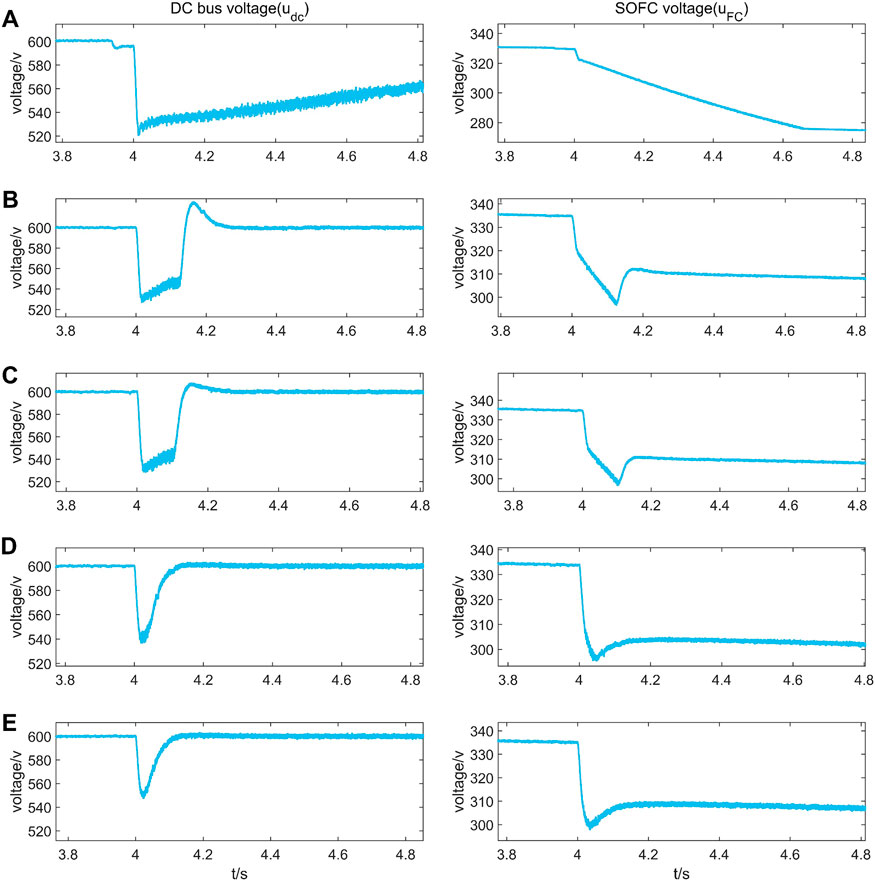
Figure 8. Simulation of bus voltage and SOFC voltage at different operating points of the DC microgrid. (The labels (A–E) in the figure are the simulation data for operating conditions (A–E) in Table 3, respectively.)
Since the system cannot satisfy the criterion in IACS after perturbation, the PI parameters are raised as shown in Table 3 to satisfy the stability boundary system is stable. The simulation results are shown in Figure 8E, where the load voltage drops to within 540 V after a large perturbation, within udc±10%, and the voltage recovery speed is 0.1 s. The results show that the system is stable and meets the criteria in IACS.
Based on the above analyses, it can be seen that the stability criterion Eqs 33, 34 can predict the critical value of the
In this paper, based on the theory of mixed potential function, we derive the large-signal stability derivation method applicable to the hybrid system with SOFC lithium battery, obtain the mixed potential function of the system, and analyse the stability criterion of the output voltage with SOFC and the control parameters of Boost converter. The following conclusions are drawn:
(1) Based on the hybrid potential function, the stability criterion of the system with source-terminal voltage is derived, and the impact of source-terminal voltage drop on the system stability is analysed to be relatively large.
(2) The proposed stability criterion calculation method is simple and analytical, and can more accurately predict the influence of SOFC power unit control parameters on system stability.
(3) under the condition of shock load step change, the double closed-loop PI control can effectively suppress the DC bus fluctuation and accelerate the system steady state recovery, so as to improve the stability of the converter control system.
In conclusion, the proposed methodology and stability guidelines can provide good stability guidance for the design of integrated and coordinated control of a ship’s DC microgrid containing SOFC power supplies.
The original contributions presented in the study are included in the article, further inquiries can be directed to the corresponding author.
YF: Writing–review and editing, Writing–original draft. WY: Writing–review and editing. WL: Writing–review and editing. RY: Writing–review and editing. CL: Writing–review and editing. CZ: Writing–review and editing. XD: Writing–review and editing.
The author(s) declare that financial support was received for the research, authorship, and/or publication of this article. This paper was supported by the National Natural Science Foundation of China (52171308); Natural Science Foundation of Fujian Province, China (2022J01333); Innovation Laboratory for Sciences and Technologies of Energy Materials of Fujian Province (2022J01813).
The authors declare that the research was conducted in the absence of any commercial or financial relationships that could be construed as a potential conflict of interest.
All claims expressed in this article are solely those of the authors and do not necessarily represent those of their affiliated organizations, or those of the publisher, the editors and the reviewers. Any product that may be evaluated in this article, or claim that may be made by its manufacturer, is not guaranteed or endorsed by the publisher.
Ali, H. A., van Biert, L., Sapra, H., Mestemaker, B., and Negenborn, R. R. (2021). Component sizing and energy management for SOFC-based ship power systems. Energy Convers. Manag. 245, 114625. doi:10.1016/j.enconman.2021.114625
Brayton, R. K., and Moser, J. K. (1964). A theory of nonlinear networks. I,II. Quart. Appl. Math. 12, 1–33. doi:10.1090/qam/169746
Buticchi, G., Costa, L., and Liserre, M. (2017). Improving system efficiency for the more electric aircraft: a look at dc/dc converters for the avionic onboard dc microgrid. IEEE Ind. Electron Mag. 11 (3), 26–36. doi:10.1109/mie.2017.2723911
Chen, Z., Li, K., Liu, J., Wang, X., Jiang, S., and Zhang, C. (2015). Optimal design of glucose solution emulsified diesel and its effects on the performance and emissions of a diesel engine. Fuel 157, 9–15. doi:10.1016/j.fuel.2015.04.049
Chen, Z., Wang, L., Wei, Z., Wang, Y., and Deng, J. (2022). Effect of components on the emulsification characteristic of glucose solution emulsified heavy fuel oil. Energy 244 (Part B), 123147. doi:10.1016/j.energy.2022.123147
Chub, A., Vinnikov, D., Liivik, E., and Jalakas, T. (2018). Multiphase quasi Z-source DC-DC converters for residential distributed generation systems. IEEE Trans. Ind. Electron 65 (10), 8361–8371. doi:10.1109/tie.2018.2801860
Ding, X., Lv, X., and Weng, Y. (2021). Fuel-adaptability analysis of intermediate-temperature-SOFC/gas turbine hybrid system with biomass gas. J. Energy Resour. Technol. 143 (2), 022104. doi:10.1115/1.4047759
Du, W., Zhang, J., Zhang, Y., and Qian, Z. (2013). Stability criterion for cascaded system with constant power load. IEEE Trans. Power Electron 28 (4), 1843–1851. doi:10.1109/tpel.2012.2211619
Duong, P. A., Ryu, B., Jung, J., and Kang, H. (2022). Thermal evaluation of a novel integrated system based on solid oxide fuel cells and combined heat and power production using ammonia as fuel. Appl. Sci. 12 (12), 6287. doi:10.3390/app12126287
EG and G Technical Services, (2004) Inc. Fuel Cell Handbook. Seventh Edition. Under Contract No. DE-AM26-99FT40575.
Griffo, A., and Wang, J. (2012). Large signal stability analysis of 'more electric' aircraft power systems with constant power loads. IEEE Trans. Aerosp. Electron Syst. 48, 477–489. doi:10.1109/taes.2012.6129649
Hayashi, Y., Toyoda, H., Ise, T., and Matsumoto, A. (2015). Contactless dc connector based on GAN LLC converter for next-generation data centers. IEEE Trans. Ind. Appl. 51 (4), 3244–3253. doi:10.1109/tia.2014.2387481
Huang, M., Ji, H., Sun, J., Wei, L., and Zha, X. (2017). Bifurcation-based stability analysis of photovoltaic-battery hybrid power system. IEEE J. Emerg. Sel. Top. Power Electron 5 (3), 1055–1067. doi:10.1109/jestpe.2017.2681125
Jeltsema, D., and Scherpen, J. M. A. (2009). Multidomain modeling of nonlinear networks and systems: energy- and power-based perspectives. IEEE Control Syst. Mag. 29 (4), 28–59. doi:10.1109/MCS.2009.932927
Kwasinski, A., and Onwuchekwa, C. N. (2011). Dynamic behavior and stabilization of DC microgrids with instantaneous constant-power loads. IEEE Trans. Power Electron 26 (3), 822–834. doi:10.1109/tpel.2010.2091285
Li, Z., Li, K., Wei, P., Hua, Y., and Li, K. (2018). Large disturbance stability analysis of droop control DC microgrid based on hybrid potential function. Power Syst. Technol. 42 (11), 3725–3734. doi:10.1049/joe.2018.8574
Liu, X., and Bian, Y. (2017). “Large signal stability analysis of the DC microgrid with the storage system,” in 2017 20th international conference on electrical machines and systems (ICEMS) (Sydney: IEEE), 1–5.
Liu, X., and Zhou, Y. (2011). Stability of constant power load system with dual-stage LC filter under large disturbances. Proc. Chin. Soc. Electr. Eng. 31 (27), 29–35. doi:10.1109/PEDES49360.2020.9379408
Mohan, N., Undeland, T. M., and Robbins, W. P. (1993). Power electronics: converters, applications, and design. New York: Wiley.
Padullés, J., Ault, G. W., and McDonald, J. R. (2000). An integrated SOFC plant dynamic model for power systems simulation. J. Power Sources 86 (1-2), 495–500. doi:10.1016/s0378-7753(99)00430-9
Shekhar, A., Ramirez-Elizondo, L., and Bauer, P. (2017). “DC microgrid islands on ships,” in 2017 IEEE second international conference on DC microgrids (ICDCM), 111–118. Nuremberg.
Steele, B., and Heinzel, A. (2001). Materials for fuel-cell technologies. Nature 414, 345–352. doi:10.1038/35104620
Wang, X., Gao, J., Chen, H., Chen, Z., Zhang, P., and Chen, P. (2022). Diesel/methanol dual-fuel combustion: an assessment of soot nanostructure and oxidation reactivity. Fuel Process Technol. 237, 107464. doi:10.1016/j.fuproc.2022.107464
Weiss, L., Mathis, W., and Trajkovic, L. (1998). A generalization of Brayton-Moser's mixed potential function. IEEE Trans. Circuits Syst. I Fundam. Theory Appl. 45 (4), 423–427. doi:10.1109/81.669065
Zhao, X., Xu, S., Xian, Z., and Qing, Y. (2018). “Control of DC microgrid for electrical vehicles (EVs) wireless charging,” in 2018 China international conference on electricity distribution (CICED) (Tianjin: IEEE), 2082–2087.
Zhou, Q., Shahidehpour, M., Paaso, A., Bahramirad, S., Alabdulwahab, A., and Abusorrah, A. (2020b) “Distributed control and communication strategies in networked microgrids,” in IEEE Commun Surv Tutor. doi:10.1109/COMST.2020.3023963
Zhou, Q., Tian, Z., Shahidehpour, M., Liu, X., Alabdulwahab, A., and Abusorrah, A. (2020a). Optimal consensus-based distributed control strategy for coordinated operation of networked microgrids. IEEE Trans. Power Syst. 35 (3), 2452–2462. doi:10.1109/tpwrs.2019.2954582
Keywords: SOFC mathematical model, dual closed-loop control, DC microgrid, mixed potential functions, large-signal stability criterion
Citation: Fang Y, Yu W, Liao W, Yang R, Luo C, Zhang C and Dong X (2024) Research on large-signal stability of SOFC-lithium battery ship DC microgrid. Front. Energy Res. 12:1423931. doi: 10.3389/fenrg.2024.1423931
Received: 26 April 2024; Accepted: 12 June 2024;
Published: 24 July 2024.
Edited by:
Jinlong Liu, Zhejiang University, ChinaReviewed by:
Jianbing Gao, Beijing Institute of Technology, ChinaCopyright © 2024 Fang, Yu, Liao, Yang, Luo, Zhang and Dong. This is an open-access article distributed under the terms of the Creative Commons Attribution License (CC BY). The use, distribution or reproduction in other forums is permitted, provided the original author(s) and the copyright owner(s) are credited and that the original publication in this journal is cited, in accordance with accepted academic practice. No use, distribution or reproduction is permitted which does not comply with these terms.
*Correspondence: Wanneng Yu, d255dTIwMDdAam11LmVkdS5jbg==
Disclaimer: All claims expressed in this article are solely those of the authors and do not necessarily represent those of their affiliated organizations, or those of the publisher, the editors and the reviewers. Any product that may be evaluated in this article or claim that may be made by its manufacturer is not guaranteed or endorsed by the publisher.
Research integrity at Frontiers
Learn more about the work of our research integrity team to safeguard the quality of each article we publish.