 Zhuoyue Wang1
 Xinhao Lin
- 1Electric Power Research Institute of Guizhou Power Grid Co. Ltd, Guangzhou, China
- 2Electrical Power Research Institute, China Southern Power Grid (CSG), Guangzhou, China
With the rapid growth of the digital economy, data centers have emerged as significant consumers of electricity. This presents challenges due to their high energy demand but also brings opportunities for utilizing waste heat. This paper introduces an operation optimization method for multi-energy systems with data centers, leveraging the information gap decision theory (IGDT) to consider various uncertainties from data requests and the environment. First, a model is established for the operation of a multi-energy system within data centers, considering the integration of server waste heat recovery technology. Second, IGDT is employed to address uncertainties of photovoltaic output and data load requests, thereby formulating an optimal energy management strategy for the data center park. Case studies demonstrate that the electricity purchase cost increased by 5.3%, but the total cost decreased by 30.4%, amounting to 5.17 thousand USD after optimization. It indicates that the operational strategy effectively ensures both efficient and cost-effective power supply for the data center and the park. Moreover, it successfully mitigates the risks associated with fluctuations in data load, thus minimizing the possibility of data load abandonment during uncertain periods.
1 Introduction
With the rapid development of digital technology, data has emerged as a critical production resource. Data centers, serving as core facilities for data processing and computing, have become significant consumers of electricity (Hao et al., 2024). The power demand of global data centers in 2022 ranged from 240 to 340 TWh, accounting for approximately 1%–1.3% of global power consumption (International Energy Agency, 2022). Given this substantial energy consumption, implementing advanced energy management practices in data centers to enhance energy utilization efficiency and reduce energy costs holds significant practical importance.
The electricity consumption of data centers mainly consists of three parts: information technology (IT) devices, cooling devices, and auxiliary devices (Zhang et al., 2021). Among these, IT devices account for approximately 50% of a typical data center’s energy consumption, with almost all consumed electrical energy eventually transformed into heat. Cooling devices account for about 40% of all power consumption in data centers, expelling the heat generated by IT devices to the outside of the room (He et al., 2021). IT equipment and cooling equipment generates a significant quantity of waste heat. Leveraging and recovering the waste heat. For example, through conversion into electricity, thermal energy, or cooling output, offers a chance to improve the energy utilization efficiency of data centers even more.
The coordinated optimization of power consumption between cooling systems and IT devices has been discussed in (Li et al., 2012), using the metric of power usage effectiveness (PUE), with excess heat being directly expelled outdoors. Reference (Chen et al., 2021) considers cooling devices designed to cool the data center, while excess heat is efficiently expelled outdoors. To convert the waste heat generated by data centers into thermal resources, it has been proposed in (Wan et al., 2021) to utilize absorption chillers to collect waste heat expelled from server racks and reuse it, thereby improving the energy efficiency of the data center. Moreover, it has been suggested in (Davies et al., 2016) to elevate the temperature of waste heat from data centers using heat pumps to enhance the quality of waste heat resources and supply heat to district heating networks. In (He et al., 2018), heat pumps are employed to capture and reuse the waste heat generated by data centers equipped with distributed cooling devices, consequently improving the energy utilization efficiency of the data center park.
In a data center park, there are various forms of energy demand, including the cooling and electricity needs of data centers, as well as the heating requirements of residential areas. The integration of waste heat recovery technology into data centers helps establish a multi-energy distribution system that provides stable heating services for the living areas within the park. Moreover, it promotes the incorporation of distributed energy resources, such as photovoltaic (PV) power generation, thus fostering the utilization of renewable energy. It is of great significance for promoting the sustainable development and energy structure optimization of data center parks. However, within the multi-energy distribution system that integrates waste heat recovery technology and PV power generation, significant uncertainty arises regarding both PV output and data load requests. This uncertainty presents challenges for data centers in effectively scheduling and managing the operational status of various devices within the park, impacting not only the lifespan of IT and cooling devices but also potentially leading lead to consequences such as inadequate cooling supply and data load abandonment.
Thus, in researching operation optimization methods for data centers, it is essential to consider uncertainty factors and develop operational strategies that account for uncertainties in both PV output and data load requests. Various methods can be employed to address these uncertainties in operation. In (Chen et al., 2014), the Monte Carlo simulation method is utilized to generate random scenarios, and stochastic optimization is applied to evaluate power demand response management in distributed large-scale data centers. The objective is to minimize total power costs under uncertain conditions by considering various types of data load tasks. Reference (Yu et al., 2018) proposes a real-time distributed optimization scheduling method for data centers, addressing uncertainties related to electricity prices, distributed power generation, and data loads. This method fully considers the flexible transfer of different types of data loads in time and space, aiming to reduce the operating costs of data center microgrids. A robust planning model is established for data center parks with uncertainties to balance the operational economy, reliability, and planning conservatism in (Wang et al., 2024). Additionally, reference (Lian et al., 2023) presents a flexible robust multi-objective optimization strategy, considering uncertainty in wind power output and data load. The strategy aims to minimize wind power curtailment, data load abandonment, and the operating costs of data center microgrids.
However, in practical applications, stochastic optimization often involves significant computational complexity. Moreover, the challenge of obtaining accurate probability distribution models leads to less precise models and scenarios that may not adequately represent practical conditions. On the other hand, robust optimization tends to yield conservative solutions with high operating costs (Wu et al., 2022). At the level of the data center park, the uncertainty of PV output and data load requests is significant. For newly built data center parks, the information provided by historical data is limited, making it difficult to obtain accurate scenario probability distributions. Additionally, the demand for data load can fluctuate significantly due to user needs, unexpected events, and other factors. Consequently, schedulers may struggle to obtain accurate and complete future data load request information. Therefore, traditional uncertainty methods may not be effective in optimizing the operations of multi-energy distribution systems that integrate data centers.
Information gap decision theory (IGDT) is a decision-making method designed to handle severe uncertainty. It does not require the probability distribution of uncertain quantities but instead optimizes the error of uncertain quantities under predefined objectives, thus determining the potential impacts of uncertain quantities on the system (Yeganehkia et al., 2023). During the solving process, uncertain factors are described as interval variables. It aims to maximize the range of uncertainty variables while ensuring the minimum expected target value, thereby maximizing the ability to mitigate the impact of uncertainty on the solution results. In the context of wind power generation and load demand uncertainty, IGDT has been applied in scenarios where wind power and electric vehicles operate jointly to guarantee the safe and stable operation of the generator units, as discussed in (Ahmadi et al., 2020). To mitigate the risks posed by the uncertainty of electricity prices, thermal energy production, and demand response in virtual power plants, reference (Zhao et al., 2019) proposed strategies based on IGDT, aiming to maximize profits while effectively managing and mitigating risks.
Overall, current research primarily focuses on enhancing the operational flexibility of data center cooling systems to elevate energy efficiency levels, often overlooking the potential utilization of waste heat generated by data center operations. Moreover, existing studies commonly rely on traditional stochastic optimization or robust optimization methods to devise operational strategies for uncertain environments, which may fall short of effectively addressing fluctuations in uncertainty. There is a pressing need to develop an operation optimization method that considers waste heat recovery and uncertainties. It would facilitate the formulation of operational strategies for the multi-energy system in the data center park to maximize both economic and energy efficiency while striking a balance between economic viability and reliability.
In this paper, we propose an operation optimization method for a multi-energy distribution system in a data center park, which is based on the IGDT theory and considers waste heat recovery for heating. Firstly, a model of the waste heat recovery system and thermal segment in the data center park is established. Subsequently, the IGDT theory was adopted to handle the uncertainty in PV output and data load requests to establish an operation optimization method for data center parks in uncertain scenarios. Finally, the optimization of data center park operation under uncertain scenarios was achieved, reducing operating cost under fluctuating conditions. The main contributions of this paper are as follows:
1) An operation model for data centers equipped with a waste heat recovery system is established considering the dynamic thermal behaviors of data servers. This model provides a basis for energy management and operation optimization of the multi-energy distribution system in the data center park.
2) An operation optimization method based on IGDT is proposed for the data center park, addressing uncertainties of distributed generation and computational requests. The robustness of the obtained operational strategy can be significantly enhanced without compromising economic and efficiency performance
3) The effectiveness of the proposed method is validated using a typical multi-energy system in a data center park. Through the coordinated operation of IT devices and cooling/heating devices, a synergistic supply of electricity and heat within the park can be achieved, resulting in a reduction in operating costs by 30.44%.
The organization of this paper is introduced as follows. Section 2 establishes the waste heat recovery model and the thermal segment model, in which the space thermal inertia is considered. Section 3 describes the operation optimization method for the data center park. Case studies based on the modified practical network and the specifications for data center design are conducted in Section 4. Finally, conclusions are drawn in Section 5.
2 Models of the multi-energy distribution system in the data center park
In this section, the waste heat recovery system model and the thermal segment model of the multi-energy distribution system in the data center park were established. The waste heat recovery system model encompasses operating models for the heat pump, electric boiler, thermal storage tank, and heat exchanger. Based on the law of energy conservation, the thermal segment model encompasses two parts: the thermal inertia model of the data center room and the living area.
2.1 Waste heat recovery system model for the data center park
A typical data center park is chosen as the primary research subject. To investigate the process of utilizing waste heat from the data center, this paper primarily focuses on the heating season for operational scheduling. Further, heating for the living area of the data center park is provided based on the strategy. The energy supply structure is depicted in Figure 1. The system is connected to the grid and supplemented by a PV system to meet electricity demands. It includes heat exchanger equipment, a heat pump unit, an electric boiler, and a thermal storage tank. During the heating season, waste heat recovery and heating are realized. The system operates without considering the start-stop cycles of various energy conversion equipment, and all equipment is operated continuously.

Figure 1. Structure diagram of energy supply during the heating season in a data center park.
During the heating season in the data center park, the electricity demand of the park is met by both the external power grid and the PV system. The heat pump unit and electric boiler convert electricity into heat for thermal supply, while the thermal storage tank regulates the peak and off-peak energy of the park. During operation, a substantial quantity of electrical energy consumed by the multitude of IT devices deployed in the data center room is converted into heat energy. This heat energy is collected through the waste heat recovery system and transferred through heat exchangers to collect the heat. The collected heat is then sent to the heat pump unit, where low-grade heat energy is converted into high-grade heat energy, as shown in Figure 2. The park is equipped with an electric boiler, which supplements the heat energy based on the utilization of the recovered waste heat to fulfill the heating requirements of the living area within the data center park (Ding et al., 2019). Any excess heat is discharged outdoors.
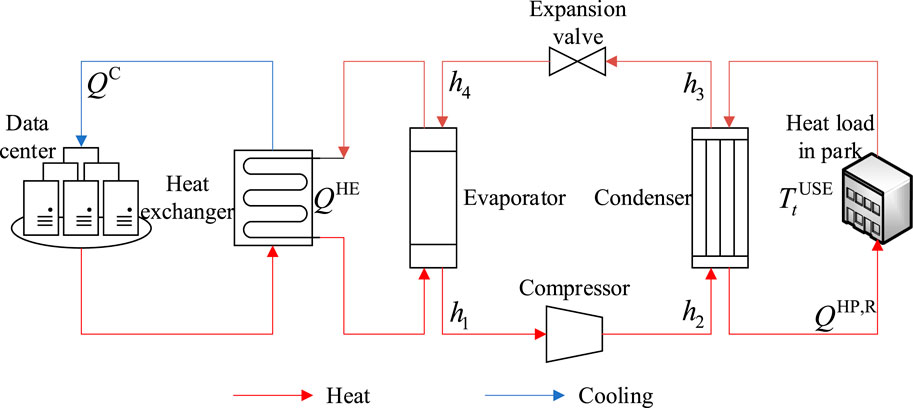
Figure 2. Waste heat recovery system diagram.
Based on the above process, the total energy consumption of the data center can be summarized by Eq. 1, where the energy consumption of auxiliary devices can be indicated by a function of
where
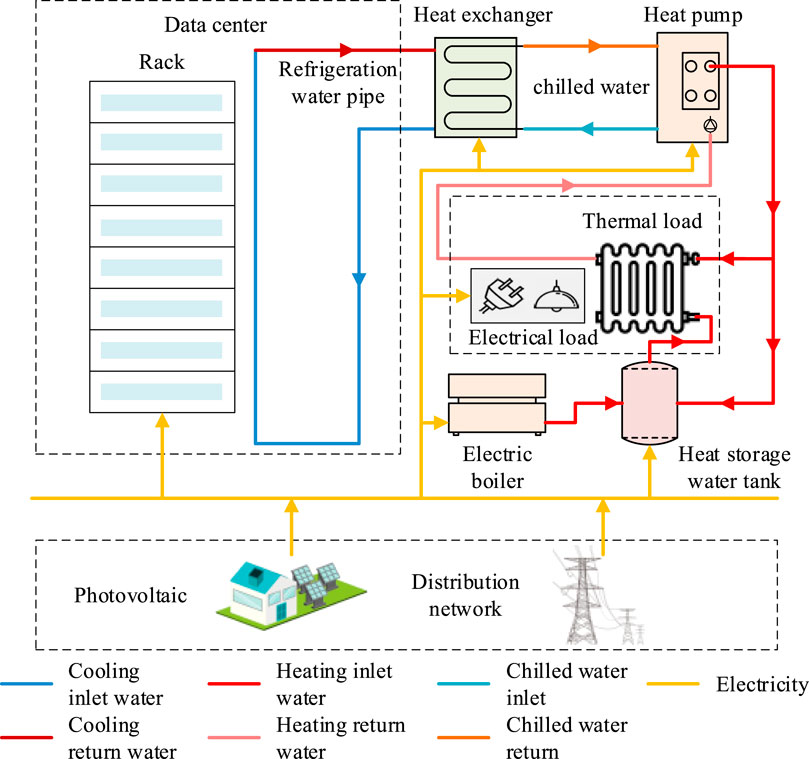
Figure 3. Operational structure diagram of a data center park.
The total power consumption
where
Based on dynamic voltage and frequency scaling technology, the linearized description of CPU energy consumption can be represented using auxiliary variables as follows (Zhu et al., 2023):
where
The power consumption of the cooling devices (
where
1) Heat pump operating model
Based on the principles of the reverse Carnot cycle, a model for the power consumption of the heat pump equipment is established. According to the first law of thermodynamics, the heat output of the heat pump is as follows:
where
In the theoretical cycle of a heat pump system, the coefficient of performance (COP) of the heat pump can be expressed as follows:
where
The COP of the heat pump can be further expressed as:
This gives the electrical power consumed by the heat pump which can be expressed as:
A portion of the heat generated by the heat pump gets stored in the thermal storage tank, while another portion is directly supplied to the park to meet the heat demand. Eq. 11 constrains the heat output of the heat pump, ensuring it does not surpass the upper limit of the heating power:
where
2) Electric boiler operating model
The relationship between the heating power and the power consumption of the electric boiler satisfies:
where
A portion of the heat produced by the electric boiler is stored in the thermal storage tank, while another portion is directly supplied to the park to meet the heat demand. Eq. 15 limits the heating power of the electric boiler, ensuring it does not exceed the upper limit of the heating power:
where
3) Thermal storage tank operating model
The thermal storage tank reduces system operating energy consumption and saves operating costs by storing and releasing heat at different periods. Considering self-loss phenomena, the energy storage model of the thermal storage tank can be illustrated as:
where
Equations 17 and (18) impose constraints on the storage of thermal energy in the tank:
where
The thermal storage tank cannot simultaneously store and release heat. The constraints on its storage and release states can be demonstrated as:
where
The power consumption of the thermal storage tank in the storage state is indicated as follows:
where
4) Heat exchanger operating model
Considering a certain heat recovery efficiency, the heat power extracted by the heat exchanger during period t is as follows:\
where
2.2 Thermal segment model of the multi-energy distribution system in the data center
Most existing data centers are predominantly air-cooled, employing raised floor designs to optimize airflow arrangement and improve cooling efficiency. In data centers, both recirculated air and chilled water can serve as waste heat resources. However, data center rooms typically house multiple air conditioning units, and utilizing hot return air as a waste heat resource would significantly increase system complexity. Considering both system complexity and efficiency factors, this paper assumes that the data center rooms adopt liquid cooling technology, thereby facilitating waste heat recovery using chilled water as a resource. The energy balance relationship of the thermal segment of the data center multi-energy distribution system is illustrated in Figure 4.
1) Thermal inertia model of data center room
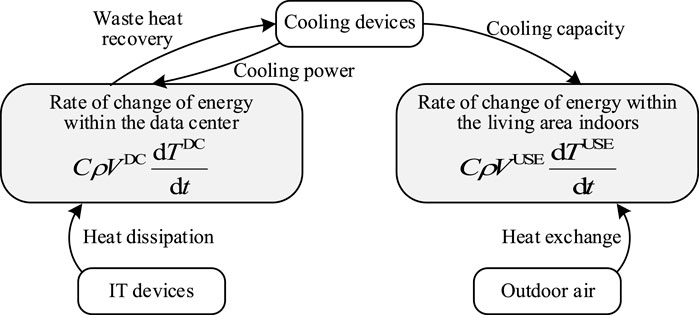
Figure 4. Energy balance relationship diagram for the thermal segment.
Based on the law of conservation of energy, the total heat generation power of servers in the data center room is as follows:
where
When servers are running, the heat they emit will heat the air flowing through them. Cooling modules are installed at the rear of each rack to cool the hot air flowing through the servers. The entrance temperature of the server is approximately the same as the exit temperature, so there is no traditional cold or hot aisle. Therefore, the thermal balance equation for the data center room can be illustrated as (Zhang et al., 2024):
where
Assuming the rate of change of internal energy of air in the data center remains constant in each time interval, Eq. 24 can be discretized into the following difference equation:
where
The temperature at the server outlet and inlet in the data center must fluctuate within an acceptable range. The constraint is as follows:
where
To ensure the normal operation of the servers, the rate of change of temperature at the outlet and inlet of the data center servers is also constrained within a certain range. The relevant constraints are as follows:
where
2) Heating thermal inertia model of the living area
The thermal balance equation for the indoor area of the living area is as follows:
where
Similarly, Eq. 30 can be discretized into a different equation as follows:
where
Constraints related to the acceptable fluctuation range of indoor temperature in the living area are as follows:
where
To ensure the comfort level of indoor temperature, its rate of change is also constrained within a certain range. The relevant constraint is as follows:
where
3 Operation optimization method for the data center park
In this section, the operational regulation with the data center park is formulated, in which the waste heat recovery system and the space thermal inertia are considered. Besides, the PV output and data load requests have obvious fluctuations in temporal distribution, which may influence the efficiency of IT devices and cooling devices. It has the potential to result in inadequate cooling within data centers, data loss, reduced lifespan of IT devices, financial losses for data users, and inadequate heating in residential areas. Information gap decision theory, as a decision-making approach that does not require probability information to address uncertainties, can effectively deal with uncertainties in the data center park, where uncertainties are severe and it is difficult to form precise probability density functions for uncertain variables to enhance the operation reliability of the data center park.
3.1 Optimization of the multi-energy distribution system in the data center
Based on the above analysis, integrating waste heat recovery technology and the flexibility of the system’s thermal process can enhance the energy utilization efficiency of the data center park, thereby reducing operating costs.
Assuming that the power supply of the data center can be provided by both the external grid and local PVs, the objective function of the optimization scheduling model can be formulated as follows:
where
where
In actual operation, the heat storage power of the thermal storage tank is the sum of the heat storage power of the electric boiler and the heat pump. The total heating power of the thermal load supplied to the park is the sum of the heat release power of the thermal storage tank, the heat supplied directly by the electric boiler, and the heat supplied directly by the heat pump. The relevant constraints are as follows:
where
In conclusion, the deterministic operational model of the data center park considering waste heat recovery can be illustrated as follows:
In this operational model, it is assumed that the predictions of PV output and data load requests are accurate, and the corresponding predicted values of PV output and data load requests are treated as actual values for optimization. However, in the actual optimization scenario of data center parks, the PV output and data load requests exhibit significant uncertainty during operation (Zhao et al., 2023). Therefore, it is necessary to consider the uncertainty of PV and data load in the park and develop optimization strategies for the operation of data center parks.
3.2 Operation optimization method for data center parks based on IGDT
IGDT deals with the uncertainty problem without the requirement of probability information, representing the uncertainties as interval variables. It aims to maximize the range of uncertainty variables while ensuring the minimum expected target value, thereby maximizing the ability to mitigate the impact of uncertainty on the solution results. To effectively address the significant uncertainty within the park, where precise probability density functions are difficult to formulate, this section applies IGDT to incorporate the uncertainty of PV output and data load requests in the data center park.
1) Modeling uncertainty of PV output and data load requests
The fluctuation range of uncertainty in PV output can be indicated using IGDT as follows:
where
The uncertainty range of data load requests can be indicated as follows:
where
2) Model construction and transformation based on IGDT
Based on the objective function and constraints outlined in Section 3, the deterministic optimization model to be solved can be illustrated as follows:
where
The limitations of historical scenario information make it difficult to obtain accurate scenario probability distributions. Therefore, IGDT without probabilistic information is utilized in this paper to analyze the uncertainty of PV outputs and front-end server data load requests. Decision makers can be categorized into pessimistic and optimistic types based on their differences in risk perception and behavioral habits, and they adopt opposing value propositions in facing risks. This paper aims to mitigate the impact of uncertainty in PV output and data load requests on the operational results of the data center parks. Therefore, a risk aversion strategy is employed in this paper to construct the IGDT robust optimization model. The general form of the IGDT robust model is as follows:
where
Equations 47 and (48) establish a two-level optimization problem: the upper model seeks to maximize the uncertainty and the lower model to maximize the objective function. In the lower layer model, the purchased power of the system will increase as the PV output decreases, which leads to an increase in the operating cost. When the PV output reaches its minimum value, the lower-level objective function value achieves its maximal value. Meanwhile, as the data load requirement increases, the power consumption of the system increases, resulting in an operating cost increase. From another perspective, the lower-level objective function value achieves the maximum when the data load request reaches the maximum value. Combining these two influencing factors, the maximum value of the lower-level model occurs when the PV output is minimum and the data load request is maximum. In this case, the two-level optimization model can be equivalently converted to a single-level optimization model as follows:
where
Based on IGDT, the robust optimization model for the data center park ultimately transforms into a single-layer optimization model. The process for solving the model is illustrated in Figure 5, and the detailed steps for solving it are as follows:
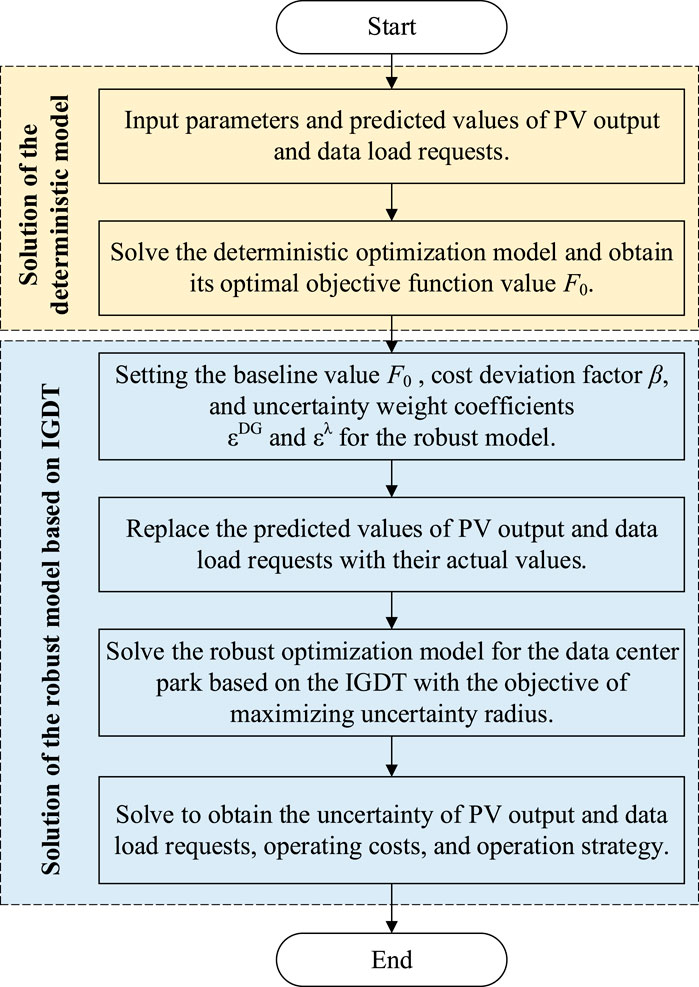
Figure 5. Flowchart of robust optimization model based on IGDT.
Step 1: Input deterministic model data of the data center park, including information on the composition and parameters of the devices in the data center, the composition of data loads and tolerance times, the thermal inertia parameter information of the data center and living areas within the park, outdoor temperature information, basic parameters for time-of-use electricity prices, PV output curve, and data load request curve, etc.
Step 2: Solve the deterministic model of the data center park considering waste heat recovery to minimize operating costs. Obtain the optimal value
Step 3: Set the cost deviation factor
Step 4: Optimize the robust optimization model for the data center park based on the IGDT to maximize uncertainty. Obtain the uncertainty radius of PV output and data load requests, the operating cost of the data center park, and the unit output plan.
4 Case study
In this paper, the case in (Ji et al., 2022) is adopted to verify the effectiveness of the proposed method. The time is set during the winter heating season and the other parameters are set according to the specifications for data center design.
The data center contains a total of 12,000 servers divided into two types (Ji et al., 2022). The parameters of the cooling and heating equipment as well as the thermal inertia are shown in Table 1 and 2, respectively. The variation curve of the outdoor temperature is shown in Figure 6. The curves of data load requests and PV output are illustrated in Figure 7. In Figure 7A, the solid blue line represents the number of data load requests under a deterministic scenario. The dark blue portion indicates the numerical range of the number of data load requests under a cost deviation factor of 0.05. The light blue and dark blue portions collectively represent the number of data load requests under a cost deviation factor of 0.1. Similarly, in Figure 7B, the solid green line represents the PV output curve under a deterministic scenario. The dark green portion indicates the numerical range of PV output in the park under a cost deviation factor of 0.05. The light green and dark green portions collectively represent the numerical range of PV output in the park under a cost deviation factor of 0.1. The time-of-use pricing is adopted and the peak, off-peak, and shoulder electricity prices are USD 0.187/kWh, USD 0.125/kWh, and USD 0.064/kWh, respectively, as shown in Figure 8. The residential area’s electricity load is not considered due to its non-controllable nature. In addition, electric boilers serve as supplementary heating equipment in the park, which could provide heating to the residential area when the heat recovery from the data center is insufficient.
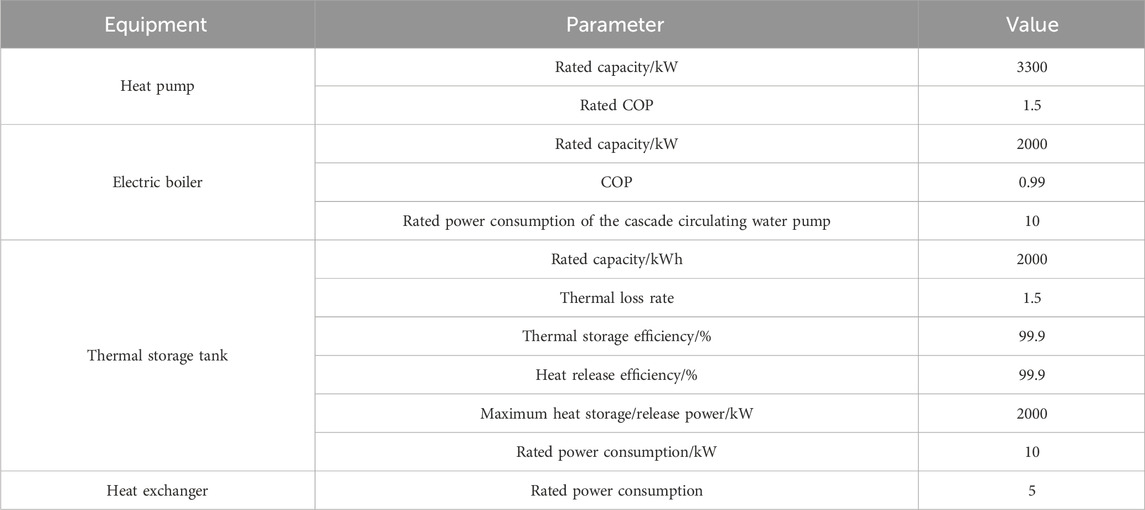
Table 1. Parameters of the cooling and heating equipment in the park.
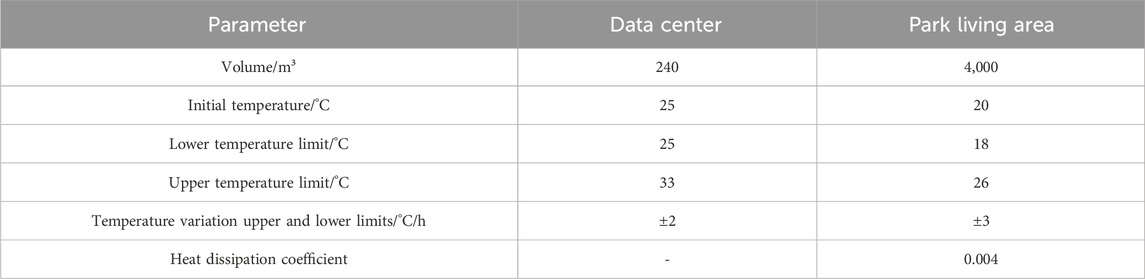
Table 2. Parameters of thermal inertia in the park.
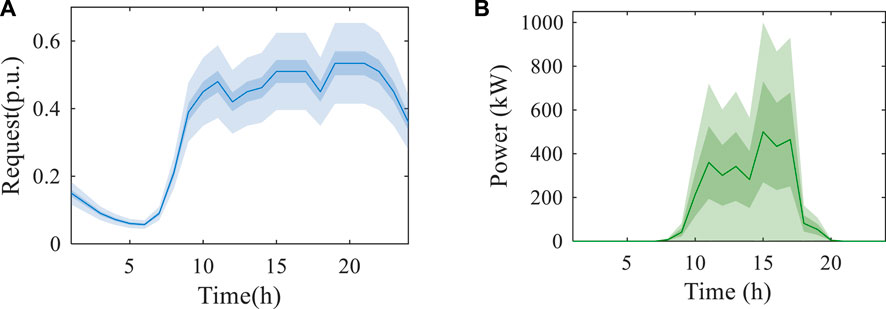
Figure 6. Curves of data load request and PV: (A) Curve of data load request; (B) Operation curve of PV.
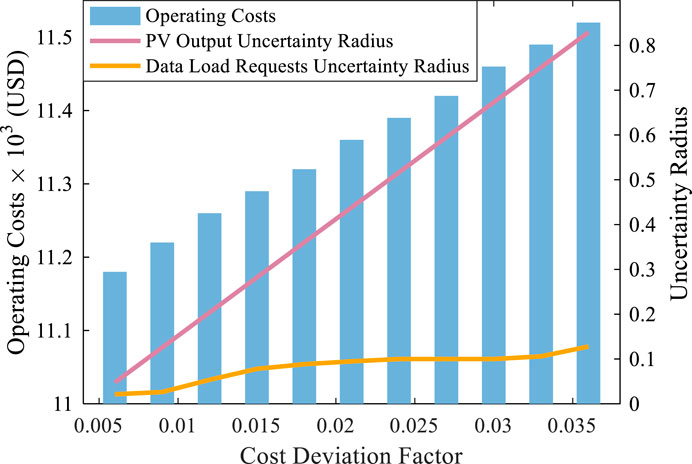
Figure 7. Variations of PV output and data load requests uncertainty radii.
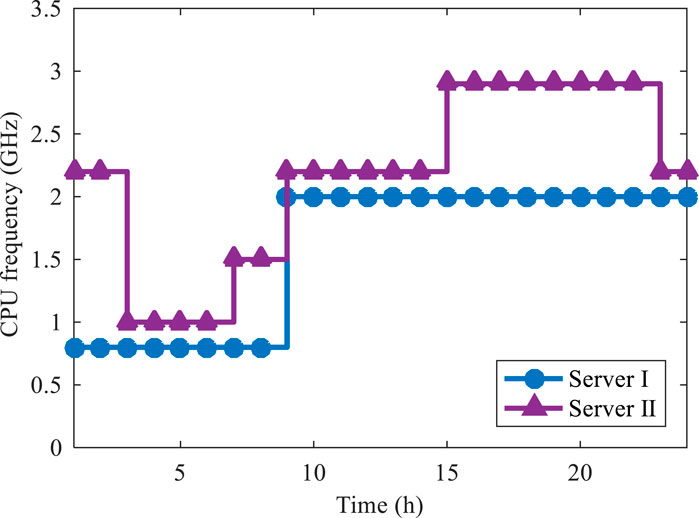
Figure 8. CPU operating frequency of IT devices.
4.1 Analysis of optimization results
This section begins by analyzing the robust optimization results of the IGDT considering only the uncertainty of PV output and only considering the uncertainty of data load requests. Subsequently, the analysis extends to the robust optimization results of the data center park when simultaneously considering the uncertainties of both PV output and data load requests.
1) Considering only the uncertainty of PV output
When considering only the uncertainty in PV output without considering the uncertainty of data load requests, robust optimization based on IGDT is conducted. Corresponding to different cost deviation factors, which refer to the difference or deviation between the actual cost and the expected cost during the decision-making process, the variation of PV output uncertainty radius is presented in Table 3.
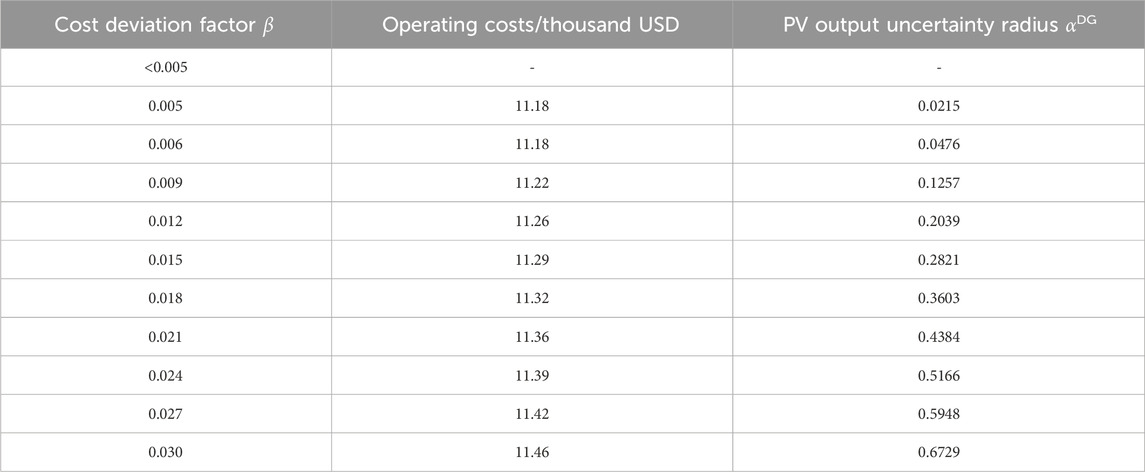
Table 3. Variation of PV output uncertainty radius.
From Table 3, it can be observed that a cost reserve within 0.5% cannot meet the operational requirements of the system in an uncertain environment, and the operation of the park cannot accept the prediction deviation of the PV output. However, as the cost deviation factor gradually increases, the data center park can gradually accept higher prediction deviations of the PV output. Moreover, as the set cost deviation factor
2) Considering only the uncertainty of data load requests
Without factoring in the uncertainty of PV output, only the prediction of data load requests is inaccurate. The variation of uncertainty radius in data load requests for different cost deviation factors is shown in Table 4.
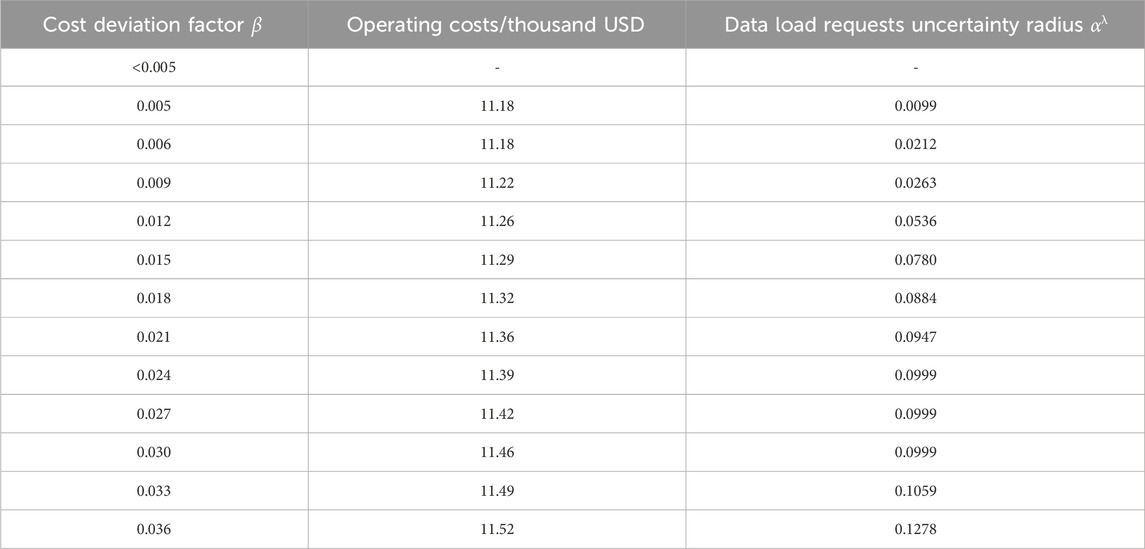
Table 4. Variation of data load requests uncertainty radius.
From Table 4, it can be observed that the reserved cost within 0.5% cannot meet the operational requirements under uncertain conditions. Similarly, due to the negative impact of uncertainty factors on the target value in the robust model of IGDT, the larger the uncertainty radius of data load requests, the higher the operating cost of the park. Therefore, as the decision maker sets a larger cost deviation factor
Furthermore, when the cost deviation factor
Figure 9 illustrates the fluctuations in operating cost as the cost deviation factor varies, and its corresponding variations in PV power, and data load uncertainty radius. As the cost deviation factor increases, the operating cost and the uncertainty radius associated with the PV power and data loads increase simultaneously. Among them, the PV uncertainty radius experiences the most rapid variation, whereas conversely, the data load uncertainty radius undergoes a more gradual change. This difference arises from the fact that the power consumption of IT devices in data centers is significantly larger than the installed capacity of PV power generation, making the fluctuation radius of PV output larger for a given cost deviation factor. Meanwhile, the nonlinear relationship between the power consumption of IT devices and their data load requests introduces the growth rate fluctuations during the data load uncertainty radius increase. In summary, variations in the uncertainty radius of PV output and data load requests exhibit different response characteristics to cost deviation factor fluctuations. These factors collectively contribute to a significant impact on operating costs, making it necessary to simultaneously consider their impact on data center operations optimization.
3) Considering both the uncertainty of PV output and data load simultaneously
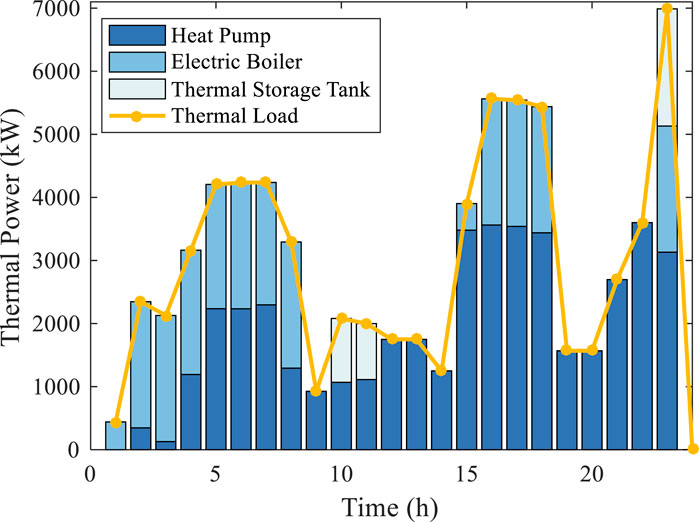
Figure 9. Heat power distribution chart.
The uncertainty of PV output and data load requests is assumed to have the same weighting coefficients. The variation of the comprehensive uncertainty radius corresponding to different cost deviation factors is shown in Table 5.
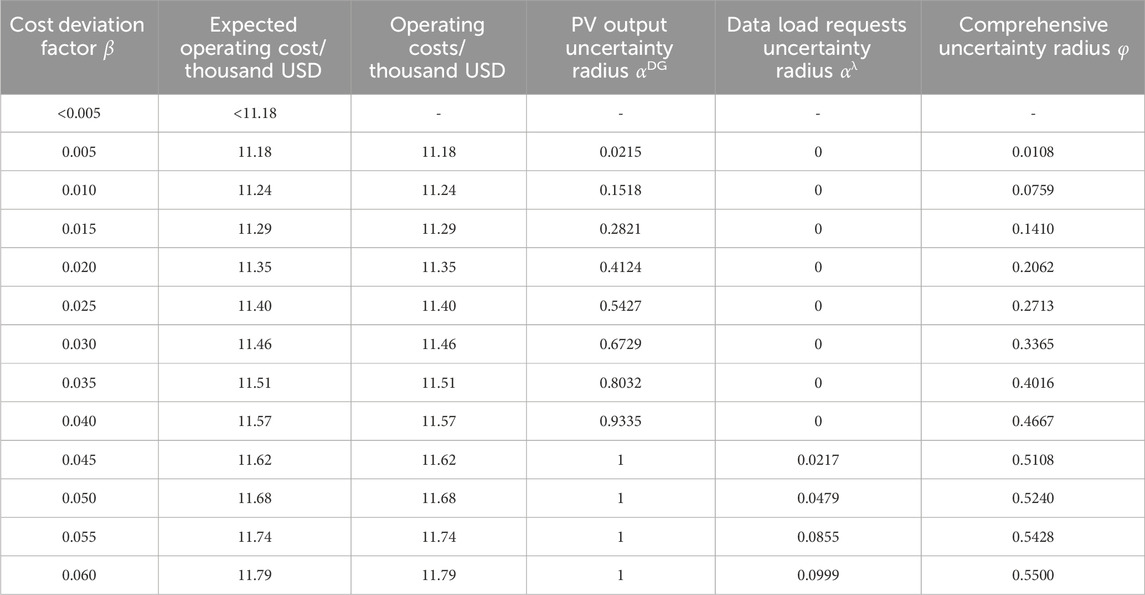
Table 5. Variation of comprehensive uncertainty radius.
From Table 5, it can be observed that, like the optimization results considering only PV or data load uncertainties, a cost reserve of 0.5% cannot meet the operational requirements under uncertain conditions. Due to the negative impact of uncertainty factors on the reduction of target value operating costs, the uncertainty radius of uncertain quantities increases with the increase of the cost deviation factor
When the cost deviation factor is less than 0.045, only the uncertainty radius of PV output increases with the deviation factor, while the uncertainty radius of data load requests remains constant at zero. When the cost deviation factor exceeds 0.045, the uncertainty radius of data load requests gradually increases. It is attributed to the relatively low penetration level of PV systems in the system, resulting in a low proportion of PV output in the total power consumption. Consequently, the uncertainty radius of PV output is more sensitive to changes in the cost deviation factor.
Therefore, considering the maximum values of PV output and IT devices’ power consumption as the reference values, the uncertainty weighting coefficients for PV output and data load requests are redefined. In the deterministic optimization of the park, the maximum values of PV output and IT device power consumption are 500 kW and 1227 kW, respectively, with a ratio of 1:2.454. Hence, the uncertainty weighting coefficients for PV output and data load requests, denoted as
After adjusting the uncertainty weighting coefficients for PV output and data load requests, a re-analysis of the robust optimization is conducted. The comprehensive uncertainty variations corresponding to different cost deviation factors are shown in Table 6.
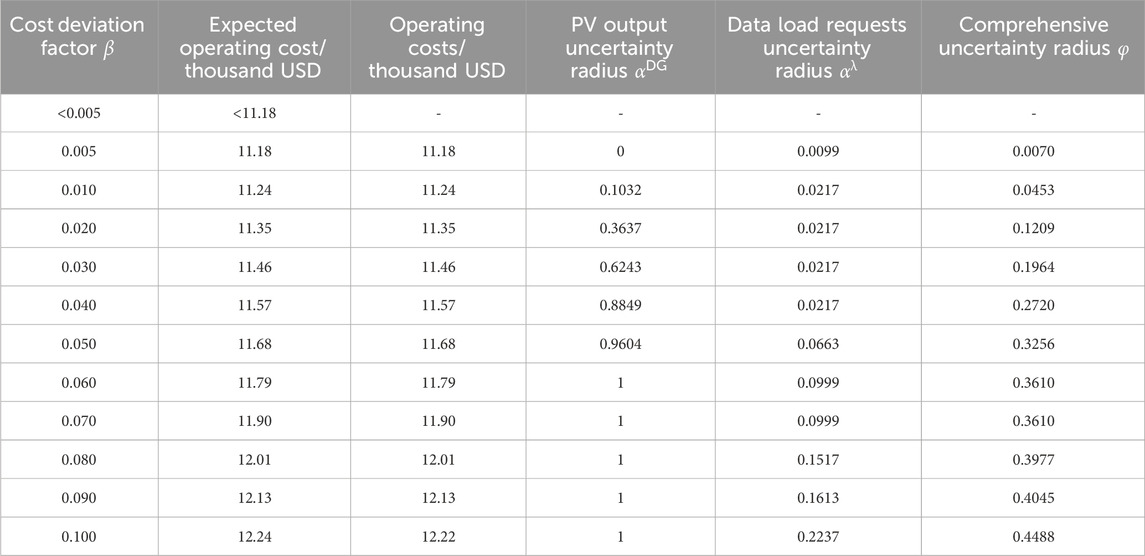
Table 6. Variation of comprehensive uncertainty radius after adjusting the coefficients.
From Table 6, it is evident that a 0.5% cost reserve cannot meet the operational requirements of the system under uncertain conditions. As the cost deviation factor
Furthermore, when the cost deviation factor is set to 0.100, the actual operating cost of the park is slightly lower than the expected operating cost. It is due to the constraints imposed by the temperature and temperature variation rate of the data center, limiting the fluctuation range of uncertain factors and preventing the operating cost from reaching the expected value. When the cost deviation factors are set to the same value, the uncertainty radius of the PV output is generally greater than that of the data load request, and it reaches 1 when the deviation factor is set to 0.6. This is because the uncertainty radius of the PV output is more pronounced compared to the IT devices’ power consumption, as the PV output values are relatively low. The comprehensive uncertainty radius is numerically close to the uncertainty radius of the data load request, indicating that the overall park is mainly affected by the uncertainty of the data load request.
4.2 Analysis of the system operating strategy
To validate the effectiveness of the above methods, 100 scenarios were randomly selected with cost deviation factors less than 0.1, indicating a PV output uncertainty radius less than 1, and a data load request uncertainty radius less than 0.2237. Three comparison schemes were set up as follows:
Scheme 1: Disregarding the influence of uncertainty factors, with a cost deviation factor set to 0, deterministic optimization scheduling is conducted for the data center using the predicted values of PV output and data load requests.
Scheme 2: Considering the influence of uncertainty factors including PV output and data load requests, with a cost deviation factor set to 0.05, optimization scheduling is conducted for the data center.
Scheme 3: Considering the influence of uncertainty factors including PV output and data load requests, with a cost deviation factor set to 0.1, optimization scheduling is conducted for the data center.
1) Analysis of the operational strategies
Figure 10 depicts the variation in CPU frequency of the data center’s IT devices for Scheme. It is evident from the graph that CPU frequency is closely associated with the volume of data load processing. As the data load processing increases, the CPU frequency also rises. Additionally, it can be observed that under this strategy, the variation in server CPU frequency is relatively stable, without frequent fluctuations. This stability ensures the smooth operation of IT devices, thereby guaranteeing stable performance.

Figure 10. Power and state of thermal storage in thermal storage tanks.
Figure 11 illustrates the distribution of heat power in the living area under Scheme 3. From the graph, it can be observed that within the scheduling cycle, due to the low economic cost of waste heat recovery, the heat pump becomes the main heating method, ensuring the basic heating demand of the park. However, when the waste heat from the computer room alone cannot meet the heating demand, electric boilers will undertake part of the heating tasks to ensure that the heating load always receives sufficient heat supply.
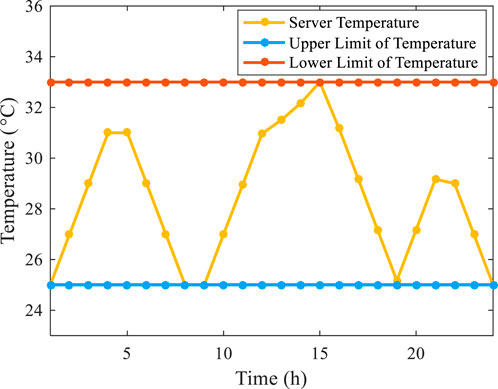
Figure 11. Variation of the temperature at the inlet and outlet of data center servers.
Figure 12 illustrates the fluctuation of the power supplied by the thermal storage tank and the corresponding heat storage state during the day. During the early morning hours with lower electricity prices, heat is stored in the thermal storage tanks. Conversely, during the morning peak hours with a higher electricity price, the stored heat is released, contributing to the reduction of the operating costs of the data center park. In addition, during the peak heat load demand in the evening, the heat storage tanks are utilized in combination with heat pumps and electric boilers to effectively meet the required thermal load. This operational strategy ensures a stable supply of heating demand in the park while fully leveraging the economic advantages of waste heat recovery, thereby achieving efficient energy utilization.
2) Analysis of the operation effectiveness
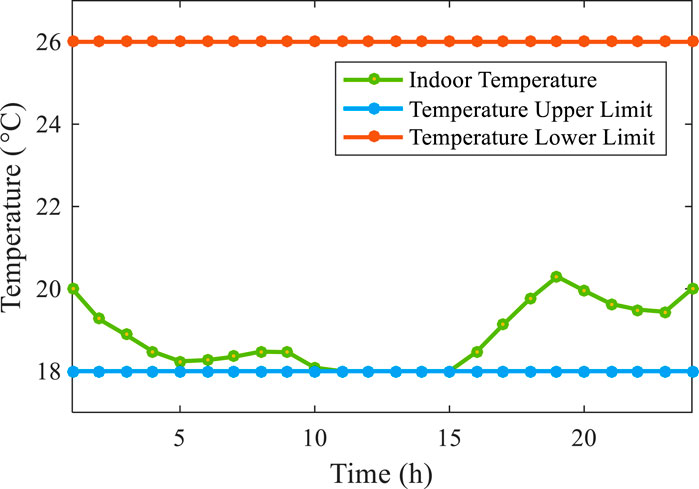
Figure 12. Variation of the indoor temperature in the living area.
Figure 13 depicts the variation of the temperatures at the inlet and outlet of data center servers for Scheme 3. It is evident from the graph that temperatures at the inlet and outlet of servers fluctuate between 25°C and 33°C. Moreover, due to the optimization method proposed in this paper, which limits the rate of temperature change of the servers within a certain range, the temperature variation of the servers shown in the graph remains relatively stable, without significant fluctuations. This stability avoids the occurrence of temperature exceedance in the server room, thereby guaranteeing stable performance.
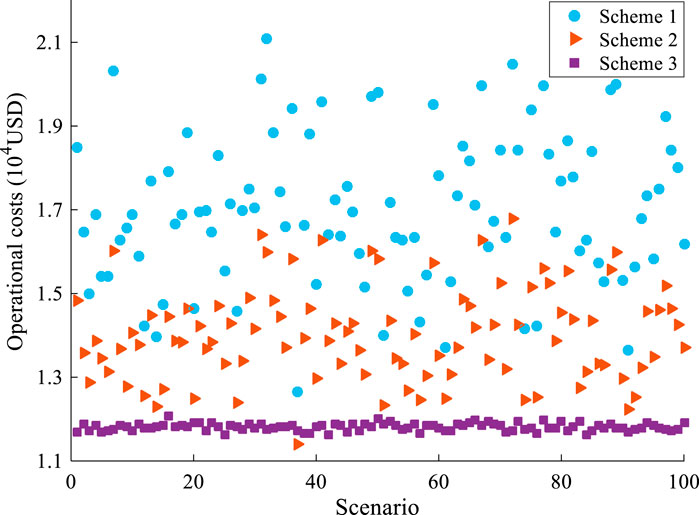
Figure 13. Total operating costs of the data center park.
Figure 14 depicts the variation of indoor temperatures in the living area for Scheme 3. From the graph, it is evident that the indoor temperatures in the living area remain within a comfortable range for humans, fluctuating between 18°C and 21°C. Additionally, it can be observed that under this strategy, the indoor temperatures in the living area exhibit relative stability, with minimal fluctuations. This stability ensures the comfort of individuals within the rooms, thereby guaranteeing the suitability of temperature for daily living activities.
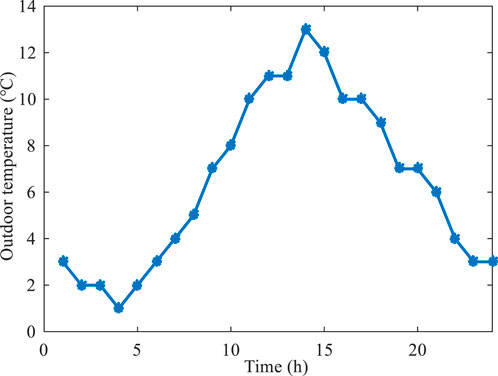
Figure 14. Outdoor temperature.
Table 7 shows the comparison of operating costs for the three schemes in the data center park. In this study, the penalty cost for abandoning each request is set to 0.069 USD, and the shortfall in heat load is supplemented by electric boilers. From the operation results, upon accounting for the uncertainty of both PV output and data load requests, the IT devices in the data center operate at a higher frequency to accommodate the fluctuation in data load. It leads to an increase in electricity costs for IT devices and an increase in the power of heat recovery. Additionally, the electricity costs for heat pumps also rise. Due to the low penetration rate of PV, the total electricity purchasing costs still increase under the fluctuation of PV output. Moreover, considering the uncertainty of data load results in improved computational capacity, significantly reducing the amount of discarded data load and consequently lowering the cost associated with data load abandonment. In Scheme 3, all data load requests can be processed, thus avoiding data abandonment.

Table 7. Comparison of operating costs in three scenarios for data center park.
However, when considering the uncertainty of data load, the power consumption of IT devices in the data center increases, and the expected power of heat recovery also increases. When the actual data load processing quantity is less than the expected value, due to the higher CPU operating frequency, the reduction in heat recovery power is more significant compared to Scheme 1. Consequently, the cost of supplementing heat load also increases. Additionally, if heat recovery is not considered and heat pumps are replaced with electric boilers for heating, the heating costs for the three schemes would increase by 899.45 USD, 946.44 USD, and 1103.86 USD, respectively. It indicates that heat recovery can effectively reduce the operating costs of data centers. Ultimately, Scheme 3 exhibits the lowest total operating cost for the data center park, demonstrating that optimizing the operation of data center parks considering uncertainty can reduce the cost of data load abandonment and make data centers operate more reliably and economically.
Figure 15 depicts the scatter plot comparing the operating costs of the data center park under three schemes across 100 randomly selected scenarios. The blue dots correspond to the deterministic operational scheme, while the orange and purple dots represent schemes considering uncertainty with cost deviation factors of 0.05 and 0.1, respectively. It can be observed from the graph that the operating costs are significantly influenced by uncertainty. When uncertainty is high, the operating costs of Scheme 1 are considerably elevated, whereas Scenario 3 demonstrates greater economic efficiency. These results underscore the importance of considering uncertainty factors in the management of data center park operations to derive the optimal operational strategy.

Figure 15. Electricity price.
5 Conclusion
Waste heat recycling in data centers can provide energy to the living quarters of the data center park, resulting in a significant improvement in energy efficiency. This paper proposes an IGDT-based operation optimization method for multi-energy distribution systems in integrated data centers, considering the uncertainties of PV output and data load requests. Firstly, a deterministic model has been developed to capture the detailed thermal characteristics of the data center and the waste heat recovery system. Subsequently, IGDT is employed to handle the uncertainties in the PV output and data load requests. The case studies demonstrate that despite a 5.3% increase in electricity purchase costs, the total expenses decreased by 30.4%, amounting to 5.17 thousand USD. This indicates that the proposed method can significantly reduce the operating cost and data task abandonment under fluctuating conditions.
Several directions remain to be investigated in future works. First, considering the spatial and temporal regulation potential of data centers, the peak load shifting can be realized to save electricity purchase cost and improve energy utilization. Additionally, the efficiency of cooling systems is intricately linked to the placement of IT devices. Therefore, it is imperative to consider the impact of IT device placement in the optimization process.
Data availability statement
The original contributions presented in the study are included in the article/Supplementary material. Further inquiries can be directed to the corresponding author.
Author contributions
ZW: Conceptualization, Writing–review and editing. XL: Methodology, Validation, Writing–review and editing. HZ: Methodology, Validation, Writing–review and editing. YL: Resources, Software, Writing–review and editing. SP: Resources, Software, Writing–review and editing. TL: Data curation, Writing–review and editing. PW: Data curation, Writing–review and editing. TW: Writing–original draft, Writing–review and editing.
Funding
The author(s) declare that financial support was received for the research, authorship, and/or publication of this article. This study was supported by the Science and Technology Project of China Southern Power Grid (066600KK52210052).
Conflict of interest
Authors ZW, HZ, SP, and PW were employed by Electric Power Research Institute of Guizhou Power Grid Co. Ltd. Authors XL, LY, TL, and TW were employed by China Southern Power Grid (CSG).
The authors declare that this study received funding from China Southern Power Grid. The funder had the following involvement in the study: collection, analysis, and interpretation of data.
Publisher’s note
All claims expressed in this article are solely those of the authors and do not necessarily represent those of their affiliated organizations, or those of the publisher, the editors and the reviewers. Any product that may be evaluated in this article, or claim that may be made by its manufacturer, is not guaranteed or endorsed by the publisher.
References
Ahmadi, A., Esmaeel Nezhad, A., Siano, P., Hredzak, B., and Saha, S. (2020). Information-gap decision theory for robust security-constrained unit commitment of joint renewable energy and gridable vehicles. IEEE Trans. Ind. Inf. 16, 3064–3075. doi:10.1109/TII.2019.2908834
Chen, S., Li, P., Ji, H., Yu, H., Yan, J., Wu, J., et al. (2021). Operational flexibility of active distribution networks with the potential from data centers. Appl. Energy. 293, 116935. doi:10.1016/j.apenergy.2021.116935
Chen, Z., Wu, L., and Li, Z. (2014). Electric demand response management for distributed large-scale internet data centers. IEEE Trans. Smart Grid 5, 651–661. doi:10.1109/TSG.2013.2267397
Davies, G. F., Maidment, G. G., and Tozer, R. M. (2016). Using data centres for combined heating and cooling: an investigation for London. Appl. Therm. Eng. 94, 296–304. doi:10.1016/j.applthermaleng.2015.09.111
Ding, Z., Cao, Y., Xie, L., Lu, Y., and Wang, P. (2019). Integrated stochastic energy management for data center microgrid considering waste heat recovery. IEEE Trans. Ind. Appl. 55, 2198–2207. doi:10.1109/TIA.2018.2890789
Hao, X., Liu, P., Deng, Y., and Ye, G. (2024). Joint optimization of operational cost and carbon emission in multiple data center micro-grids. Front. Energy Res. 12, 1344837. doi:10.3389/fenrg.2024.1344837
He, W., Ding, S., Zhang, J., Pei, C., Zhang, Z., Wang, Y., et al. (2021). Performance optimization of server water cooling system based on minimum energy consumption analysis. Appl. Energy. 303, 117620. doi:10.1016/j.apenergy.2021.117620
He, Z., Ding, T., Liu, Y., and Li, Z. (2018). Analysis of a district heating system using waste heat in a distributed cooling data center. Appl. Therm. Eng. 141, 1131–1140. doi:10.1016/j.applthermaleng.2018.06.036
International Energy Agency (2022). Rozite, V. Data centres and data transmission networks. Available at: https://www.iea.org/energy-system/buildings/data-centres-and-data-transmission-networks.
Ji, H., Chen, S., Yu, H., Li, P., Yan, J., Song, J., et al. (2022). Robust operation for minimizing power consumption of data centers with flexible substation integration. Energy 248, 123599. doi:10.1016/j.energy.2022.123599
Jian, J., Zhao, J., Ji, H., Bai, L., Xu, J., Li, P., et al. (2024). Supply restoration of data centers in flexible distribution networks with spatial-temporal regulation. IEEE Trans. Smart Grid 15, 340–354. doi:10.1109/TSG.2023.3286844
Li, J., Li, Z., Ren, K., and Liu, X. (2012). Towards optimal electric demand management for internet data centers. IEEE Trans. Smart Grid 3, 183–192. doi:10.1109/TSG.2011.2165567
Lian, Y., Li, Y., Zhao, Y., Yu, C., Zhao, T., and Wu, L. (2023). Robust multi-objective optimization for islanded data center microgrid operations. Appl. Energy. 330, 120344. doi:10.1016/j.apenergy.2022.120344
Wan, J., Zhou, J., and Gui, X. (2021). Sustainability analysis of green data centers with CCHP and waste heat reuse systems. IEEE Trans. Sustain. Comput. 6, 155–167. doi:10.1109/TSUSC.2020.2979473
Wang, Z., Wang, Y., Ji, H., Hasanien, H. M., Zhao, J., Yu, L., et al. (2024). Distributionally robust planning for data center park considering operational economy and reliability. Energy 290, 130185. doi:10.1016/j.energy.2023.130185
Wu, X., Li, N., He, M., Wang, X., Ma, S., and Cao, J. (2022). Risk-constrained day-ahead scheduling for gravity energy storage system and wind turbine based on IGDT. Renew. Energy. 185, 904–915. doi:10.1016/j.renene.2021.12.111
Yeganehkia, M. H., Rezaei, M. M., Abedi, M., and Dowlatshahi, M. (2023). Presenting a new IGDT-based scheme for risk-based developing of distribution system restoration using online islanding method. Sustain. Energy Grids Netw. 34, 101014. doi:10.1016/j.segan.2023.101014
Yu, L., Jiang, T., and Zou, Y. (2018). Distributed real-time energy management in data center microgrids. IEEE Trans. Smart Grid 9, 3748–3762. doi:10.1109/TSG.2016.2640453
Zhang, Q., Meng, Z., Hong, X., Zhan, Y., Liu, J., Dong, J., et al. (2021). A survey on data center cooling systems: technology, power consumption modeling and control strategy optimization. J. Syst. Archit. 119, 102253. doi:10.1016/j.sysarc.2021.102253
Zhang, S., Gao, J., Qian, H., Yu, J., Luo, S., and Guo, Q. (2024). Power system operational reliability assessment based on the data center energy consumption elastic space. Front. Energy Res. 12, 1370861. doi:10.3389/fenrg.2024.1370861
Zhao, J., Zhang, Z., Yu, H., Ji, H., Li, P., Xi, W., et al. (2023). Cloud-edge collaboration-based local voltage control for DGs with privacy preservation. IEEE Trans. Ind. Inf. 19, 98–108. doi:10.1109/TII.2022.3172901
Zhao, Y., Lin, Z., Wen, F., Ding, Y., Hou, J., and Yang, L. (2019). Risk-constrained day-ahead scheduling for concentrating solar power plants with demand response using info-gap theory. IEEE Trans. Ind. Inf. 15, 5475–5488. doi:10.1109/TII.2019.2899003
Keywords: data center, multi-energy, waste heat recovery, operation optimization, information gap
Citation: Wang Z, Lin X, Zhang H, Yu L, Pan S, Liu T, Wu P and Wang T (2024) Operation optimization considering multiple uncertainties for the multi-energy system of data center parks based on information gap decision theory. Front. Energy Res. 12:1423126. doi: 10.3389/fenrg.2024.1423126
Received: 25 April 2024; Accepted: 28 May 2024;
Published: 21 June 2024.
Edited by:
Yue Zhou, Cardiff University, United KingdomReviewed by:
Chun Chen, Changsha University of Science and Technology, ChinaLv Chaoxian, China University of Mining and Technology, China
Copyright © 2024 Wang, Lin, Zhang, Yu, Pan, Liu, Wu and Wang. This is an open-access article distributed under the terms of the Creative Commons Attribution License (CC BY). The use, distribution or reproduction in other forums is permitted, provided the original author(s) and the copyright owner(s) are credited and that the original publication in this journal is cited, in accordance with accepted academic practice. No use, distribution or reproduction is permitted which does not comply with these terms.
*Correspondence: Xinhao Lin, bGlueGgyQGNzZy5jbg==