 Xiaogang Wu1
 Wentao Xu
- 1State Grid Zhejiang Electric Power Co., Ltd., Lishui Power Supply Company, Lishui, China
- 2State Grid Zhejiang Electric Power Co., Ltd., Hangzhou, China
- 3Nanjing Nanrui Jibao Engineering Technology Co., Ltd., Nanjing, China
Relay protection rejection and misoperation exist in the existing distribution network, which will affect the fault diagnosis results. To diagnose faults in distribution networks, this paper presents a fault diagnosis method for the distribution network based on the D-S evidence theory Bayesian network. First, the collected relay protection information is divided into two categories, protection information and circuit breaker information; the corresponding Bayesian network model is established based on their respective action logic, and the corresponding component failure probability is obtained by Bayesian backward inference. Second, the fault probabilities obtained from the two Bayesian networks are fused by the D-S evidence theory, and the obtained fault probabilities are used to diagnose the faulty component. Then, using the Bayesian network corresponding to the faulty component to perform Bayesian forward inference, the protection devices and circuit breakers are identified for misoperation or rejection to achieve the fault diagnosis of the distribution network. Finally, the correctness and reliability of the proposed diagnosis method are verified through the analysis of arithmetic cases.
1 Introduction
More and more distributed power sources and new types of loads are widely connected to the distribution network with the “double-carbon” goal. The dispatch center receives a large amount of alarm information from the Supervisory Control and Data Acquisition (SCADA) secondary equipment when faults occur in the distribution network, which increases the difficulty for operation and maintenance personnel to analyze the cause and process of the distribution network fault (Ferreira et al., 2016; Xialin et al., 2019).
Fault diagnosis of the power grid refers to the diagnosis of components through specific action data on protection devices and circuit breakers in the fault area, as well as the analysis of the action behaviors for protective devices and circuit breakers. The current typical grid fault diagnosis methods are Petri nets (Biao et al., 2019; YANG et al., 2020), artificial neural networks (Dongyuan et al., 2014; Guojiang et al., 2014), expert systems (Dongmei et al., 2014; Xuechen et al., 2017), rough set theory (Sun et al., 2013; Wenwu et al., 2021), analytic models (Daobing et al., 2024; Yuyang et al., 2021), multi-source information fusion (Weixing et al., 2021; Yu et al., 2021), and Bayesian networks (LUO and TONG, 2015; Pengzhe et al., 2021). Zhang et al. (2021) presented a method of partition fault diagnosis based on the improved probabilistic neural network (PNN) and gray relational analysis (GRA) integral, aiming at the problem of large-power grid fault diagnosis. (Zhang et al. (2023) proposed a quantitative representation method for alarm information and used the quantified alarm information as classification features based on the quantity and time-series distribution characteristics of alarm information during faults. A novel hybrid method of combining variational mode decomposition (VMD) and a convolutional neural network (CNN) for fault location and fault type identification is proposed by Zhang et al. (2022). The methods described by Wang et al. (2022) can distinguish false faults caused by measurement tampering attacks.
The above methods can realize the fault diagnosis of the power grid, but the method used cannot reflect the role of relay protection action information, and it is not easy to understand. The Bayesian network is a probability graph model used to represent the dependency relationships between variables and can be used to infer the states of other variables. At the same time, this graph theory representation is intuitive and easy to understand, which helps understand the interaction between relay protections. Luo and Tong (2015) evaluated the reliability of the action status and occurrence time of protection and circuit breakers in the power grid and introduced the concept of reliability in the Bayesian inference process to achieve power grid fault diagnosis. This method only considers the impact of SCADA system relay protection action information on fault diagnosis and does not analyze the incorrect action of relay protection. Zhang et al. (2021) built a Bayesian network model to realize the identification of relay protection rejection and misoperation and deduce the action sequence of each protection device and circuit breaker when the power grid faults. The Bayesian network structure in this method will make the information on the circuit breaker have less influence on the component fault judgment, which may misjudge when the circuit breaker fails to act for some reasons. He et al. (2011) used specific segmentation methods to segment the power grid and introduced the concept of overlap degree for D-S evidence fusion, then diagnosed the sub networks in different regions based on relay protection action information, and integrated the diagnostic results of each network to achieve fault diagnosis of the power grid.
To avoid the influence of incorrect action of the protection and circuit breaker on fault diagnosis, a new fault diagnosis of the distribution network based on D-S evidence theory is proposed in this paper. Compared with the previously proposed fault diagnosis method, the main contributions are as follows:
• The relay protection information is divided into two categories, protection action information and circuit breaker action information, and the Bayesian network model is established according to their respective action logic, which effectively avoids the problem of circuit breaker information having little influence on component fault judgment in a traditional Bayesian network model.
• The fusion of fault diagnosis information from two Bayesian network models using D-S evidence theory improves the accuracy of fault diagnosis.
The rest of the paper is structured as follows: Section 2 presents the rules for building Bayesian network models and their drawbacks; Section 3 presents the improvement in the Bayesian network model and implementation of fault diagnosis using D-S evidence theory; Section 4 presents the simulation results for different fault scenarios; and finally, Section 5 concludes the paper.
2 Bayesian network model for relay protection in distribution networks
2.1 Topological structure and protection configuration
Research on power grid fault diagnosis for the distribution network shown in Figure 1 analyzes the local power system relay protection information and power grid topology structure. At present, the main protection used in the distribution network is longitudinal differential protection, while the backup protection adopts zero-sequence overcurrent protection at both ends and distance protection at both ends.
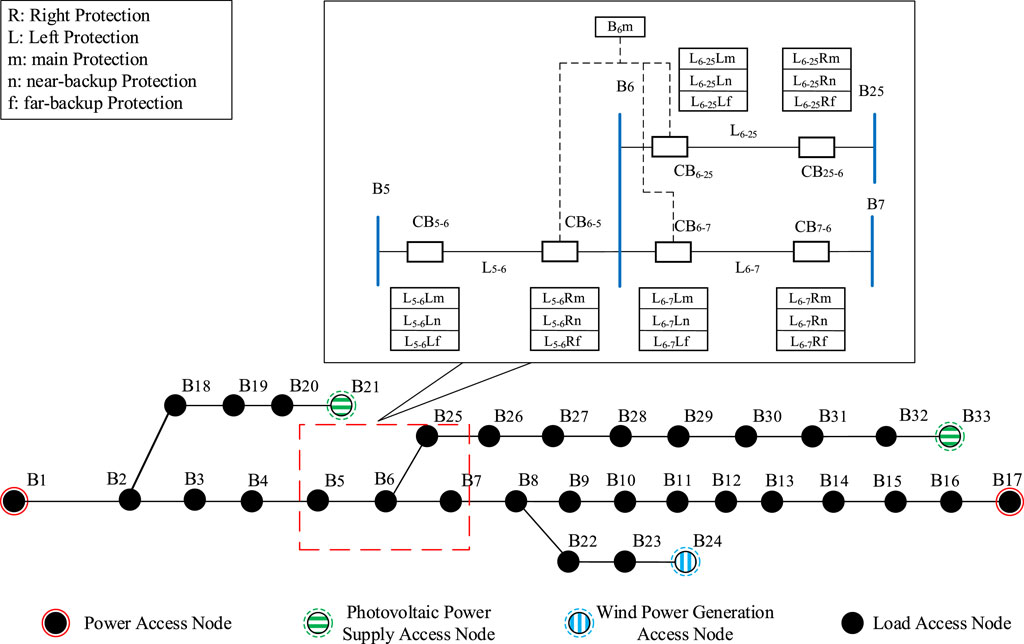
Figure 1. Topology and protection configuration of the distribution network.
2.2 Principle of protection action
This paper focuses on the analysis of lines and buses in the distribution network. We take the left side of protection L5-6Lm, L5-6Ln, and L5-6Lf of line L5-6 as examples to introduce the relevant line protection action principle in Figure 1. L5-6Lm is the main protection, which is only responsible for protecting its own lines, i.e., lines L5-6; L5-6Ln is a near-backup protection, which also protects the line itself; when the main protection L5-6Lm is rejected for some reason, the near-backup protection L5-6Ln operates to protect its own line; and L5-6Lf is the remote backup protection, which normally operates in the event of a fault in an adjacent element. When the adjacent bus B6 fails and its main protection does not operate, L5-6Lf acts as the remote backup protection to isolate the fault. All three types of protection will trigger CB5-6 trips when activated.
For bus protection, B6m is the main protection, which is only responsible for protecting the bus itself, i.e., B6, When a fault occurs on bus B6, bus main protection B6m acts to trigger CB6-5, CB6-7, and CB6-25 trips; the backup protection of the bus is served by the backup protection of the adjacent line of the bus, i.e., the remote backup protection of lines L5-6,CB6-25, and L6-7 serves as the backup protection of bus B6.
2.3 Bayesian network principle
A Bayesian network is a directed acyclic graph based on the structure of the network. Each node represents a variable in the network, the directed arc represents the relationship between variables, and the conditional probability between each node and its child nodes represents the dependency relationship between variables. The mathematical description is as follows. If X = {x1, x2, …, xn} is defined, where x1, x2, and xn are the nodes in the Bayesian network, then, the joint probability of the occurrence of multiple nodes p(x1, x2, … , xn) is
where π(xi) represents the set of parent nodes of xi in Eq. 1.
For a node xi in a Bayesian network with m elementary events {e1, e2, …, ek}, assuming that the event results E = {x1, … xi-1, xi+1 … , xn} for all nodes related to node xi have been obtained, the conditional probability of the sth event es of node xi occurring is shown in Eq. 2.
2.4 Bayesian network model for relay protection in distribution networks
When a fault occurs, there is not only a temporal relationship but also a certain logical relationship between protection device action and circuit breaker action in the relay protection of distribution networks. Normally, the distribution network protection will act after a component failure, and it will cause the circuit breaker to trip after the protection has acted, thus enabling fault isolation. Based on the relay protection action logics, the Bayesian network model for relay protection is shown in Figure 2. The network nodes are connected to each other according to the relay protection action logic in the following order: “component–main protection–near-backup protection–near-end breaker–far-backup protection–far-end breaker.”. The state of each node is represented by “0” and “1” in the Bayesian network model. For component nodes, the “normal” working state is indicated by “0” and the “fault” state by “1;” for circuit breakers and protection nodes, their “inactive” state is indicated by “0” and their “active” state by “1.”
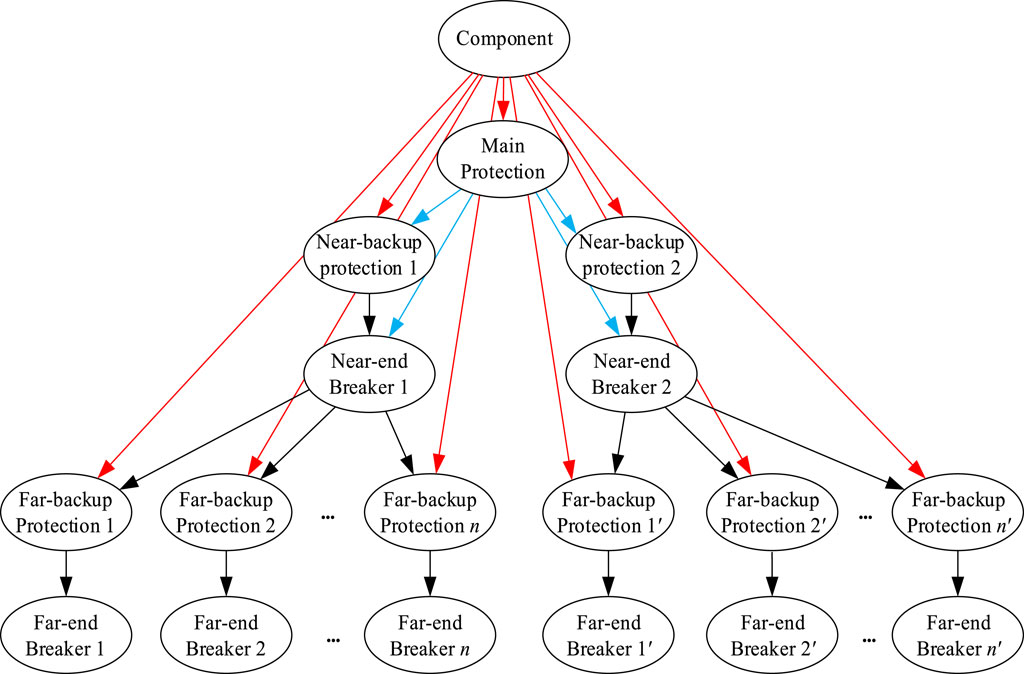
Figure 2. Bayesian network model for relay protection of the distribution network.
The component nodes of a traditional Bayesian network model structure are only connected to protection nodes, and circuit breaker nodes only play a role in connecting various types of protection nodes, which makes the action information on circuit breakers have less influence on the diagnostic role of faulty components in the Bayesian network.
3 Fault diagnosis of the distribution network based on the D-S evidence theory Bayesian network
In this section, we improve the structure of the traditional Bayesian network model to enhance the influence of circuit breaker information on component fault diagnosis. The results of the backward inference of each Bayesian network are fused using D-S evidence theory to calculate the fault probability of each component in the fault area and infer the faulty component. Then, Bayesian forward inference is used to obtain the protection device and circuit breaker for rejection and misoperation.
3.1 Improved Bayesian network model structure
The information obtained in traditional SCADA systems can be divided into two main categories, one for protection action information and the other for circuit breaker action information, so Bayesian networks can be built for each of these two types of information.
1) The Bayesian network model corresponding to the protection action information is shown in Figure 3. The connection sequence of the structure is “component–main protection–near-backup protection–far-backup protection.”
2) The Bayesian network model corresponding to the circuit breaker action information is shown in Figure 4. The connection sequence of its structure is “component–near-end circuit breaker (triggered by the action of main protection or near-backup protection)–far-end circuit breaker (triggered by the action of far-backup protection).”
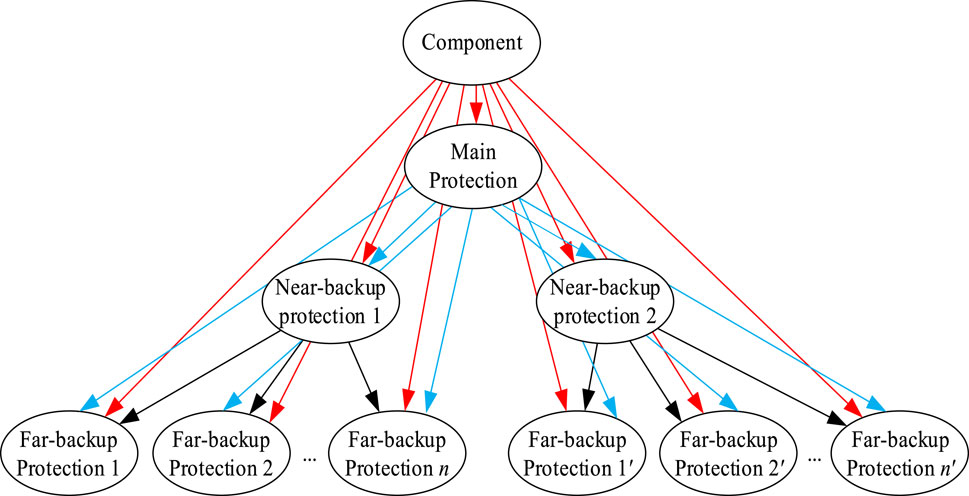
Figure 3. Bayesian network model of protecting information.
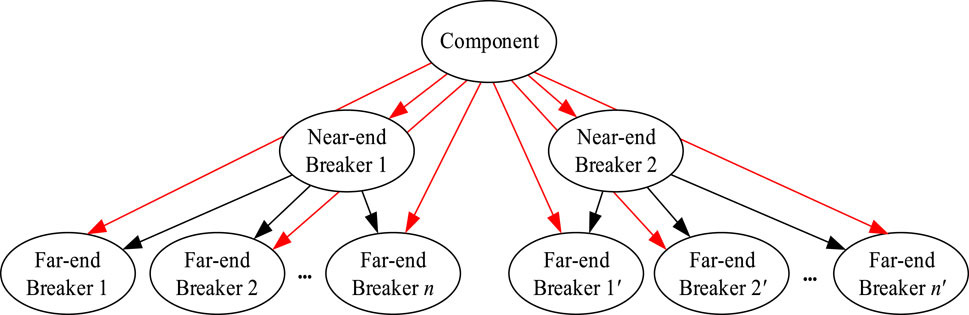
Figure 4. Bayesian network model of circuit breaker information.
In the case of a distribution network, when the main protection (near backup protection) is triggered and the near-end circuit breaker does not trip, the remote backup protection operates to isolate the fault by tripping the remote-end circuit breaker. In this scenario, the remote-end circuit breaker node is considered a leaf node in the Bayesian network model. However, when the state of the remote backup protection node is “1,” the diagnostic result for the faulty component remains the same, regardless of whether the remote-end circuit breaker node is in state “1” or “0.” Therefore, this paper proposes a novel Bayesian network model that classifies the nodes in the traditional relay protection Bayesian network model based on the type of information, distinguishing between protection information and circuit breaker information. The model is established according to the respective operating logics. This approach allows for a more intuitive analysis of the faulty components and reduces the dependency of circuit breaker nodes on protection nodes in the Bayesian network. Moreover, even in cases where some protection information is missing, the investigation of suspected faulty components within the fault area can still be carried out based on circuit breaker information.
According to expert knowledge, test data, and equipment history information, the Bayesian network is assigned to determine the prior probability of each component node and the conditional probability of relay protection node in a power system. The probability assignment of component nodes is shown in Table 1, and the conditional probability assignment of relay protection devices and circuit breaker nodes is shown in Table 2 (Yiquan et al., 2020). The conditional probabilities of the protection nodes of various components of the power system are similar, the conditional probabilities of several types of relay protection can be easily selected, and the conditional probability values of the remaining nodes in the system network can be calculated by analogy.
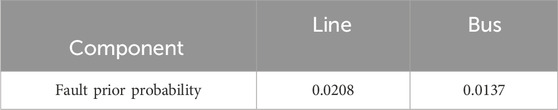
Table 1. Failure prior probability for element nodes.
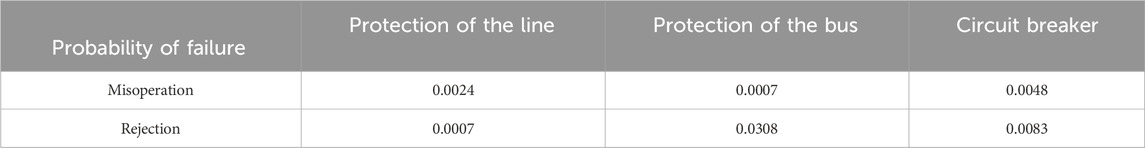
Table 2. Rejection and misoperation probability of the relay protection device and circuit breaker.
3.2 D-S evidence theory
The two types of information Bayesian network models are used to obtain the component failure probabilities under the respective network models by Bayesian backward inference, which requires the application of D-S evidence theory for failure probability fusion.
The D-S evidence theory is a theory of imprecise reasoning that can transform propositions into mathematical sets for analysis. Assuming that there is a problem that needs to be judged, if all the consequences that can be caused by a specific event can be exhaustively listed, it is denoted as set U. In D-S evidence theory, U is called the identification framework, and the elements in U are finite and incompatible with each other.
If the function m: 2U→[0,1] satisfies the condition
1)
2)
Then, m(A) is called the basic probability assignment function of A. A function Bel: 2U→[0,1] that satisfies the condition: Bel(A) =
Assuming that set U has trust functions Bel1 and Bel2, and its basic probability assignment functions are m1 and m2, A1, A2, … , Ak and B1, B2, … , Br are the corresponding focal elements. When K < 1, the combination rule of D-S evidence theory is shown in Eq. 3.
where K < 1; K is the conflict factor, which expresses the degree of conflict between different lines of evidence and can be divided into two situations.
(1) When K ≠ 1, then m determines a basic probability assignment.
(2) When K = 1, it can be determined that m1 and m2 are mutually exclusive and cannot be fused using D-S evidence theory.
3.3 Identifying faulty components
The Bayesian network model of protecting information and circuit breaker information corresponds to two mutually independent lines of evidence in D-S evidence theory; each line of evidence will derive a corresponding probability of fault information by Bayesian backward inference, combining the two-component fault probability information according to the D-S evidence theory rules. The fused equation is shown in Eq. 4.
where PP and PCB represent the probability values under the Bayesian network model for protection information and circuit breaker information, respectively; X represents the corresponding parent node of each Bayesian network, i.e., the component node (bus or line node).
Since each component of the power system network can build its own Bayesian network, each component can only appear in its own Bayesian network. The fault probability of each component fused after backward inference is defined as an; the threshold for line faults is 0.8 (Yiquan et al., 2020) and for bus faults is 0.6 (Luo and Tong, 2015). It is determined that the component is a faulty component when an is greater than or equal to the threshold of the corresponding component. The fault component judgment process based on D-S evidence theory is shown in Figure 5.
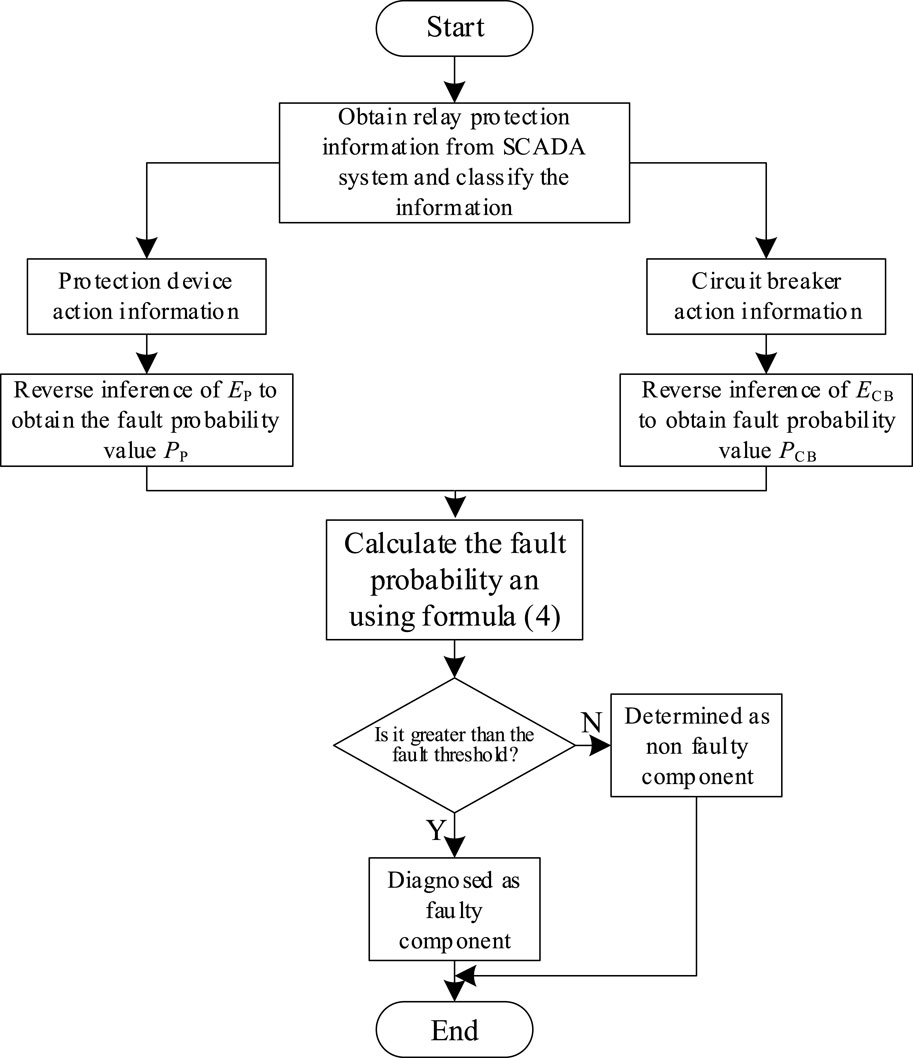
Figure 5. Flow of judging the fault component based on D-S evidence theory.
3.4 Analysis of the action behavior of protective devices and circuit breakers
The posterior probability of each node in the faulty component is found corresponding to the protection information Bayesian network model and circuit breaker information Bayesian network model, according to Bayesian forward inference with prior probability assignment, i.e., the expected action probability of each protection device node and circuit breaker node in the case of component failure is known. The specific steps are as follows.
Step 1: The protection information Bayesian network model and circuit breaker information Bayesian network model corresponding to the identified faulty component are found, and the parent node (component node) is set in both Bayesian network models to state “1,” i.e., the component is faulty.
Step 2: The forward inference of the Bayesian algorithm is made for the Bayesian network model of protection information and circuit breaker information to calculate the action expectation of the corresponding protection device and circuit breaker in the case of faults.
Step 3: The expected action probability of the protection device and circuit breaker obtained through Bayesian forward inference is compared with the actual situation E of the protection device and circuit breaker action to obtain the difference Δm, which is the basis for judging the action of protective devices and circuit breakers. The discrimination method is shown in (Eq. 5).
where a, b∈(0,1), and a + b = 1, where both a and b are taken as 0.5 in this paper.
4 Example analysis
Based on the MATLAB R2018a simulation platform, part of the distribution network structure shown in Figure 1 is selected to verify the correctness of the proposed method, and its topology structure is shown in Figure 6. Meanwhile, the traditional Bayesian network algorithm is compared with the information fusion method based on the Bayesian network proposed in this paper.
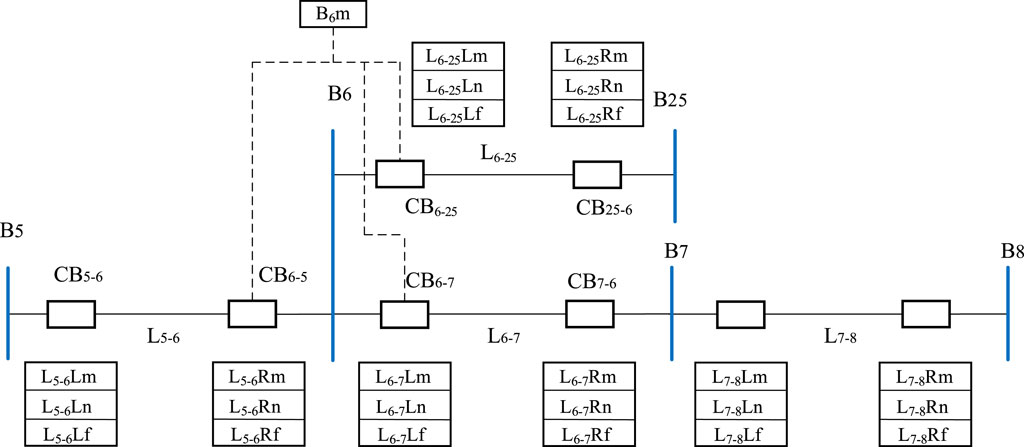
Figure 6. Part topology of the DC distribution network and its protection configuration.
4.1 Normal operation of relay protection
In the case of the normal operation of relay protection, this paper designs line faults (scene 1) and bus faults (scene 2) to verify the superiority of the method proposed.
Scene 1: Line L6-7 fault, CB6-7 and CB7-6 tripped; specific relay protection action information is shown in Table 3.
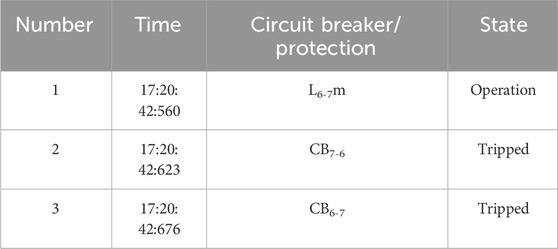
Table 3. Relay protection action information in scene 1.
A brief explanation of the method proposed in this paper according to scene 1 is provided as an example. There is only one component in the fault area according to the topology structure of the distribution network and relay protection action information, i.e., line L6-7; two Bayesian network models of line L6-7 are shown in Figures 7, 8, and the final fault probability obtained was 89.89% through the D-S evidence fusion method, while the fault probability obtained by the traditional method was 98.65%. For line faults, the method proposed in this paper improves the accuracy by 8.76% compared to traditional methods.
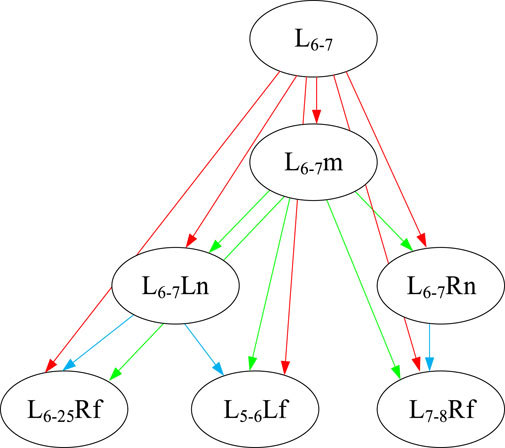
Figure 7. Bayesian network model for protection information on line L6-7.
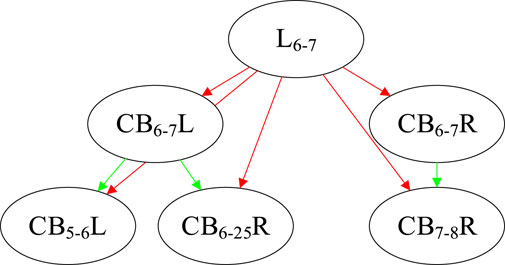
Figure 8. Bayesian network model for circuit breaker information on line L6-7.
Scene 2: Bus B6 fault, CB6-5, CB6-7, and CB6-25 tripped. The specific relay protection action information is shown in Table 4.
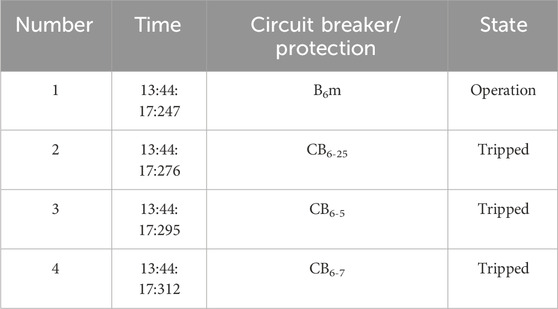
Table 4. Relay protection action information in scene 2.
For fault scene 2, the same method as in fault scene 1 was used to establish a Bayesian network model, resulting in a bus fault probability of 99.99%, while the result obtained using the traditional Bayesian inference method was 95.06%. The method proposed in this paper improves the accuracy by 4.93% compared to traditional methods. The method in this paper is better than the traditional method in a normal situation, where there is no rejection or misoperation of the relay protection from the fault probability results of the line and bus.
4.2 Abnormal operation of relay protection
Incorrect parameter settings of relay protection, aging or damage of the relay protection equipment itself, and other factors may cause relay protection to reject and misoperate. This paper sets three types of fault scenes to verify the accuracy of fault diagnosis under the abnormal operation of relay protection.
Scene 3: Line L6-7 fault, CB7-6 refused to operate, relevant backup protection acted and triggers the circuit breaker to trip. The specific relay protection action information is shown in Table 5.
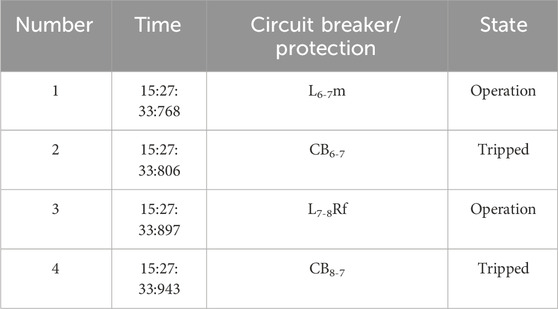
Table 5. Relay protection action information in scene 3.
There are four components in the fault area according to the topology structure of the distribution network and relay protection action information, i.e., line L6-7, line L7-8, and bus B7. The corresponding Bayesian network models are built for these components, and their probabilities are calculated for the traditional method (Mt) and the proposed method in this paper (Mp). A comparison of the two methods is shown in Figure 9 and Table 6.
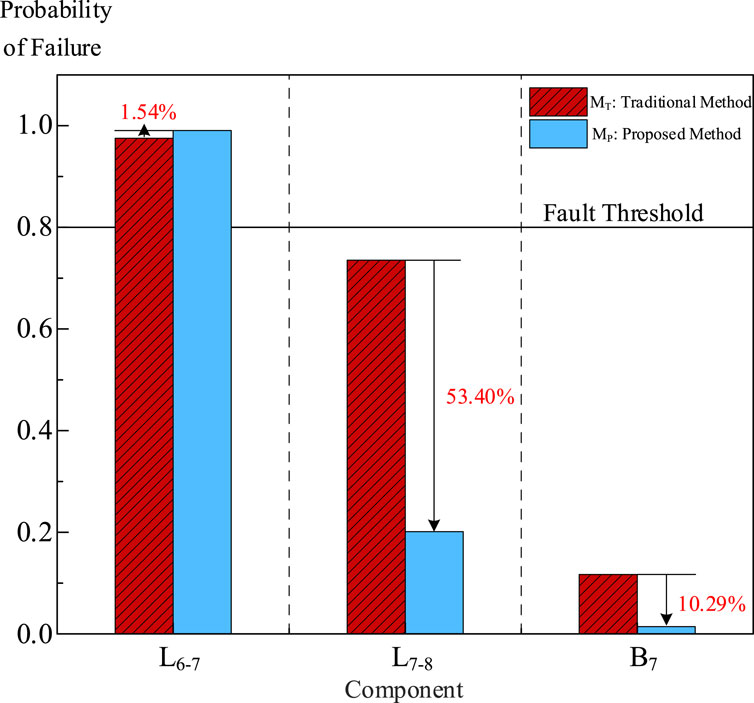
Figure 9. Comparison of calculation results between the two methods in scene 3.
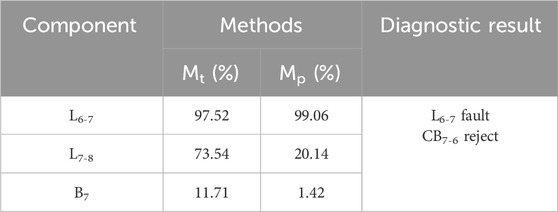
Table 6. Analysis of diagnostic results in scene 3.
The Bayesian network of protection information and circuit breaker information corresponding to the fault component does forward inference, according to the rules of relay protection behavior criterion after determining the fault element is line L6-7. The results of the protection and circuit breaker behavior calculations show that CB7-6 is rejection. The fault diagnosis result is the line L6-7 fault, and CB7-6 refuses to operate, which is consistent with the present scene.
Scene 4: Line L6-7 fault, main protection L6-7Lm refuses to operate, and the relevant backup protection operates and triggers the circuit breaker to trip; the specific relay protection action information is shown in Table 7. The results of the component fault and comparison of two methods are shown in Figure 10 and Table 8, respectively.
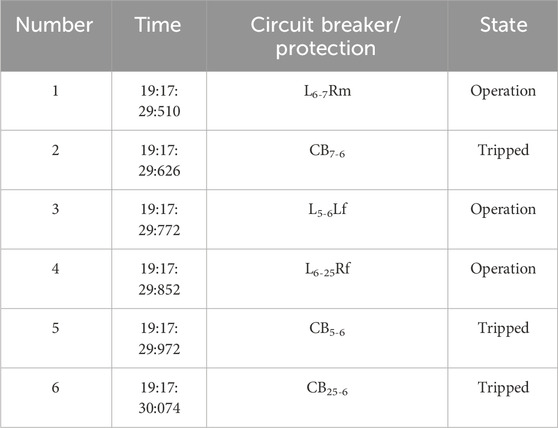
Table 7. Analysis of diagnostic results in scene 4.
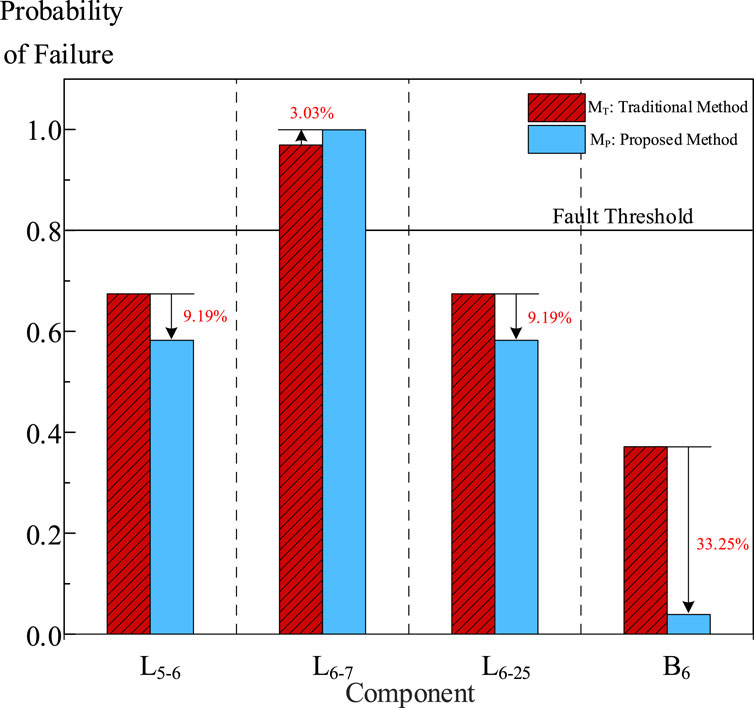
Figure 10. Comparison of calculation results between the two methods in scene 4.
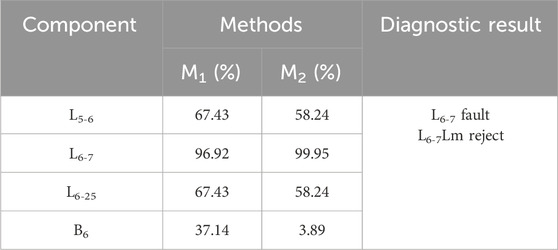
Table 8. Analysis of diagnostic results in scene 4.
Scene 5: Bus B6 fault, B6m refuses to operate, relevant backup protection acted and triggered the circuit breaker to trip; the specific relay protection action information is shown in Table 9. The results of the component fault and comparison of two methods are shown in Figure 11 and Table 10, respectively.
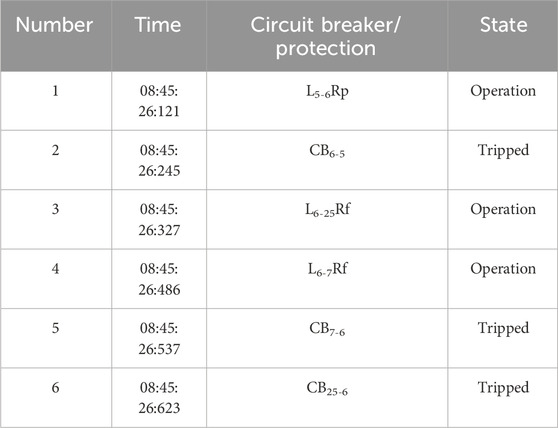
Table 9. Relay protection action information in scene 5.
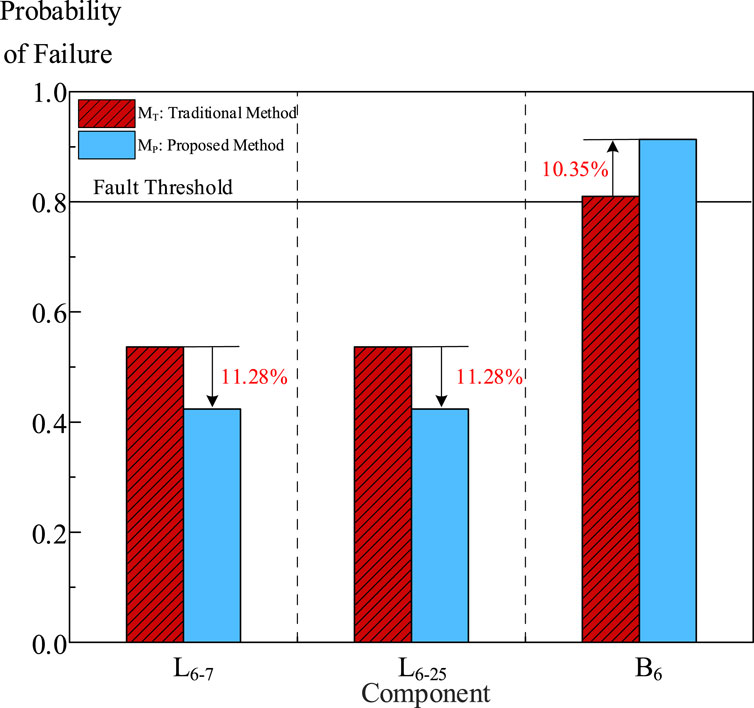
Figure 11. Comparison of calculation results between the two methods in scene 5.

Table 10. Analysis of diagnostic results in scene 5.
When abnormal operation of relay protection occurs, the comparison of the calculation results of the above fault scenes shows that the method proposed in this paper can not only improve the fault probability value of faulty components but also reduce the fault probability value of non-faulty components, making fault diagnosis more favorable.
4.3 Component fault diagnosis in the absence of relay protection information
During the transmission of relay protection action information to the SCADA system, multiple data routes may result in missing information in the SCADA system, which can have an impact on component fault diagnosis. For this reason, some relay protection information loss in scenes 3–5 is used as an example. Table 11 shows the fault diagnosis results of the three methods.
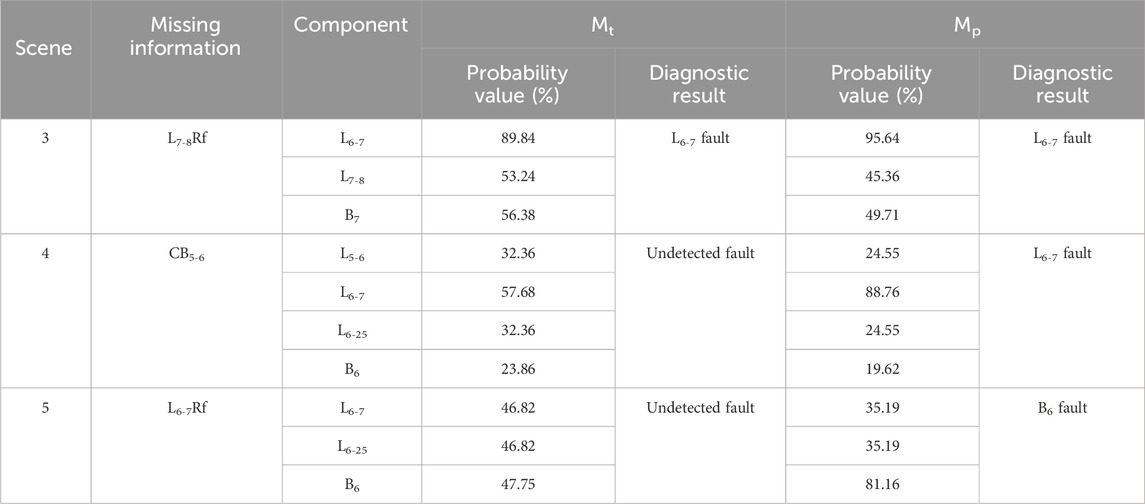
Table 11. Fault diagnosis results for the bus with a lack of information.
The calculation results given in Table 11 show that when some relay protection information is missing, the traditional method can no longer diagnose the fault, while the proposed method can diagnose the fault component. For fault scene 4, the SCADA system is missing circuit breaker action information, i.e., CB5-6 information is missing. Traditional fault diagnosis methods cannot identify fault lines due to the absence of circuit breaker action information, but this method can identify faults, and the same is true for fault scene 5. It shows that the proposed method has better anti-interference ability and robustness than the traditional algorithm.
5 Conclusion
This article proposes a distribution network fault diagnosis based on D-S evidence theory, which realizes the diagnosis of components and relay protection behavior after a fault occurs in the distribution network. The following conclusions are obtained.
(1) Based on the action logic of the protection and circuit breaker, Bayesian network models were established separately, increasing the number of Bayesian networks to enable the independent analysis of fault diagnosis results from two levels, protection information and circuit breaker information, thereby improving the accuracy of fault diagnosis.
(2) The distributed fault diagnosis of “distributed diagnosis, centralized fusion” is realized by combining two Bayesian networks with D-S evidence theory.
(3) It can not only diagnose the fault when the relay protection is not correct but also diagnose the fault component correctly when the relay protection information is missing and has strong robustness.
This article mainly focuses on the fusion method of D-S evidence theory and applies Bayesian network inference in the actual fault diagnosis of power grids. However, as the research deepens, the impact of fault timing on the diagnosis results has not been considered in the fault diagnosis process of this article. It should be focused on in the next research work.
Data availability statement
The original contributions presented in the study are included in the article/Supplementary Material; further inquiries can be directed to the corresponding author.
Author contributions
XW: writing–original draft. HZ: writing–review and editing. WX: writing–review and editing. WP: writing–review and editing. QJ: writing–review and editing. XH: writing–review and editing.
Funding
The author(s) declare that financial support was received for the research, authorship, and/or publication of this article.
Conflict of interest
Authors XW, HZ, WX, and QJ were employed by State Grid Zhejiang Electric Power Co., Ltd., Lishui Power Supply Company. Author WP was employed by State Grid Zhejiang Electric Power Co., Ltd. Author XH was employed by Nanjing Nanrui Jibao Engineering Technology Co., Ltd.
The authors declare that this study received funding from the Unveiling and Leadership Project supported by State Grid Zhejiang Electric Power Co., Ltd. (research on the “Three Lines of Defense” System Architecture and Fault Defense Technology of Distribution Networks under High Power Penetration, B311LS230007). The funder had the following involvement in the study: design, analysis.
Publisher’s note
All claims expressed in this article are solely those of the authors and do not necessarily represent those of their affiliated organizations, or those of the publisher, the editors, and the reviewers. Any product that may be evaluated in this article, or claim that may be made by its manufacturer, is not guaranteed or endorsed by the publisher.
References
Biao, X. U., Xianggen, Y. I. N., Zhang, Z., and Xusheng, L. I. Time Petri net based Fault Diagnosis model considering topology structure. Proc. CSEE, 2019, 39(9): 2723–2735. doi:10.13334/j.0258-8013.pcsee.172381
Daobing, L., Yingying, G., Shichun, L., Miaosheng, B., Yue, Q., and Yucen, L. (2024). Analytical model of power grid Fault Diagnosis considering main protection range of three-section line protection[J/OL]. Power Syst. Technol., 1–8. doi:10.13335/j.1000-3673.pst.2022.1173
Dongmei, Z., Zhang, X., Juan, W., Weichen, L., and Dongying, Z. (2014). Power grid Fault Diagnosis aiming at reproducing the fault process. Proc. CSEE 34 (13), 2116–2123. doi:10.13334/j.0258-8013.pcsee.2014.13.013
Dongyuan, S., Guojiang, X., Jinfu, C., and Yinhong, L. (2014). Divisional Fault diagnosis of power grids based on RBF neural network and fuzzy integral fusion. Proc. CSEE 34 (4), 562–569. doi:10.13334/j.0258-8013.pcsee.2014.04.007
Ferreira, V. H., Zanghi, R., Fortes, M. Z., Sotelo, G., Silva, R., Souza, J., et al. (2016). A survey on intelligent system application to Fault Diagnosis in electric power system transmission lines. Electr. Power Syst. Res. 136, 135–153. doi:10.1016/j.epsr.2016.02.002
Guojiang, X., Dongyuan, S., Lin, Z., and Xiangwen, C. (2014). Fuzzy cellular Fault Diagnosis of power grids based on radial basis function neural network. Automation Electr. Power Syst. 38 (5), 59–65. doi:10.7500/AEPS20130603005
He, X., Tong, X., and Sun, M. (2011). Distributed power system Fault Diagnosis based on bayesian network and dempster-shafer evidence theory. Automation Electr. Power Syst. 35 (10), 42–47.
Luo, X., and Tong, X. (2015). Structure-variable bayesian network for power system Fault Diagnosis considering credibility. Power Syst. Technol. 39 (9), 2658–2664. doi:10.13335/j.1000-3673.pst.2015.09.043
Pengzhe, R., Youbo, L., Tingjian, L., Peidong, H., Yangfan, Z., and Shuyu, D. (2021). Robust identification algorithm for distribution network topology based on mutual-information bayesian network. Automation Electr. Power Syst. 45 (9), 55–62. doi:10.7500/AEPS20200818001
Sun, Q. Y., Wang, C. L., Wang, Z. L., and Liu, X. (2013). A Fault Diagnosis method of smart grid based on rough sets combined with genetic algorithm and tabu search. Neural Comput. Appl. 23 (7-8), 2023–2029. doi:10.1007/s00521-012-1116-x
Wang, T., Liu, W., Cabrera, L. V., Wang, P., Wei, X., and Zang, T. (2022). A novel fault diagnosis method of smart grids based on memory spiking neural P systems considering measurement tampering attacks. Inf. Sci. 596, 520–536. doi:10.1016/j.ins.2022.03.013
Weixing, Z., Nan, X., Nan, N., Yihong, L., Zhanji, G., and Haiqing, L. (2021). Multi-layer intelligent Fault Diagnosis method of power grid based on multi-source information fusion. South. POWER Syst. Technol. 15 (9), 9–15. doi:10.13648/j.cnki.issn1674-0629.2021.09.002
Wenwu, L., Weijun, Z., Hui, L., Yabing, Y., Guoqin, D., Xuan, W., et al. (2021). A rough set-based bio-inspired fault diagnosis method for smart substation protection equipment. Power Syst. Prot. Control 49 (21), 132–140. doi:10.19783/j.cnki.pspc.210041
Xialin, L., Li, G., Di, H., Yiqi, Z., and Chengshan, W. (2019). Research review on operation and Control of DC distribution networks. High. Volt. Eng. 45 (10), 3039–3049. doi:10.13336/j.1003-6520.hve.20190924002
Xuechen, J., Dazhi, W., Yi, N., and Cuiling, Z. (2017). Query method for optimal diagnosis of power system faults. High. Volt. Eng. 43 (4), 1311–1316. doi:10.13336/j.1003-6520.hve.20170328031
Yang, F., and Yongjin, Y. U. (2020). Fault diagnosis of distribution network based on time constrained hierarchical fuzzy Petri nets. Power Syst. Prot. Control 48 (2), 99–106. doi:10.19783/j.cnki.pspc.190200
Yiquan, L., Shaolin, J., Genghui, Z., Wei, L., Qingrui, T., Qian, T., et al. (2020). A new method to deduce complex fault of power grid based on Bayesian network. Power Syst. Prot. Control 48 (4), 57–63. doi:10.19783/j.cnki.pspc.190451
Yu, W., Changbao, X. U., Zhu, J., et al. (2021). Grid fault diagnosis method for multi-source information fusion based on improved Petri net and Hilbert transform. Electr. Meas. & Instrum. 58 (6), 125–129. doi:10.19753/j.issn1001-1390.2021.06.018
Yuyang, L. I., Zengping, WANG, and Qiao, Z. (2021). Distributed Fault section location for ADN based on bayesian complete analytic model and multi-factor dimension reduction. Power Syst. Technol. 45 (10), 3917–3927. doi:10.13335/j.1000-3673.pst.2020.1622
Zhang, Q., Ma, W., Li, G., Ding, J., and Xie, M. (2022). Fault diagnosis of power grid based on variational mode decomposition and convolutional neural network. Electr. Power Syst. Res. 208, 107871. doi:10.1016/j.epsr.2022.107871
Zhang, Q., Ma, W., Li, G., Xie, M., and Shao, Q. (2021). Partition Fault diagnosis of power grids based on improved PNN and GRA. IEEJ Trans. Electr. Electron. Eng. 16 (1), 57–66. doi:10.1002/tee.23268
Keywords: Bayesian network, distribution network, D-S evidence theory, fault diagnosis, Bayesian inference
Citation: Wu X, Zhao H, Xu W, Pan W, Ji Q and Hua X (2024) Fault diagnosis of the distribution network based on the D-S evidence theory Bayesian network. Front. Energy Res. 12:1422639. doi: 10.3389/fenrg.2024.1422639
Received: 24 April 2024; Accepted: 02 July 2024;
Published: 07 August 2024.
Edited by:
Chaolong Zhang, Jinling Institute of Technology, ChinaReviewed by:
Yong Hu, Hong Kong Polytechnic University, Hong Kong SAR, ChinaFang Shi, Shandong University, China
Jian Wang, Southwest Jiaotong University, China
Andre Abel Augusto, Fluminense Federal University, Brazil
Copyright © 2024 Wu, Zhao, Xu, Pan, Ji and Hua. This is an open-access article distributed under the terms of the Creative Commons Attribution License (CC BY). The use, distribution or reproduction in other forums is permitted, provided the original author(s) and the copyright owner(s) are credited and that the original publication in this journal is cited, in accordance with accepted academic practice. No use, distribution or reproduction is permitted which does not comply with these terms.
*Correspondence: Wentao Xu, MTU1OTA3Nzg2MzVAMTYzLmNvbQ==