 Zhe Man1
 Zhe Xu
 Kan Kan
- 1Pumped Storage Technological and Economic Research Institute of State Grid Xinyuan Co., Ltd., Beijing, China
- 2College of Water Conservancy and Hydropower Engineering, Hohai University, Nanjing, China
- 3School of Electrical and Power Engineering, Hohai University, Nanjing, China
In current engineering, the transition process of pump turbines from pump to turbine mode mainly includes the shutdown process of pump operating and the startup process of turbine operating, and the switching of working conditions mostly depends on the opening and closing of the ball valve. While, this article focuses on the transitional process of pump turbine from pump to turbine condition without relying on ball valve, which will significantly reduce the response time of the unit and enable quick switching of operating conditions in emergency situations. In this study, the torque balance equation is employed to analyze the transition process of the entire flow system from pump to turbine operation. Additionally, the entropy production theory is utilized to investigate the correlation between pressure, flow state, and energy loss in the pump-turbine, shedding light on the changes in external characteristics through the evolution of internal characteristics. Furthermore, the transition process from pump mode to turbine mode is segmented into five stages based on the variations in the guide vanes (GV). The findings reveal that the rotation of GV triggers sharp fluctuations in static pressure, torque, and axial force. During stage four, the initiation of all three GV positions results in an increase in flow rate and torque, accompanied by a decrease in axial force. In stage two, the closure of GV leads to a decrease in pressure within the spiral casing (SC) and stay vanes (SV) domains, coupled with an increase in pressure in the bladeless zone, runner, and draft tube domains. Simultaneously, the pressure difference between both sides of the runner decreases significantly, directly causing a drop in torque and axial force. In stage three, GV closure interrupts the flow in the pump-turbine, resulting in significant backflow in the SC, SV, and runner domains, alongside high-speed circulation in the bladeless area. Moreover, the location of the high entropy production rate (EPR) value within the unit aligns with the reflux zone, indicating considerable energy loss attributable to reflux. The above research results will provide reference for the rapid switching of operating conditions of pump turbines in emergency situations.
1 Introduction
In the context of energy conservation and emission reduction goals, pumped storage power stations have garnered widespread attention as a mature, economically efficient, and large-scale energy storage method. These power stations primarily serve functions such as frequency regulation, phase regulation, and ensuring the stability of the power system within the grid. As such, they hold significant application prospects in the development of new energy power structures (Kan et al., 2022a). The pump-turbine, serving as a core component for the conversion between pumping and turbine operating conditions, holds paramount research significance due to its operational stability (Xu et al., 2022; Liu et al., 2024).
Although the flow state of a pump-turbine remains stable during steady operation, encountering non-steady state phenomena such as drastic changes in flow rate, reverse rotation of the impeller, and torque fluctuations during transient processes is inevitable. In severe cases, non-steady state operation may result in irreversible damage to the equipment. Pumped storage units continually need to switch between pumping and power generation conditions based on actual requirements (Mahfoud et al., 2023). Consequently, studying the transition process from pump to turbine condition holds significant importance for gaining a deeper understanding of the stable operation of pumped storage units.
The one-dimensional method of characteristics (MOC) is a commonly used method for studying the transient process of pump-turbine, with the advantages of fast calculation and accurate simulation of external characteristics (Afshar et al., 2010; Zheng et al., 2020; Lu et al., 2024). Rohani and Afshar (2010) modified the Implicit MOC to improve computational accuracy with less computational time, and produced an improved pump formulation to improve the numerical convergence. Elaoud and Hadj-Taïeb (2011) simulated the transient flow inside the cylindrical pipe of a centrifugal pump during startup was numerically with the MOC method, while different startup mechanisms of motor torque from fast to slow were adopted. Cui et al. (2022) applied the discrete solution of MOC to obtain the fluid velocity and pressure during the startup and shutdown process of the oil pump. Cao et al. (2022) proposed a novel surge damping strategy based on MOC to analyze the wave surge damping effectiveness during the closing situation of a centrifugal pump.
Even though the MOC method provides easy and rapid access to transient characteristics of the unit, conducting three-dimensional visualization research on its flow field is not feasible. To address this limitation, computational fluid dynamics (CFD) has emerged as a powerful tool, leveraging rapidly developing contemporary numerical software for simulating transient processes in the internal flow field of pump turbines (Zhang et al., 2023; Sun et al., 2024). Feng et al. (2019) investigated the transient process resulting from a power failure of a bulb hydraulic turbine, focusing on cavitation evolution. Their findings revealed that cavitation occurring on the blades led to a decrease in impeller torque, ultimately resulting in a reduction in the runaway duration. Chen et al. (2021) examined the pressure and flow state evolution during the load-rejection transient process of a double-regulated bulb turbine. Simulation results demonstrated that the intense effect of reverse flow from the runner blades induced notable fluctuations in torque and axial force, while disruption of the low-pressure vortex rope occurred due to a pressure distribution primarily governed by gravity. Kan et al. (2022b) simulated the transient runaway process of an axial-flow pump with ultra-low head, transitioning from pump operation to turbine operation under bidirectional conditions. The simulation indicated that when the velocity decreases to zero, the vorticity is higher at the inlet edge on the suction surface of the impeller blades under forward conditions compared to backward conditions. Jin et al. (2023) combined MOC and CFD to investigate the dynamic response of a pump-turbine during the startup process under turbine operation. The results demonstrated that the high-pressure region initially concentrated on the pressure surface on the runner inlet side, gradually expanding and transferring to the suction surface on the inlet side.
During the dynamic operation of pump-turbine units, significant fluctuations in both internal and external characteristics often coincide with profound changes in energy loss. By leveraging the entropy production method based on computational fluid dynamics (CFD), researchers can conduct three-dimensional visualization research on unit energy loss, thereby enhancing the study of transient unit characteristics (Kan et al., 2022c; Xu et al., 2023; Li et al., 2024). Initially, Abu-Hijleh et al.(1999); Abu-Hijleh and Heilen (1999) laid the foundation by establishing equations for Entropy Production Rate (EPR) for laminar flow using a cylindrical coordinate system. This seminal work was later expanded upon by Kock and Herwig (2004); Herwig and Kock (2007), who extended the application of EPR to turbulent flow through a Cartesian coordinate system. As entropy production theory continues to evolve, more scholars are embracing this approach to analyze energy loss in unit flow fields (Tao and Wang, 2021). For instance, Pang et al. (2023) delved into the impact of vortex rope on energy loss in the draft tube, uncovering that deep cavitation significantly amplifies energy loss inside the draft tube. Additionally, Zhao et al. (2023) devised innovative stay-guide vanes with bionic protuberances based on the entropy production method, demonstrating through simulations a remarkable 4% reduction in energy loss by mitigating flow separation in the guide vanes and runner. Meanwhile, Li et al. (2024) introduced a cutting-edge circumferential spoke structure in the runner to augment the stall performance of mixed-flow pumps. Their simulations showcased the structure’s prowess in effectively curbing leakage flow, consequently leading to a notable reduction in total entropy production (TEP).
This research paper undertakes an exploration of the evolution of characteristic parameters of pump-turbines during the transition from pump mode to turbine mode. By applying the entropy production method, it delves into the intricate relationship between energy losses and flow state variations. The following sections elucidate the governing equations and theory of the entropy production method, elaborate on the geometric model and settings of transient simulation, and engage in comprehensive discussion and analysis encompassing the evolution of pump-turbine’s external performance characteristics, static pressure, flow state, and energy dissipation. Finally, the paper culminates in presenting the key conclusions derived from this insightful investigation.
2 Theory of the simulation
2.1 Governing equations and turbulence model
The entire flow system of the pump-turbine operates under the laws of mass and momentum conservation. Meanwhile, the SST k-ω turbulence model is adopted in the simulation, and the turbulence viscosity formula is modified to better transfer wall shear stress, which helps predict the flow near the wall (Menter, 2009; Lin et al., 2021). To maintain stable water levels, upstream and downstream surge chambers are incorporated into the computational domain. These surge chambers contain two phases of water and air, with the free surface consistently stabilized. To simulate the interface between these phases, the volume of fluid (VOF) model is described by Eq. 1: (Kan et al., 2021a):
where t is the physical time (s),
where ρ1 is the water density (kg/m3), ρ2 is the air density (kg/m3), μ1 is the dynamic viscosity of water phase (Pa·s), and μ2 is the dynamic viscosity of air phase (Pa·s).
2.2 Entropy production theory
In this paper, the Entropy Production Rate (EPR) of Reynolds time-averaged flow encompasses three main aspects: direct dissipation (EPDD), turbulence dissipation (EPTD), and wall shear stress (EPWS). These aspects can be calculated using Eqs 4–6 (Wang et al., 2020; Zhang et al., 2020).
where
Thereby, the TEP contains the integrals for above three energy loss terms, which can be defined by Eqs 7-10: (Yu et al., 2021):
where
3 Setup of the simulation
3.1 Geometric model
The pump-turbine station serves as a daily regulation facility, primarily offering peak shaving, valley filling, and emergency reserve capacity for the State Grid. The numerical domain encompasses the entire flow system, including the pump-turbine and long-distance pipe. Specifically, the pump-turbine constitutes the primary research area, comprising the spiral casing (SC), stay vanes (SV), guide vanes (GV), runner, and draft tube. The runner structure incorporates blades and splitters to enhance performance. Surge chambers are installed in the upstream and downstream pipes to regulate pressure and water level. The complete flow system is depicted in Figure 1, and the geometric parameters of the pump-turbine are detailed in Table 1.
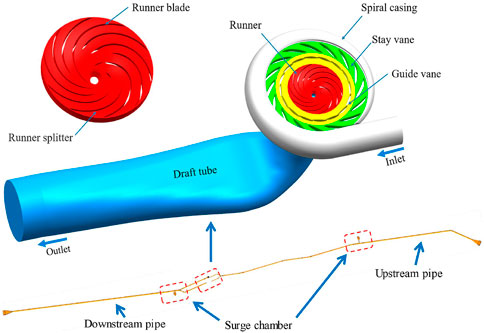
Figure 1. Calculation domain of the whole flow system.
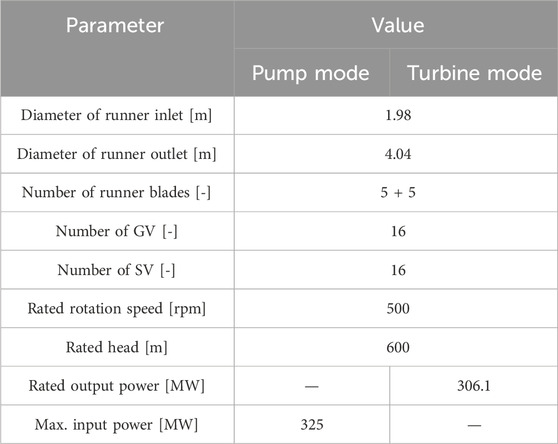
Table 1. Geometric parameters of pump-turbine.
3.2 Grid generation
The ICEM software is utilized to generate the entire flow system, with the main domain grid depicted in Figure 2. A hexahedral structured grid is employed to partition the majority of the simulation domain, encompassing the SC, runner, SV, draft tube, and long-distance pipes. Additionally, the hub grid of the GV adopts a triangular structure to fulfill the dynamic grid function requirements, followed by the stretching of volumetric grid from the hub grid. The grid number and quality are detailed in Table 2.
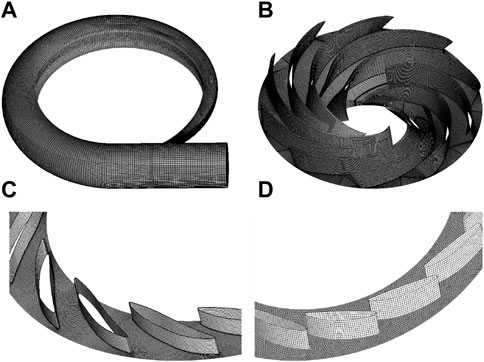
Figure 2. Grids of pump-turbine, (A) SC, (B) runner, (C) SV, (D) GV.
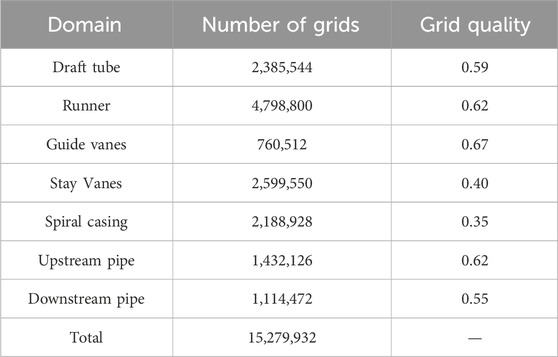
Table 2. Grid information of the whole flow system.
3.3 Grid independence verification
This article employs the Richardson extrapolation method to validate grid independence and utilizes the Grid Convergence Index (GCI) to quantitatively ascertain the convergence of computational results. The GCI can be calculated using Eqs 11-16: (Kan et al., 2021b):
Where Fs is the safety factor, typically 1.25, ea is the relative error of the two sets of grid numerical value
Three groups of grid plans are selected, G1: 15,270,000, G2: 12,260,000, and G3: 8,670,000. The partitioning strategy for all three groups of grids remains consistent, featuring a progressively decreasing number and scale of grids. Flow rate Q (m3/s) and efficiency η (%) of the total flow system are chosen as variables for convergence analysis. Steady simulations are conducted for all three groups under the rated pump condition with 10 degrees of GV. The calculations reveal that the Grid Convergence Index GCIs values for Q and η in grid independence verification were less than 3.0% when the grid number was 15,270,000. This indicates that the grid number of G3 meets the requirements of computational accuracy. Details of the grid independence verification are presented in Table 3.
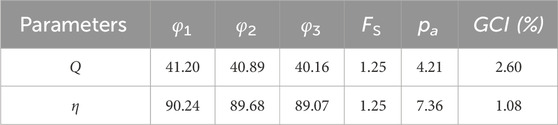
Table 3. Grid independence verification.
3.4 Rotation setting of GV and runner
The transient simulation is conducted using ANSYS-Fluent software, with pressure boundary conditions applied at both the inlet and outlet of the entire flow system. The SIMPLEC algorithm is employed to decouple the parameters of pressure and velocity. The second-order upwind scheme is utilized for discretizing the convective and diffusive terms. The wall condition is set to no-slip wall, and the root mean square residuals are set to 10-5. In this study, a user-defined function (UDF) is introduced to control the rotation speed of GV and runner. Figure 3 illustrates the variation in the relative opening of GV during the transition from pump condition to turbine condition. The actual angle of GV corresponding to 100% relative opening value is 24.6°. To facilitate subsequent analysis, the transition process is divided into five stages based on the variation of GV relative opening: Stage one, the relative opening of GV is maintained at 84.7% under pump condition. Stage two, the relative opening of GV continues to decline until reaching zero. Stage three, the relative opening of GV is maintained at zero. Stage four, the relative opening of GV increases intermittently in a stepped pattern. Stage five, the relative opening of GV is maintained at 20.8% under turbine condition. To mitigate potential accuracy issues stemming from a zero GV angle, the relative opening of GV in stage three is set to 2.5%. During stages one and two, the runner speed is set to the rated pump speed of 500 rpm. Two seconds later in stage three (51.0 s later), the motor circuit is disconnected, and the runner speed is calculated in real-time using the torque balance equation as follows, which can be expressed as to Eq. 17: (Chen et al., 2021):
where J is the total unit moment of inertia (N·m), n is the rotational speed (rpm), M is the actual torque of the runner (N·m). The mechanical friction torque and the rotor wind resistance torque are not considered in the total torque. Then, the rotational speed of every time step is obtained by using Eq. 18: (Chen et al., 2021):
where Δt is the time step (s).
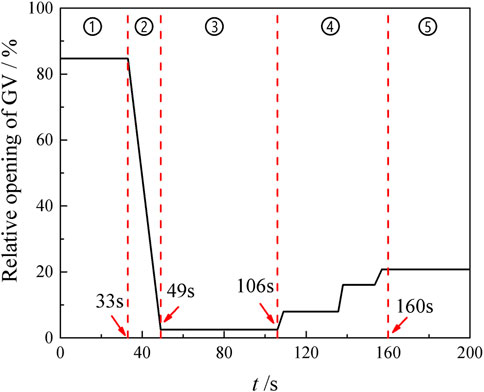
Figure 3. The variation law of relative opening of GV.
4 Results and analysis
4.1 Experimental test and validation
The model pump-turbine underwent testing on a general hydraulic-mechanical test rig, as depicted in Figure 4. In addition, the model pump-turbine was equipped with instruments and sensors required to perform the model test according to IEC 60193. Prior to the energy test, the model pump operated at rated operating conditions for over 30 min to purge free gases from the system. During this period, the bearings, seals, noise, and vibration of the pump device were inspected to ensure the normal operation of the testing equipment. The parameters of measuring instruments on the test stand are detailed in Table 4.
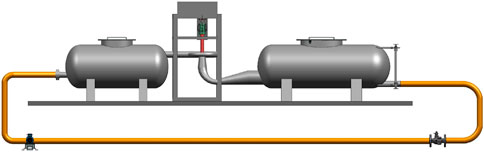
Figure 4. General test bench of reaction turbine.
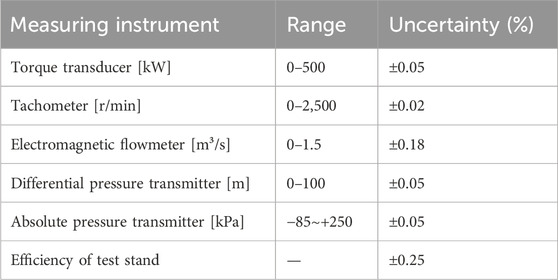
Table 4. Parameters of measuring instruments on the test stand.
Figure 5 illustrates a comparison between numerical simulation and experimental results for the speed factor nED, flow rate factor QED, and torque factor MED of the pump-turbine under pump conditions. These characteristic parameters can be described as Eqs 19-21: (Xu et al., 2024):
where D1 is the diameter of runner inlet (m), H is the head (m), g is gravity acceleration (m/s2).
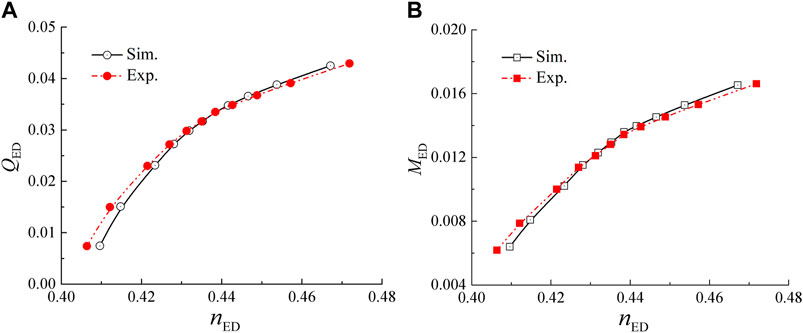
Figure 5. Comparison of simulations and experimental data, (A) QED, (B) MED.
From Figure 5, it is evident that the variation trend of the experimental curve aligns closely with the simulation curve, indicating that QED and MED increase with nED. Moreover, the simulated results exhibit a slight elevation compared to the experiments when nED exceeds 0.44. Conversely, the simulated results are marginally lower than the experiments when nED is below 0.44. Overall, the maximum errors for QED and MED are 2.7% and 2.2%, respectively, affirming the accuracy of the numerical simulation. The above errors may be caused by subtle geometric differences between the simulation model and the physical testing model, including blade tip clearances that were overlooked during the simulation process.
4.2 External characteristic analysis
Figure 6 illustrates the variation curves of key external characteristic parameters during the transient transition process, including flow rate (Q), relative rotation speed (n/n0), torque (M), and axial force (Fa), where n0 represents the initial pump speed, i.e. 500 rpm. Throughout the simulation of the whole transition process, the water level difference between upstream and downstream remains unchanged, namely, 600 m.
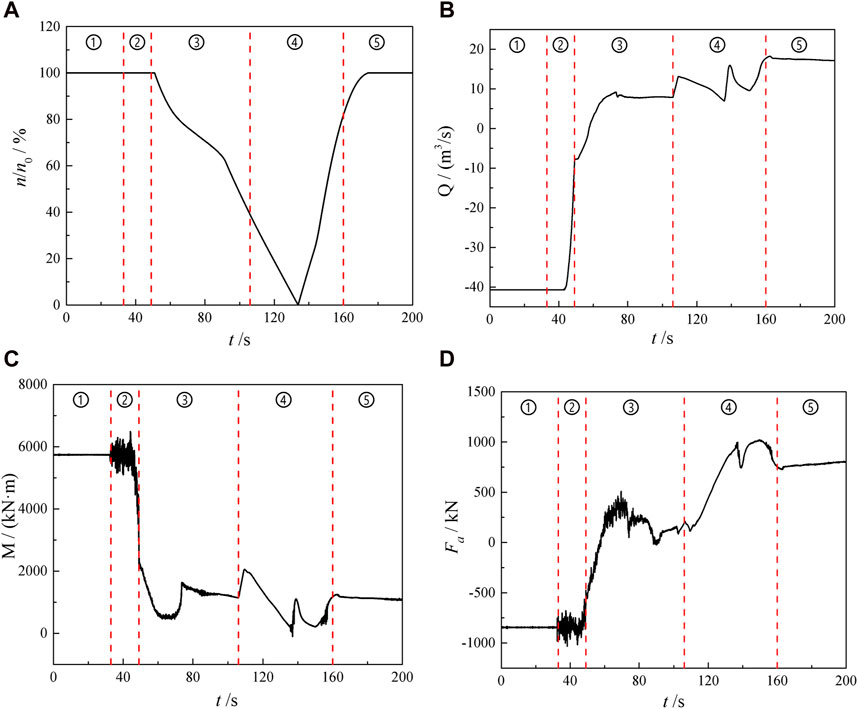
Figure 6. The variation curves of the external characteristics during transient transition process, (A) n/n0, (B) Q, (C) M, (D) Fa.
In Figure 6A, the variation of n/n0 during the transient process is clearly illustrated. Initially, the runner operates at the rated pump speed in stages one and two. Subsequently, the relative rotational speed of the runner rapidly declines until n/n0 = 0 at t = 133.8 s, signifying the point at which the torque can no longer sustain the runner at the rated speed. Following this, the unit rotor begins to reverse, causing the relative speed of the runner to sharply climb until n/n0 = 100% at t = 174 s. Finally, the runner speed stabilizes at the rated turbine speed after t = 174 s.
In Figure 6B, the variation of Q of the pump-turbine from pump mode to turbine mode is depicted. The change in Q is notably influenced by the movement of GV. Initially, in stage one, the pump-turbine operates under pump conditions, and Q remains constant. However, in the latter part of stage two, the decrease in the relative opening of GV leads to a rapid decline in Q. Moving into stage three, at t = 51.0 s, the external power of the pump-turbine no longer provided, the rotational speed of the runner is calculated in real-time using the torque balance equation, further reducing Q inside the unit. Subsequently, the instantaneous flow rate inside the unit drops to zero at t = 57.54 s, following which flow rate begins to flow in the opposite direction, corresponding to the turbine operation condition. In stage four, the three increases in the relative opening of GV lead to a rapid increase in Q. Conversely, when GV stops rotating, Q decreases to varying degrees. Finally, in stage five, the unit enters the turbine state, and Q remains unchanged.
The changes in M and Fa of the pump-turbine during the transient process are displayed in Figures 6C, D. Overall, the variations in M and Fa are jointly affected by the flow rate and GV of the unit. In stage one, M and Fa remain constant under pump conditions. However, in stage two, the severe fluctuations in M and Fa arise from the continuous rotation of GV. In the early period of stage three, M and Fa drop remarkably under the influence of low flow rate, indicating that the continuously decreasing Q reduces the driving force of water flow on the impeller. In stage four, the increase in Q caused by GV movement results in a rapid increase in M and a clear decrease in Fa, while the decrease in Q leads to a decrease in M and an increase in Fa. Finally, in stage five, as the pump-turbine transitions into turbine operation, the parameters of M and Fa no longer change.
4.3 Pressure pulsation analysis
To comprehensively investigate the static pressure evolution of the pump-turbine during the transition from pump mode to power generation mode, six monitoring points are strategically placed within the unit section, as depicted in Figure 7. These monitoring points serve to capture the pressure variations at key locations within the system. Beginning with P1, situated in the SC domain adjacent to the upstream pipeline, the monitoring points progress to P2 in the SV domain near the tongue. Moving downstream, P3 is positioned in the bladeless area between the GV and runner regions, followed by P4 located within the runner domain near the bladeless area. Further downstream, P5 is placed in the draft tube area near the runner, while P6 is situated in the middle of the draft tube area. This distribution allows for a comprehensive analysis of the static pressure changes throughout the pump-turbine unit during its operational transition.
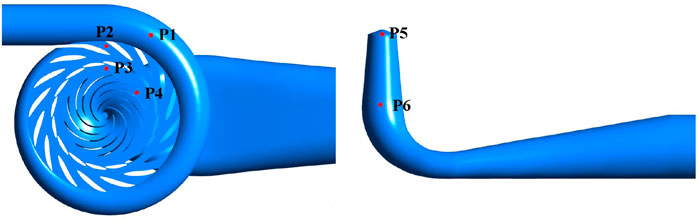
Figure 7. Pressure monitoring points in pump-turbine.
Figure 8 plots the static pressure curves of each monitoring point in pump-turbine during the conversion process. In accordance with Figure 8A, the static pressure in SC domain remains stable around 7000 kPa throughout the whole process, which is the static pressure difference between the SC domain and the free surface of the upstream pressure chamber. In stage one, the pressure is stabilized under pump condition, and the pressure pulsation amplitude is small. In stage two, the static pressure sharply declines with strong pulsation, which is attributed to the closure of GV. In stage three, the relative opening of GV remains unchanged, causing the average pressure in SC area to remain almost constant. Meanwhile, the amplitude of pressure pulsation is significantly higher than that in stage one, due to the low relative opening (2.5%) of GV. In stage four, the sudden rotation of GV causes a sudden drop in static pressure, which is quickly restored when the rotation is over. In stage five, the pressure is also stabilized under turbine condition.
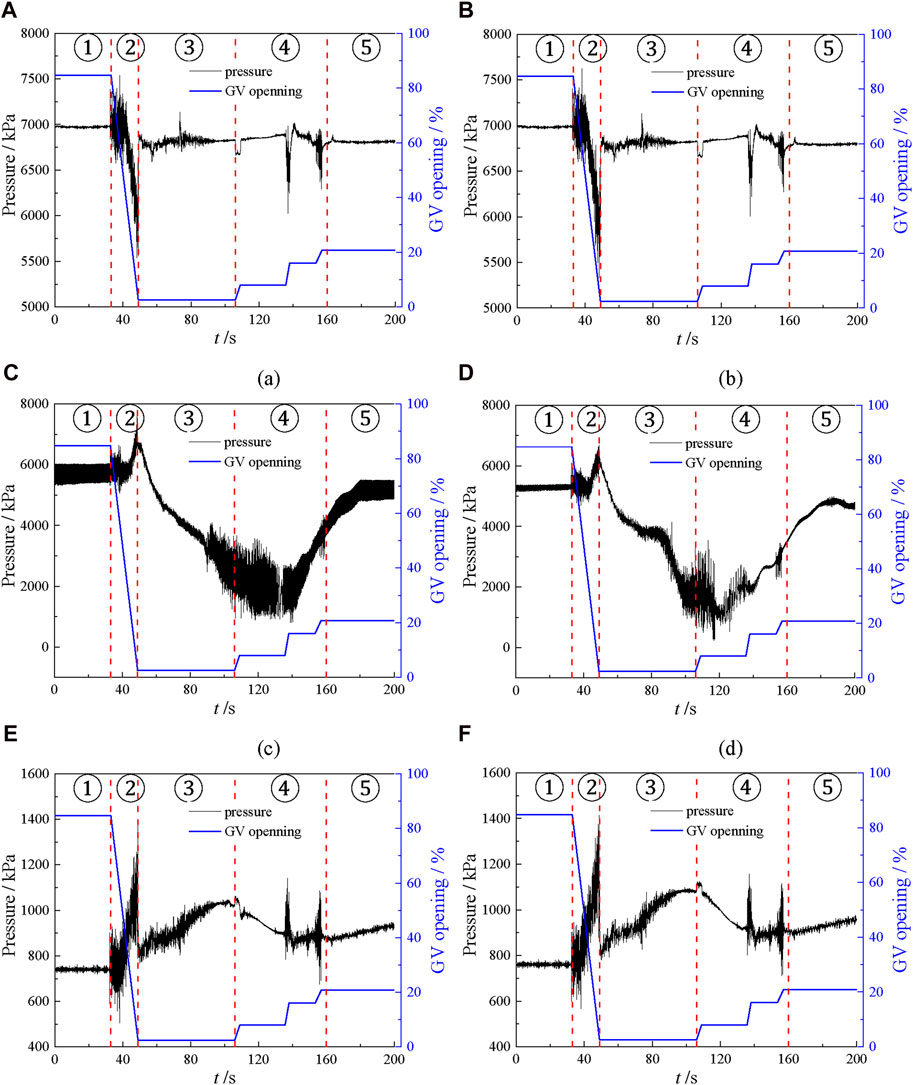
Figure 8. Static pressure curves of pump-turbine during the transient transition process, (A) P1, (B) P2, (C) P3, (D) P4, (E) P5, (F) P6.
The comparison between Figures 8A, B highlights the consistency in pressure evolutions at P2 and P1, suggesting a strong correlation of pressure between the SC and SV domains. However, the degree of pressure reduction at P2 during stage two surpasses that at P1, indicating a greater influence of GV rotation on the pressure field in the SV domain compared to the SC domain.
Figure 8C depicts the static pressure curve at P3, it’s evident that during stage one, the amplitude of pressure pulsation at P3 surpasses that of P1 and P2, indicating a more pronounced pressure pulsation in the runner domain under pump conditions. As stage two progresses, the pressure continues to rise until peaking at 49 s, signifying the closure of GV resulting in increased pressure in the bladeless zone. Subsequently, during stages three and four, pressure values in the bladeless region exhibit a continual decrease before t = 133.8 s, followed by a gradual increase, aligning with the rotation speed curve trend.
The comparison of pressure at P3 and P4 (depicted in Figures 8C, D) reveals relatively similar static pressure curves between the runner and bladeless regions. Notably, during the changed-rotation period (from t = 90 to t = 150 s), the amplitudes of pressure pulsation at both P3 and P4 are notably higher compared to other monitoring points. This observation suggests that the oscillation of the pressure field in the bladeless and runner domains is particularly influenced by the impeller speed. Moreover, a comparison between the amplitude of pressure pulsation at P3 and P4 during the changed-rotation period highlights an interesting disparity. Specifically, the amplitude of pressure pulsation at P3 is notably higher than that observed at P4, indicating a higher level of chaos in the pressure field within the bladeless region during transient processes.
The pressure evolution at P5 and P6 within the draft tube domain is illustrated in Figures 8E, F. During stage two, a notable increase in static pressure is observed alongside intense pressure pulsation, indicating that the closure of GV amplifies the intensity of pressure pulsation within the draft tube domain. Subsequently, in stages three and four, the pressure gradually increases and then decreases. Additionally, during the changed-rotation period, the pressure pulsation amplitude notably decreases compared to stage two, suggesting that the pressure field within the draft tube domain is more influenced by changes in GV opening than by alterations in runner rotation direction. Conversely, a comparison of the pressure curves at P6 and P5 reveals that the overall pressure value at P6 is only slightly higher. This indicates that there is no significant relationship between the pressure field within the draft tube domain and the submergence depth.
4.4 Internal characteristic analysis in SC, SV, and GV
To further explore the underlying factors driving changes in the external characteristics of the pump-turbine during its transient process, we delve into the evolution of its internal characteristics. Six key moments are carefully selected for analysis across the five distinct stages. At t = 20 s in stage one, the unit operates under its initial pump condition, with the GV relative opening at 84.7%. As we progress to t = 41 s in stage two, the GV begins its closing process, leading to a relative opening of 44.7%. By t = 49 s, the GV’s relative opening reaches its lowest value, plummeting to 2.5%. Transitioning to stage three, at t = 57.54 s, the instantaneous flow rate halts entirely, coinciding with the GV’s relative opening remaining at 2.5%. Moving into stage four, marked by t = 133.8 s, the transient rotational speed hits zero, while the GV’s relative opening stands at 8%. Finally, at t = 200 s in stage five, the unit operates under the rated turbine condition, with the GV’s relative opening at 20.8%.
Guide vanes (GV) is the closest rotating component to both the stay vanes (SV) and the spiral casing (SC), it exerts the most significant influence on their behavior. Notably, severe pressure fluctuations observed in both SC and SV are attributed to the rotation of the GV, indicating a direct correlation between GV movement and changes in pressure distribution within these domains. Figure 9 illustrates the pressure distribution on the horizontal plane across the SC, SV, and GV domains at various characteristic times. This visualization aids in comparing pressure distributions across different time points, allowing for a deeper understanding of the system’s behavior. Additionally, to facilitate comparison, the pressure is converted into the dimensionless pressure coefficient Cp in Eq. 22.
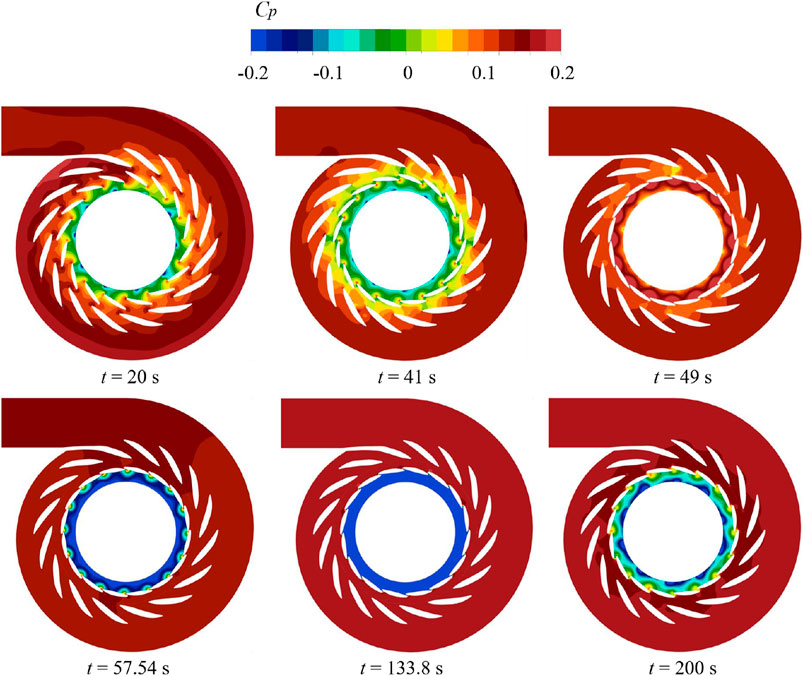
Figure 9. Cp distribution on the horizontal plane in the domains of SC, SV and GV at different characteristic time.
It can be observed from Figure 9 that Cp values in SV and SC regions remain relatively constant throughout the five stages, aligning with the pressure curve depicted in Figures 8A, B. At t = 20 s, Cp gradually rises along the flow direction under the initial pump condition, exhibiting a centrally symmetric distribution. By t = 41 s, there is a noticeable increase in the high-pressure accumulation point at the trailing edge of GV, indicating the heightened impact of water flow on this region due to GV movement. Subsequently, at t = 49 s, Cp values on both sides of GV experience a sudden surge, attributed to the continued impact of flow from the bladeless area on GV when it is closed. However, by t = 57.54 s, Cp in the bladeless area shows a significant decrease, accompanied by a notable pressure gradient change at the GV gap. This trend continues at t = 133.8 s, where Cp in the bladeless area declines once more, consistent with the pressure evolution at P3 in the bladeless area shown in Figure 8C. Finally, at t = 200 s, Cp in the bladeless area experiences a substantial increase under turbine conditions.
According to the mass conservation equation, pressure and velocity in simulated domains are interconnected, highlighting the need to analyze velocity across the five stages for a comprehensive understanding of external characteristic evolutions. Figure 10 showcases velocity streamlines on the horizontal plane in the domains of SC, SV, and GV at various characteristic times, mirroring the flow evolution in Figure 6B. Initially, at t = 20 s, the flow within the unit appears smooth, with an overall high velocity. As time progresses to t = 41 s, the movement of GV reduces the spacing between GVs, thereby boosting flow velocity in the area. By t = 49 s, water flow is impeded by GV closure, leading to significant backflow in the SV domain. Concurrently, the runner maintains its rated speed, resulting in a faster loop for flow in the bladeless area. Subsequently, at t = 57.54 s, the backflow from the SV domain extends to the SC domain, further diminishing flow velocity within SC. At t = 133.8 s, a notable pressure difference on both sides of GVs aids in the smooth recovery of flow velocity within the unit. Finally, at t = 200 s, velocity within the SC domain sees a further increase, indicating a rise in flow rate with GV opening.
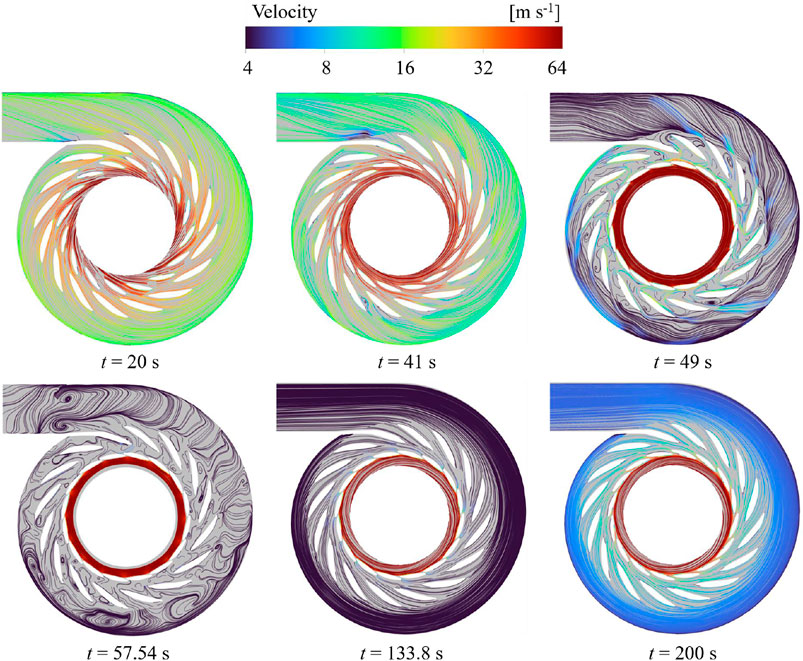
Figure 10. Velocity streamlines on the horizontal plane in the domains of SC, SV, and GV at different characteristic time.
According to the entropy production theory, energy loss correlates strongly with velocity gradient and turbulent kinetic energy, indicating that turbulent water flow results in substantial energy loss. Consequently, conducting a comprehensive three-dimensional visualization analysis of the energy loss of the pump-turbine can significantly enhance understanding of the flow state evolution. Figure 11 illustrates the EPR distribution on the horizontal plane in the domains of SC, SV, and GV at different characteristic times. Initially, at t = 20 s, EPR values in the GV and SV domains are notably high, attributed to their status as outflow components under the initial pump condition, characterized by turbulent flow and significant energy loss. By t = 41 s, the EPR value within the SV domain shows a slight increase, potentially linked to pressure pulsations observed in stage two of Figure 8B. At t = 49 s, EPR values in the SV domain and bladeless region remain relatively high due to reflux and high-speed loop effects, respectively. However, at t = 57.54 s, despite a more turbulent flow state in the SV domain, the EPR value is notably low. This is attributed to the transient zero flow rate, leading to reduced velocity gradient and subsequently lower energy loss. Subsequently, at t = 133.8 s and t = 200 s, EPR values within the SV and SC domains are relatively low, as these domains represent inflow components with improved flow patterns, resulting in reduced energy loss.
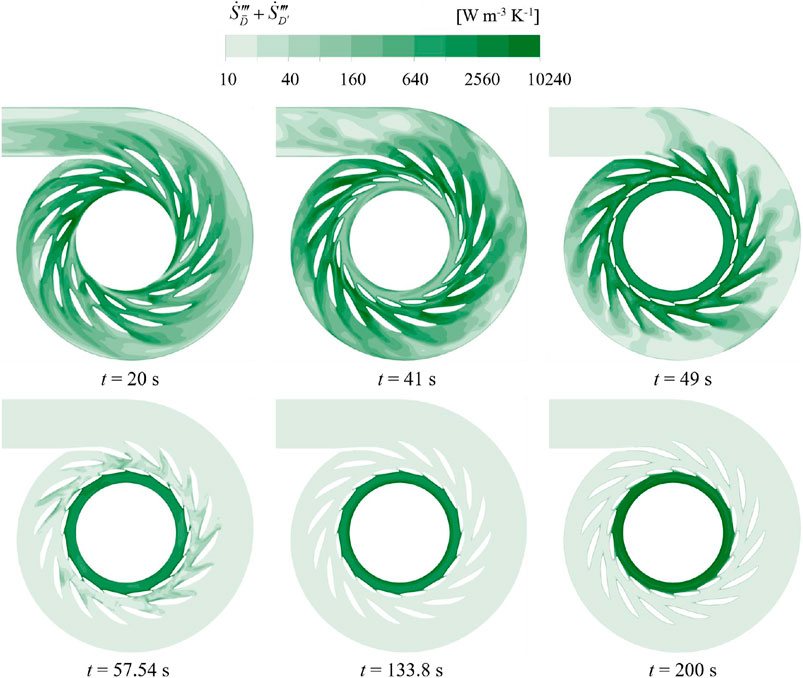
Figure 11. EPR distribution on the horizontal plane in the domains of SC, SV, and GV at different characteristic time.
4.5 Internal characteristic analysis in runner
As a vital component of the pump-turbine system, delving into the internal dynamics of the runner is crucial. Not only does it influence the torque and axial force of the pump-turbine, but it also significantly impacts the operational stability and efficiency of the entire unit. Moreover, the intricate flow patterns within the runner have profound implications for other computational domains, thereby shaping the overall performance and reliability of the hydraulic system.
Figure 12 vividly illustrates the distribution of pressure coefficients (Cp) across the middle span of the runner at different stages of the transient process. At t = 20 s, a notable pressure differential between the pressure surface (PS) and the suction surface (SS) is evident, with Cp showing a symmetrical distribution. Transitioning to t = 41 s, there is minimal change in Cp distribution, indicating that the rotation of the guide vanes (GV) under pump conditions has a marginal impact on pressure dynamics within the runner. However, at t = 49 s, a significant reduction in the pressure differential between PS and SS is observed, directly affecting the torque and axial force during stage two of the transient process. By t = 57.54 s, Cp values decrease markedly on either side of the blade, signaling a decrease in the pushing force on the runner. This trend continues at t = 133.8 s, where Cp in the runner declines again, aligning with the pressure evolution observed in Figure 8D. Ultimately, at t = 200 s, stable pressure distribution across PS and SS indicates continued rotation of the runner for power generation, ensuring sustained efficiency and performance.
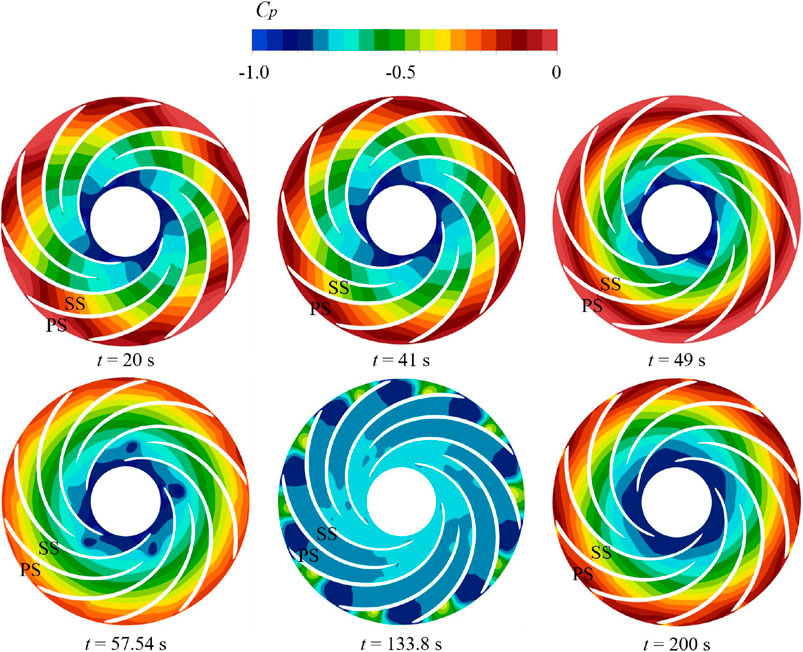
Figure 12. Cp distribution on the surface of middle span in runner at different characteristic time.
Figure 13, depicts the velocity streamlines across the middle span of the runner at different characteristic time, a dynamic narrative unfolds. At t = 20 s, the streamlines exhibit smooth, uniform flow patterns, indicative of stable conditions within the runner. However, by t = 41 s, the velocity increases with the diameter of the runner, reflecting the influence of GV rotation on internal flow dynamics. At t = 49 s, turbulent flow emerges within the runner, highlighting its sensitivity to GV closure and its impact on operational stability. Subsequently, at t = 57.54 s, backflow within the runner intensifies, signaling increased turbulence within the system and the associated energy losses. Remarkably, at t = 133.8 s, the flow near the draft tube begins to stabilize, marking a transition towards turbine mode. Interestingly, the reflux zone shifts towards the bladeless area, aligning with low-pressure regions and indicating the complex interplay of flow dynamics within the runner. Finally, at t = 200 s, flow patterns return to a smooth state, indicating stable turbine operation and optimized performance.
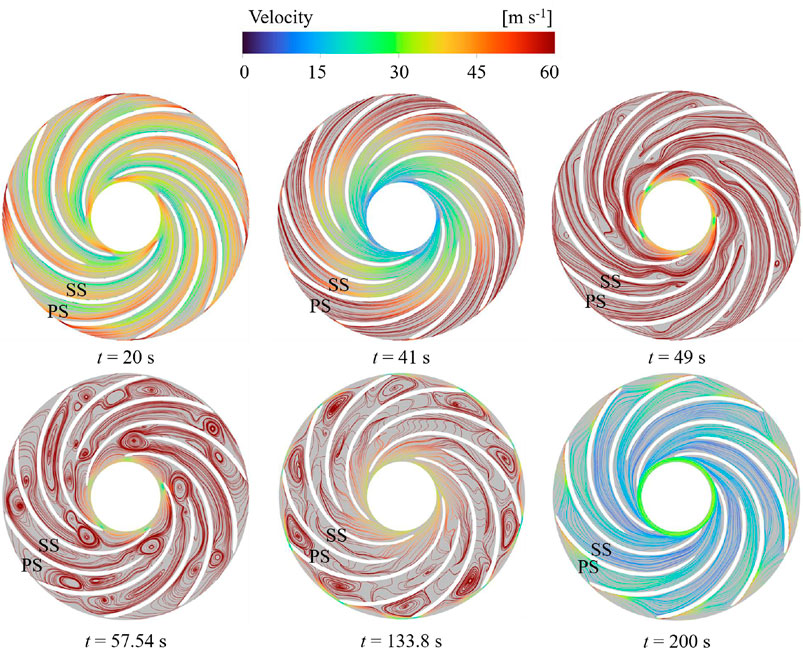
Figure 13. Velocity streamlines on the surface of middle span in runner at different characteristic time.
Figure 14 unveils the distribution of entropy production rate (EPR) across the runner’s middle span at various stages. At t = 20 s and t = 41 s, low EPR values within the runner signify minimal energy loss owing to smooth flow conditions. However, by t = 49 s, elevated EPR values near the bladeless area indicate increased energy loss due to GV closure and turbulent flow phenomena. The situation intensifies at t = 57.54 s, with high EPR values near the draft tube corresponding to significant energy loss from reflux and turbulence. Similarly, at t = 133.8 s, heightened EPR values near the bladeless zone underscore the correlation between energy loss and flow dynamics during the transient process. Notably, at t = 200 s, increased EPR values near the bladeless area highlight the impact of flow from the GV domain on runner blades under turbine conditions, emphasizing the need for optimal design and operational strategies to minimize energy losses and enhance overall system efficiency.
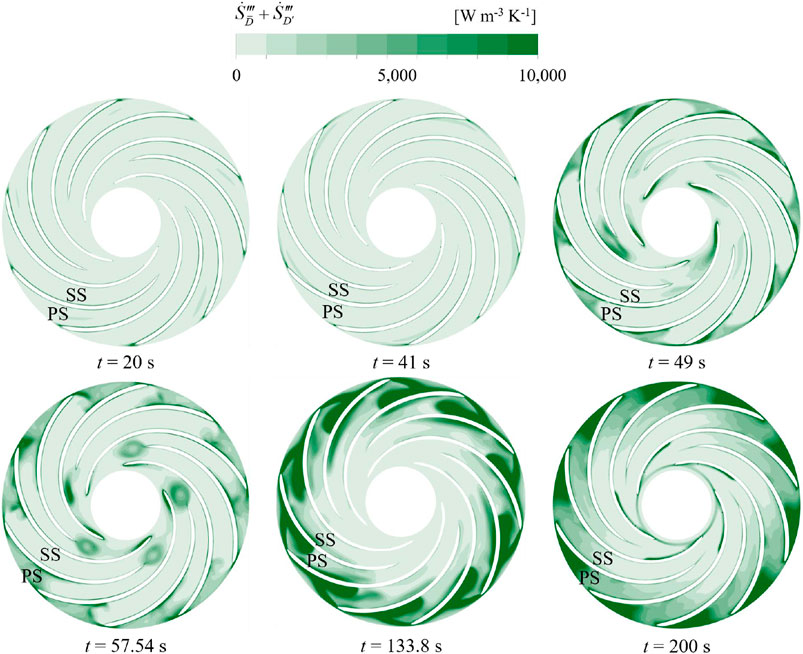
Figure 14. EPR distribution on the surface of middle span in runner at different characteristic time.
5 Conclusion
This paper has meticulously explored the transient process from pump to turbine conditions within the entirety of the flow system, encompassing both the pump-turbine and the extensive network of long-distance pipes, through the application of the torque balance equation. Our validation of the steady simulation has been solidified by experimental testing, and the Maximum errors between the test and numerical data are both less than 3.0%, which falls well within acceptable limits. Furthermore, we have delved into the intricate relationship between pressure, flow state, and energy dissipation within the unit, employing the principles of entropy generation theory, and have provided insights into the evolution of external characteristics via the dynamics of internal processes. The transition from pump to turbine mode in the pump-turbine has been dissected into five distinct stages: in stage one, the relative opening of the guide vanes (GV) remains steadfast at 84.7%; this diminishes to 2.5% in stage two, maintains at 2.5% through stage three, experiences a gradual increase to 20.8% in stage four, and finally, stabilizes at 20.8% in stage five. From these comprehensive analyses, several pivotal conclusions have emerged:
(1) The GV movement significantly affects the flow rate. Specifically, the flow rate decreases during stage two due to GV closure and increases during stage four due to GV opening. The flow rate and GV movement influence both torque and axial force. Severe fluctuations arise from GV rotation, and the increase in flow rate during stage four results in a rapid increase in torque and a clear decrease in axial force.
(2) The change in static pressure is primarily influenced by the GV movement and the runner’s speed. Additionally, the rotation of the GV amplifies the intensity of pressure pulsations at different monitoring points within the unit. On the other hand, the pressure in the bladeless zone and the runner zone is more sensitive to the rotation speed. Specifically, static pressure decreases with increasing rotation speed and subsequently rises as the rotation speed recovers. Moreover, the amplitudes of pressure pulsations during the rotation period change significantly.
(3) In stage two, the closure of the GV results in a decrease in pressure in the SC and SV domains and an increase in pressure in the bladeless zone, runner, and draft tube domains. Additionally, the pressure difference between PS and SS notably decreases, which directly causes a drop in torque and axial force.
(4) In stage three, the GV interrupts the flow within the unit, leading to significant backflow in the SC, SV, and runner domains, accompanied by high-speed circulation in the bladeless area. Furthermore, the high EPR value within the unit corresponds to the reflux zone, indicating substantial energy loss due to reflux.
(5) In stage one and stage five, the flow regime within the pump-turbine is optimal, characterized by smooth velocity streamlines and centrosymmetric pressure distribution. Moreover, most energy loss is concentrated in the outflow components, such as the SC and SV in pump condition, the bladeless area, and the runner in turbine condition.
Data availability statement
The original contributions presented in the study are included in the article/Supplementary Material, further inquiries can be directed to the corresponding author.
Author contributions
ZM: Conceptualization, Validation, Writing–original draft. ZX: Formal Analysis, Investigation, Methodology, Writing–original draft. ZG: Conceptualization, Funding acquisition, Resources, Writing–review and editing. WH: Validation, Writing–original draft. YiZ: Writing–original draft. FZ: Methodology, Writing–original draft. LX: Data curation, Software, Writing–original draft. YuZ: Project administration, Validation, Visualization, Writing–review and editing. KK: Supervision, Writing–review and editing.
Funding
The author(s) declare that financial support was received for the research, authorship, and/or publication of this article. This work was supported by the Science and Technology Project of State Grid Xinyuan Co., Ltd. (Grant No. SGXYKJ-2022-044).
Acknowledgments
The authors are also grateful for the support of Hohai University.
Conflict of interest
Authors ZM, ZG, WH, YiZ, and FZ were employed by Pumped Storage Technological and Economic Research Institute of State Grid Xinyuan Co., Ltd.
The remaining authors declare that the research was conducted in the absence of any commercial or financial relationships that could be construed as a potential conflict of interest.
The authors declare that this study received funding from the Science and Technology Project of State Grid Xinyuan Co., LTD. (No. SGXYKJ-2022-044). The funder had the following involvement in the study: resources, data collection and analysis, software and methodology.
Publisher’s note
All claims expressed in this article are solely those of the authors and do not necessarily represent those of their affiliated organizations, or those of the publisher, the editors and the reviewers. Any product that may be evaluated in this article, or claim that may be made by its manufacturer, is not guaranteed or endorsed by the publisher.
References
Abu-Hijleh, B. A., Abu-Qudais, M., and Abu Nada, E. (1999). Numerical prediction of entropy generation due to natural convection from a horizontal cylinder. Energy 24 (4), 327–333. doi:10.1016/s0360-5442(98)00103-0
Abu-Hijleh, B. A. K., and Heilen, W. N. (1999). Entropy generation due to laminar natural convection over a heated rotating cylinder. Int. J. Heat Mass Transf. 42 (22), 4225–4233. doi:10.1016/s0017-9310(99)00078-2
Afshar, M. H., Rohani, M., and Taheri, R. (2010). Simulation of transient flow in pipeline systems due to load rejection and load acceptance by hydroelectric power plants. Int. J. Mech. Sci. 52 (1), 103–115. doi:10.1016/j.ijmecsci.2009.10.014
Cao, Z., Xia, Q., Guo, X., Lu, L., and Deng, J. (2022). A novel surge damping method for hydraulic transients with operating pump using an optimized valve control strategy. Water 14 (10), 1576. doi:10.3390/w14101576
Chen, H., Zhou, D., Kan, K., Guo, J., Zheng, Y., Binama, M., et al. (2021). Transient characteristics during the co-closing guide vanes and runner blades of a bulb turbine in load rejection process. Renew. Energy 165, 28–41. doi:10.1016/j.renene.2020.11.064
Cui, L., Qiao, F., Li, M., Xiao, Y., and Cheng, J. (2022). Study on the effect of fracturing pump start and stop on tubing fluid-structure interaction vibration in HPHT wells via MOC. Energies 15 (24), 9291. doi:10.3390/en15249291
Elaoud, S., and Hadj-Taïeb, E. (2011). Influence of pump starting times on transient flows in pipes. Nucl. Eng. Des. 241 (9), 3624–3631. doi:10.1016/j.nucengdes.2011.07.039
Feng, J. J., Li, W. F., Luo, X. Q., and Zhu, G. J. (2019). Numerical analysis of transient characteristics of a bulb hydraulic turbine during runaway transient process. Proc. Institution Mech. Eng. Part E-Journal Process Mech. Eng. 233 (4), 813–823. doi:10.1177/0954408918811548
Herwig, H., and Kock, F. (2007). Direct and indirect methods of calculating entropy generation rates in turbulent convective heat transfer problems. Heat Mass Transf. 43 (3), 207–215. doi:10.1007/s00231-006-0086-x
Jin, F., Luo, Y., Wang, H., Wang, Z., Lin, K., Lei, X., et al. (2023). Dynamic response of a pump-turbine runner during turbine's mode starting up. J. Energy Storage 74, 109339. doi:10.1016/j.est.2023.109339
Kan, K., Binama, M., Chen, H., Zheng, Y., Zhou, D., Su, W., et al. (2022a). Pump as turbine cavitation performance for both conventional and reverse operating modes: a review. Renew. Sustain. Energy Rev. 168, 112786. doi:10.1016/j.rser.2022.112786
Kan, K., Chen, H., Zheng, Y., Zhou, D., Binama, M., and Dai, J. (2021a). Transient characteristics during power-off process in a shaft extension tubular pump by using a suitable numerical model. Renew. Energy 164, 109–121. doi:10.1016/j.renene.2020.09.001
Kan, K., Xu, Z., Chen, H., Xu, H., Zheng, Y., Zhou, D., et al. (2022b). Energy loss mechanisms of transition from pump mode to turbine mode of an axial-flow pump under bidirectional conditions. Energy 257, 124630. doi:10.1016/j.energy.2022.124630
Kan, K., Yang, Z., Lyu, P., Zheng, Y., and Shen, L. (2021b). Numerical study of turbulent flow past a rotating axial-flow pump based on a level-set immersed boundary method. Renew. Energy 168, 960–971. doi:10.1016/j.renene.2020.12.103
Kan, K., Zhang, Q., Xu, Z., Zheng, Y., Gao, Q., and Shen, L. (2022c). Energy loss mechanism due to tip leakage flow of axial flow pump as turbine under various operating conditions. Energy 255, 124532. doi:10.1016/j.energy.2022.124532
Kock, F., and Herwig, H. (2004). Local entropy production in turbulent shear flows: a high-Reynolds number model with wall functions. Int. J. Heat Mass Transf. 47 (10-11), 2205–2215. doi:10.1016/j.ijheatmasstransfer.2003.11.025
Li, P., Lu, J., Tao, R., Xiao, R., Ji, B., and Wang, F. (2024a). Energy distribution and chaotic pressure pulsation analysis of vortex ropes in Francis-99. Eng. Appl. Comput. Fluid Mech. 18 (1). doi:10.1080/19942060.2024.2310609
Li, W., Long, Y., Ji, L., Li, H., Li, S., Chen, Y., et al. (2024b). Effect of circumferential spokes on the rotating stall flow field of mixed-flow pump. Energy 290, 130260. doi:10.1016/j.energy.2024.130260
Lin, T., Zhu, Z., Li, X., Li, J., and Lin, Y. (2021). Theoretical, experimental, and numerical methods to predict the best efficiency point of centrifugal pump as turbine. Renew. Energy 168 (5), 31–44. doi:10.1016/j.renene.2020.12.040
Liu, D., Li, Z., Xu, L., Li, J., Yang, Y., Wang, X., et al. (2024). Vortex motion in vaneless space and runner passage of pump-turbine in S-shaped region. Phys. Fluids 36 (2). doi:10.1063/5.0194239
Lu, M., Liu, X., Xu, G., and Tian, Y. (2024). Optimal pump-valve coupling operation strategy of complex long-distance water-conveyance systems based on MOC. Ain Shams Eng. J. 15 (1), 102318. doi:10.1016/j.asej.2023.102318
Mahfoud, R. J., Alkayem, N. F., Zhang, Y., Zheng, Y., Sun, Y., and Alhelou, H. H. (2023). Optimal operation of pumped hydro storage-based energy systems: a compendium of current challenges and future perspectives. Renew. Sustain. Energy Rev. 178, 113267. doi:10.1016/j.rser.2023.113267
Menter, F. R. (2009). Review of the shear-stress transport turbulence model experience from an industrial perspective. Int. J. Comput. Fluid Dyn. 23 (4), 305–316. doi:10.1080/10618560902773387
Pang, S., Zhu, B., Shen, Y., and Chen, Z. (2023). Study on cavitating vortex rope characteristics of reversible pump-turbine under part load turbine condition. Phys. Fluids 35 (8). doi:10.1063/5.0160347
Rohani, M., and Afshar, M. H. (2010). Simulation of transient flow caused by pump failure: point-Implicit Method of Characteristics. Ann. Nucl. Energy 37 (12), 1742–1750. doi:10.1016/j.anucene.2010.07.004
Sun, X., Xia, G., You, W., Jia, X., Manickam, S., Tao, Y., et al. (2023). Effect of the arrangement of cavitation generation unit on the performance of an advanced rotational hydrodynamic cavitation reactor. Ultrason. Sonochem. 99, 106544. doi:10.1016/j.ultsonch.2023.106544
Sun, X., Xu, H., Xuan, X., Manickam, S., Boczkaj, G., and Wang, B. (2024). Assessing the industrialization progress of hydrodynamic cavitation process intensification technology: a review. Curr. Opin. Chem. Eng. 45, 101037. doi:10.1016/j.coche.2024.101037
Tao, R., and Wang, Z. (2021). Comparative numerical studies for the flow energy dissipation features in a pump-turbine in pump mode and turbine mode. J. Energy Storage 41, 102835. doi:10.1016/j.est.2021.102835
Wang, C., Zhang, Y., Yuan, Z., and Ji, K. (2020). Development and application of the entropy production diagnostic model to the cavitation flow of a pump-turbine in pump mode. Renew. Energy 154, 774–785. doi:10.1016/j.renene.2020.03.065
Xia, G., You, W., Manickam, S., Yoon, J. Y., Xuan, X., and Sun, X. (2024). Numerical simulation of cavitation-vortex interaction mechanism in an advanced rotational hydrodynamic cavitation reactor. Ultrason. Sonochem. 105, 106849. doi:10.1016/j.ultsonch.2024.106849
Xu, L., Liu, D., Li, Z., Zhao, X., and Liu, X. (2022). Experimental and numerical simulation research on flow characteristics of model pump-turbine in four-quadrant operating quadrants. J. Energy Storage 54, 105083. doi:10.1016/j.est.2022.105083
Xu, L., Kan, K., Zheng, Y., Liu, D., Binama, M., Xu, Z., et al. (2024). Rotating stall mechanism of pump-turbine in hump region: an insight into vortex evolution. Energy 292, 130579. doi:10.1016/j.energy.2024.130579
Xu, Z., Zheng, Y., Kan, K., and Chen, H. (2023). Flow instability and energy performance of a coastal axial-flow pump as turbine under the influence of upstream waves. Energy 272, 127121. doi:10.1016/j.energy.2023.127121
Yu, Z. F., Yan, Y., Wang, W. Q., and Liu, X. S. (2021). Entropy production analysis for vortex rope of a Francis turbine using hybrid RANS/LES method. Int. Commun. Heat Mass Transf. 127, 105494. doi:10.1016/j.icheatmasstransfer.2021.105494
Zhang, C., Pei, J., Wang, W., Yuan, S., Gan, X., Huang, C., et al. (2023). Unsteady simulation and analysis of energy loss mechanism of a vertical volute pump under stall conditions. J. Fluids Engineering-Transactions Asme 145 (8). doi:10.1115/1.4062089
Zhang, F., Appiah, D., Hong, F., Zhang, J., Yuan, S., Adu-Poku, K. A., et al. (2020). Energy loss evaluation in a side channel pump under different wrapping angles using entropy production method. Int. Commun. Heat Mass Transf. 113, 104526. doi:10.1016/j.icheatmasstransfer.2020.104526
Zhao, Y., Li, D., Chang, H., Fu, X., Wang, H., and Qin, D. (2023). Suppression effect of bionic guide vanes with different parameters on the hump characteristics of pump-turbines based on entropy production theory. Energy 283, 128650. doi:10.1016/j.energy.2023.128650
Keywords: pump-turbine, transition process, entropy production, guide vanes rotation, pressure evolution
Citation: Man Z, Xu Z, Gui Z, Han W, Zhao Y, Zhang F, Xu L, Zheng Y and Kan K (2024) Research on the performance of pump-turbine during the transition process from pump mode to turbine mode. Front. Energy Res. 12:1421865. doi: 10.3389/fenrg.2024.1421865
Received: 23 April 2024; Accepted: 08 July 2024;
Published: 01 August 2024.
Edited by:
Angelo Maiorino, University of Salerno, ItalyReviewed by:
Guojun Zhu, Xi’an University of Technology, ChinaClaudio Cilenti, University of Salerno, Italy
Copyright © 2024 Man, Xu, Gui, Han, Zhao, Zhang, Xu, Zheng and Kan. This is an open-access article distributed under the terms of the Creative Commons Attribution License (CC BY). The use, distribution or reproduction in other forums is permitted, provided the original author(s) and the copyright owner(s) are credited and that the original publication in this journal is cited, in accordance with accepted academic practice. No use, distribution or reproduction is permitted which does not comply with these terms.
*Correspondence: Kan Kan, a2Fua2FuQGhodS5lZHUuY24=