 Wenjia Zhang
 Zhuyi Peng
95% of researchers rate our articles as excellent or good
Learn more about the work of our research integrity team to safeguard the quality of each article we publish.
Find out more
ORIGINAL RESEARCH article
Front. Energy Res. , 08 July 2024
Sec. Energy Storage
Volume 12 - 2024 | https://doi.org/10.3389/fenrg.2024.1421277
This article is part of the Research Topic Optimization and Data-driven Approaches for Energy Storage-based Demand Response to Achieve Power System Flexibility View all 24 articles
Optimal power flow (OPF) calculation methods are important for the power system operation and mainly focus on the deterministic power flow calculation, neglecting the impact of demand response on online security calculation of power systems with renewable energy sources. Therefore, this paper proposes an OPF calculation method that considers the uncertainties of wind power, photovoltaic (PV) power generation and demand-side response. Firstly, the research focuses on the renewable energy grid, considering the uncertainties of wind power and PV power generation, and establishes uncertainty models for wind power and PV output. Secondly, based on cloud model theory, an uncertainty model for demand response is established. According to the established models, an efficient OPF model is constructed with a linearized submodels considering multiple uncertainties. By testing on the IEEE 30-bus system as a typical example, we found the effectiveness and superiority of the proposed OPF calculation method can benefit the power system economic operation and demand side resource utilization.
In recent years, the global energy crisis has become increasingly prominent, and the environmental pollution caused by the combustion of fossil fuels such as coal and oil has also attracted widespread attention (Xin et al., 2022). To address this issue, countries around the world have actively invested a large amount of funds and research personnel in renewable energy technologies to replace fossil fuels. New renewable and clean energy sectors, including wind and solar power generation, have experienced vigorous growth (Chen et al., 2020). As the proportion of wind power, PV and other renewable energy generation in power grid generation continues to increase, the inherent randomness and fluctuation of these energy sources gradually exert a growing impact on the operational state of the electric power system. Therefore, to precisely evaluate how the integration of renewable energy sources with high capacity affects the operational state of the electric power system, and to enhance the reliability and cost-effectiveness of power systems incorporating wind and PV generation, extensive research has been conducted on OPF calculation methods for electric power systems (Yang et al., 2018). Traditional deterministic power flow calculation methods are mainly used in typical scenarios where the grid structure information of the power system is fixed and the input power at each node of the power system remains basically unchanged. They are unable to accurately reflect the actual operational state of the current power grid where renewable energy sources constitute a significant portion (Pourbehzadi et al., 2019).
Currently, scholars have conducted extensive research on the OPF calculation problem for power grids containing wind power and PVs. In Refs. (Li et al., 2015; Guo et al., 2018), the uncertainty of wind power output is taken into account, and a probabilistic OPF model for wind power integration is proposed. Ref. (Li et al., 2020). introduces a prediction method for PV output that considers correlation and analyzes the OPF of PV output at different time points. Additionally, Ref. (Morshed et al., 2018). addresses the issue of correlation between the outputs of wind farms and proposes a correlation modeling method based on fuzzy C-means clustering for calculating the power flow in a distribution network that includes wind power generation. In Ref. (Yan et al., 2018), Latin Hypercube Sampling (LHS) and its improved algorithm were employed for sampling the probability distributions pertaining to wind power, photovoltaics, and other renewable energy forms, enhancing the speed and accuracy of power flow calculations. In Refs. (Liao et al., 2019; Liu et al., 2019), the linearization semi-variance approach was developed for probabilistic power flow calculations, effectively reducing the impact of uncertainty in clean energy sources like wind power and PVs on power flow calculation results.
However, existing research has not taken into account the impact of demand-side response on OPF calculation. On the load side, demand-side response has a significant influence on the optimal allocation of the power grid. By guiding users’ electricity consumption behavior through demand-side response and matching load characteristics with power generation characteristics such as wind power and PVs, it is possible to reduce the configured capacity and optimizes the overall cost-effectiveness of the power grid (Yang et al., 2022). Based on considering the uncertainty of renewable energy generation, Ref. (Zhao et al., 2018). introduced demand-side response, effectively reducing the economic cost of the system. Additionally, due to differences in user demographics, price incentives, and other factors, demand response also exhibits significant uncertainty. Ref. (Lin and Zhang, 2020). considered the impact of demand-side response on system scheduling under different incentive levels, finding that system scheduling costs decrease as incentive levels increase.
In summary, although numerous studies have been conducted on OPF calculation methods for power systems with renewable energy sources, none of them have taken into account the impact of demand-side response on the renewable energy accommodation capacity. As a result, demand-side response has not been incorporated into the OPF calculation methods. Therefore, this paper aims to develop an OPF calculation method that considers the uncertainties of wind power, PV power generation and demand-side response. The decision variables such as the output and terminal voltage of wind turbines, transformer ratio, and reactive power compensation capacity have been reasonably adjusted. This not only reduces the system operating costs while satisfying safety constraints, but also enhancing the speed and accuracy of online security calculation and analysis in power systems.
The remainder of this paper is organized as follows. Section II establishes uncertainty models for wind power and PV output. Section III constructs an uncertainty model for demand-side response. Based on the previously established uncertainty models, and Section IV establishes an OPF model and proposes a linearized method for OPF calculation considering multiple uncertainties. Section V validates the effectiveness and superiority of the proposed method using the IEEE 30-bus system as an example. Finally, Section VI presents the conclusions of this paper.
The fluctuations and intermittency of wind speed and solar irradiance pose new problems and complexities to the stable and economic dispatch of the power grid. This necessitates the use of appropriate mathematical models for accurate calculations of wind power and PV output, facilitating subsequent scenario simulations and uncertainty handling.
A wind turbine generator converts wind energy into mechanical energy by driving the rotation of its blades, and then converts this mechanical energy into electrical power. This paper employs the Weibull distribution to fit the measured wind speed data, and the resulting probability density function (PDF) of wind speed is presented as follows in Eq. 1:
Where,
The specific mathematical model expression is as follows (Xie et al., 2019) in Eq. 2:
Where,
During the operation of a wind turbine generator, only the costs associated with its operation and maintenance are taken into account, and these costs are specifically related to the output power of the turbine. The detailed expression is as follows in Eq. 3:
Where,
The working principle of PV modules is based on the photoelectric effect, and their power generation is positively correlated with the intensity of light. This paper employs the Beta distribution to fit the measured light intensity data, and the resulting PDF of light intensity is presented as follows in Eq. 4:
Where,
The expression for its output power is as follows (Zhao et al., 2022) in Eq. 5:
Where,
Similar to wind turbines, only the costs associated with the operation and maintenance of PV cells are considered during their operation. The specific expression is as follows in Eq. 6:
Where,
When utilizing scenario analysis to tackle the uncertainty inherent in wind and solar generation, it is necessary to first perform scenario simulation to obtain a large-scale scenario sample set. Meanwhile, the method of time series analysis should be employed to consider the coupling characteristics between wind and solar power output at different times. Then, scenario reduction techniques are applied to extract a few typical scenarios from the sample set to describe and characterize the power fluctuations of the entire sample set.
Utilizing Monte Carlo sampling techniques, this paper performs extensive sampling of wind and solar energy production to generate a comprehensive collection of predictive scenarios. Monte Carlo method is based on probabilistic mathematical models and uses numerical simulation experiments to describe physical geometric characteristics and geometric quantities in order to approximate solutions (Zhao et al., 2023).
For the prediction of wind and solar power output over a scheduling period T = 24h, a scenario set of size N = 1,000 is obtained through Monte Carlo sampling. The specific description is as follows in Eq. 7:
Where,
Based on the mathematical models established for wind turbines and PV modules in this section, a sample size of N = 1,000 and a scheduling period of T = 24h were chosen. The cut-in wind speed is designated as
The response level of the demand side largely depends on the price compensation strategy issued by the system operator, resulting in significant uncertainty. As shown in Figure 1, when the incentive level is below
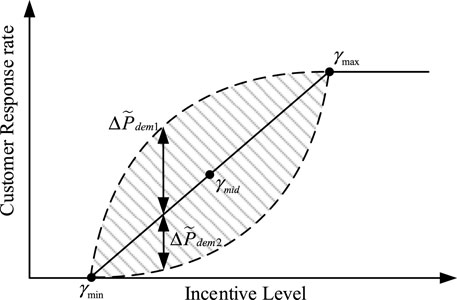
Figure 1. Demand response uncertainty curve.
In this paper, the theory of cloud model is adopted to describe the uncertainty of demand-side response. Assuming that the single response quantity
It can be seen that the demand response quantity is a random variable with expected value
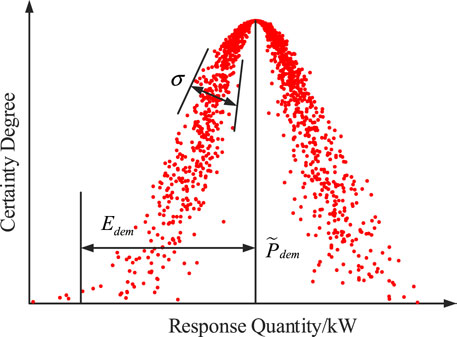
Figure 2. Demand response load distribution.
Figure 3 shows the distribution diagram of user responses for 1,000 times under four cases where the compensation price c is 0.04 $/kW⋅h, 0.06 $/kW⋅h, 0.09 $/kW⋅h and 0.12 $/kW⋅h respectively.
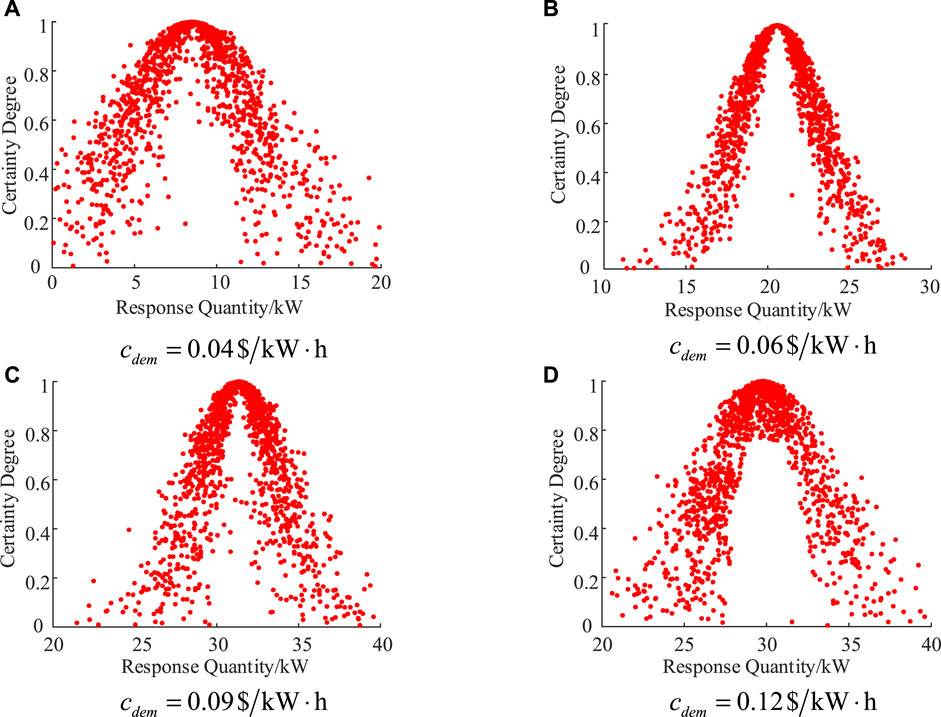
Figure 3. Demand response distribution cloud map with different compensation price.
To perform OPF calculations, the initial step involves establishing an OPF model. This paper proposes an OPF model that comprehensively incorporates multiple uncertainties, primarily the fluctuations in wind turbine output and PV generation, along with the uncertainty associated with demand-side response. The specific composition of the OPF model includes: the objective function, the equality constraints for power balance, and a set of inequality constraints (Sun et al., 2018).
Where, the objective function f is composed of two parts in Eqs 9 and 10: the system’s generation expenses and the compensation expenses for user load shedding, excluding expenses such as unit outages.
The equality constraints primarily consist of the nodal power flow balance constraints in Eq. 11:
Where,
In Eq. 12, where,
The nonlinearity of the OPF model considering multiple uncertainties is primarily concentrated in the equality constraints of the nodal power balance equations and the line active power flow equations. This paper introduces a linearization approach for OPF calculations, incorporating uncertainties in wind and solar energy generation, along with demand-side response considerations, through simplified approximations of the node power balance equations.
The power inflow at node i is expressed as follows:
Where,
The node admittance matrix of a power system exhibits a unique structure, where the diagonal elements are the sums of the admittances of the non-diagonal elements as well as the shunt components connected to each node.
Where,
Where,
Where,
Thus, Eq. 15 can be further deformed, and finally the injected active power of linearized node i, as follows in Eq. 18:
Where,
Finally, based on the calculation formula and approximate simplification of line power flow, the active power flow of line i-j can be derived.
After linearizing the nodal power balance equations, the OPF described in Section 4.1 was established on the MATLAB platform using the YALMIP toolbox, and solved by the commercial solver GUROBI.
To validate the efficacy of the model introduced in this paper, a test was conducted on the IEEE 30-bus system. Detailed parameters for each generating unit, node, and transmission line can be found in the software package provided by MATPOWER 4.1. Two wind farms and two PV plants were integrated into the test system. The wind farms adopted constant power factor control, with an assumed power factor of 1 for all wind farms. For ease of description, the AC OPF model that accounts for the uncertainties in wind and PV power output, coupled with demand-side response, is defined as Model A. The DC OPF model considering the same uncertainties is Model B. Model C is a linear OPF model that only considers the uncertainty of wind and PV power, while Model D focuses on the uncertainty of demand-side response. The proposed linear OPF model in this paper, which considers both wind and PV uncertainties as well as demand-side response uncertainties, is designated as Model E.
The K-means clustering method is used to reduce the generated wind power, PV and demand-side response load scenarios (Wen et al., 2023), and finally the compensated electricity price
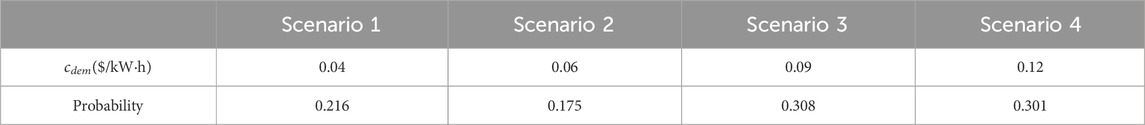
Table 1. Basic parameter table.
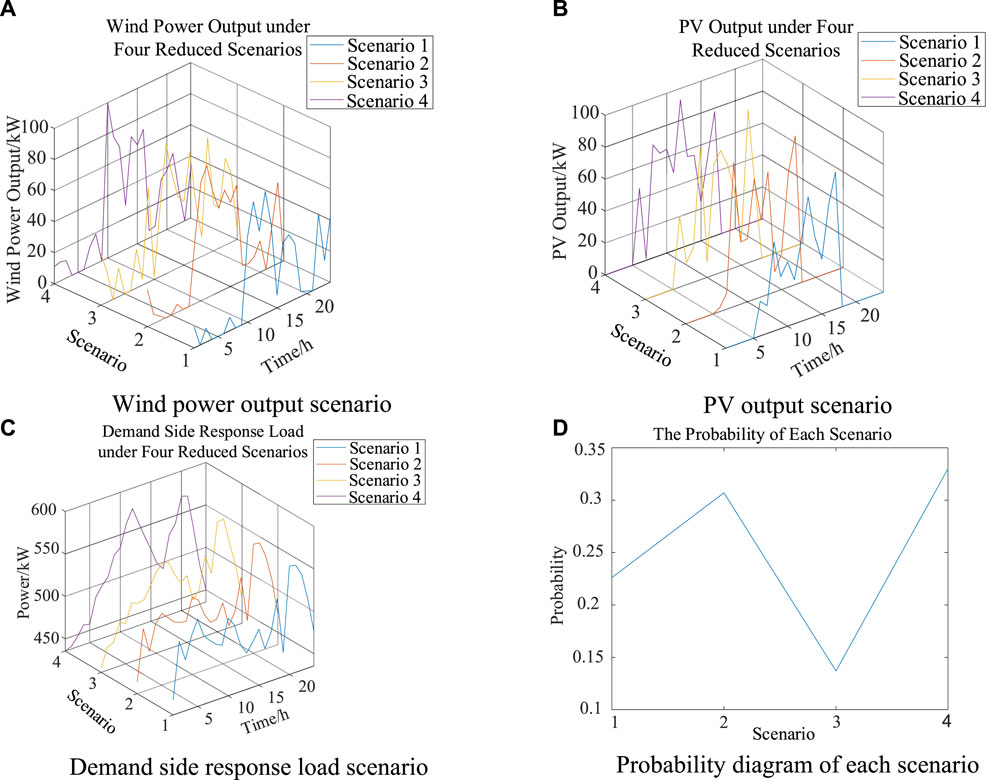
Figure 4. The four scenes reduced through K-means clustering.
To facilitate observation and analysis, the results obtained from solving Model A are used as the benchmark and denoted as
Demand-side response enables load shifting based on real-time electricity prices, avoiding usage during peak hours when electricity prices are high. This helps reduce electricity costs for users, improves economy, and serves to flatten the peak and fill the trough, thereby enhancing system stability.
By means of incorporating demand-side response and refining load curves, the resilience of the grid against uncertainties associated with renewable energy generation can be enhanced. The shifting effect of demand-side response on the load under different incentive levels is shown in Figure 5. It can be observed that as the compensation electricity price increases, the expected response quantity of users also increases, enabling a better optimization of the load curve.
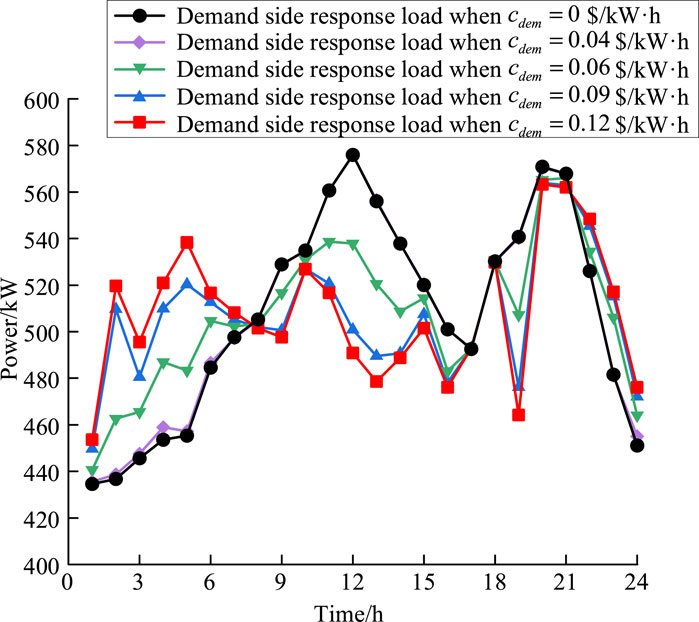
Figure 5. Schematic diagram of demand side response effect.
As can be seen from Figure 6, the expected voltage value of the system considering the uncertainty of wind and solar power output decreases significantly. This is because the integration of wind and PV power generation can meet the active power demand of nearby nodes, thereby altering the direction and magnitude of power flow in various branches. In addition, as the output of wind and PV power generation increases, their reactive power demand also increases correspondingly, resulting in a general reduction in the voltage levels at various nodes in the system.

Figure 6. Schematic diagram of expected node voltage values.
Table 2 and Figure 7 present the computational results of the five models under various scenarios in the test system.
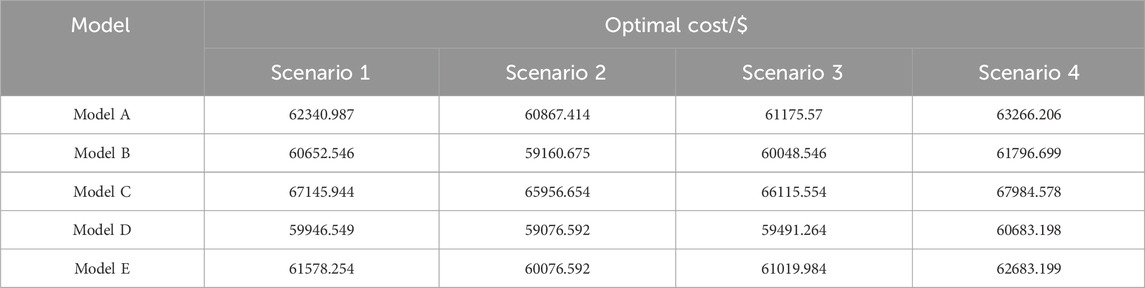
Table 2. The results of each model in four cases.
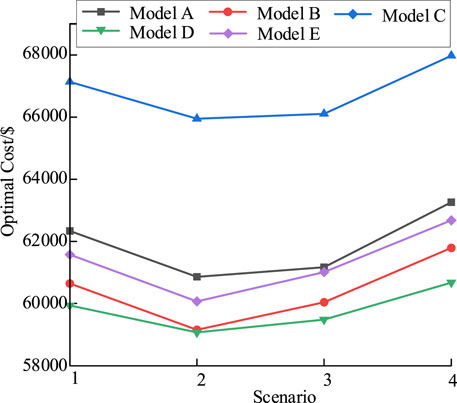
Figure 7. The optimal cost of each model in four scenarios.
As can be seen from Figure 7, a higher compensation electricity price is not necessarily better. When the compensation electricity price is between 0.09 $/kW⋅h and 0.12 $/kW⋅h, the system’s scheduling cost gradually increases. Considering both the economy and uncertainty of the system scheduling cost, there exists an optimal compensation electricity price range of 0.06 $/kW⋅h to 0.09 $/kW⋅h that can result in relatively low system scheduling costs. Therefore, the average of the system dispatch costs when the compensation prices are set at 0.06 $/kW⋅h and 0.09 $/kW⋅h is taken as the expected system scheduling cost for the operator.
From Table 3, it can be observed that all five models are able to obtain optimal solutions under different scenarios, indicating that each model is feasible and effective. In various scenarios, the relative errors of Model B are all greater than 2%, with the maximum relative error approaching 3%. In contrast, the relative errors of Model E are all around 1%, representing an improvement in computational accuracy of approximately 57% compared to Model B. Therefore, the linear OPF calculation method proposed in this paper exhibits stronger applicability and can be effectively applied to online safety calculation and analysis of power systems with renewable energy sources.
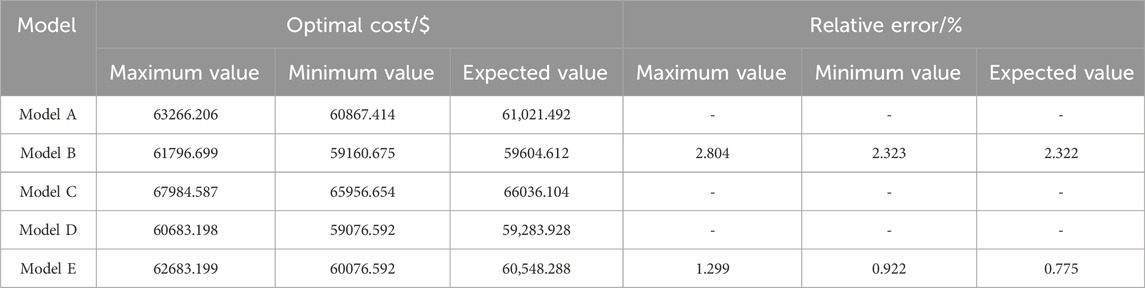
Table 3. Calculation results of five models.
Since Model C only considers the uncertainty of wind and PV outputs, its optimal cost is significantly higher than the other models. Although Model D has the lowest optimal cost, it only takes into account the uncertainty of demand-side response, which may lead to voltage and power violations, causing greater losses to the system and lacking economic feasibility. Model E has a significantly lower optimal cost than Model C, effectively reducing system operating costs. Although it is slightly higher than Model D, Model E can fully guarantee the stability and security of the system’s functioning. Hence, the linear OPF model put forth in this paper, which considers the uncertainties of wind, PV and demand-side response, exhibits good economic performance while balancing system operational safety.
The OPF computation method put forth in this paper takes into account the uncertainties of wind and PV output, analyzes the uncertainty and volatility of the power system’s operating state, and avoids situations where some lines of the power system are overloaded or the voltage at some nodes exceeds the limit, thereby enhancing the safety of system operation. Meanwhile, through the introduction of demand-side response, the load curve has been optimized. This significantly boosts the system’s capacity to handle intermittency and unpredictability in power generation from renewable sources, further elevating the system’s safety level. Additionally, it decreases the required system configuration capacity, ultimately leading to increased cost-effectiveness in the power system. The proposed method also linearizes the power flow calculations that consider multiple uncertainties, significantly reducing the computational burden and improving the calculation accuracy. This approach is more aligned with the demands of real-time safety calculation and analysis in power systems, exhibiting strong applicability and holding significant importance for online calculation and analysis of actual power systems containing uncertainty factors.
The raw data supporting the conclusions of this article will be made available by the authors, without undue reservation.
WZ: Conceptualization, Investigation, Methodology, Software, Writing–original draft, Writing–review and editing. ZP: Conceptualization, Data curation, Formal Analysis, Methodology, Writing–review and editing. QW: Data curation, Formal Analysis, Methodology, Project administration, Validation, Writing–review and editing. WQ: Data curation, Methodology, Supervision, Writing–review and editing. YG: Formal Analysis, Funding acquisition, Project administration, Resources, Supervision, Writing–review and editing.
The author(s) declare that financial support was received for the research, authorship, and/or publication of this article. This work is supported by State Grid Jiangsu Electric Power Co. Ltd Economic Research Institute (SGJSJY00GHJS2310012).
Authors WZ, ZP, QW, WQ, and YG were employed by State Grid Jiangsu Electric Power Co. Ltd. Economic Research Institute.
The authors declare that this study received funding from State Grid Jiangsu Electric Power Co. Ltd Economic Research Institute. The funder had the following involvement in the study: inspiring the study design, providing basic data collection and practical engineering scenario description.
All claims expressed in this article are solely those of the authors and do not necessarily represent those of their affiliated organizations, or those of the publisher, the editors and the reviewers. Any product that may be evaluated in this article, or claim that may be made by its manufacturer, is not guaranteed or endorsed by the publisher.
Chen, G., Dong, Y., and Liang, Z. (2020). Analysis and reflection on high-quality development of new energy with Chinese characteristics in energy transition. Proc. CSEE 40 (17), 5493–5506.
Guo, X., Gong, R., and Bao, H. (2018). Mixed probabilistic and interval optimal power flow considering uncertain wind power and dispatchable load. IEEJ Trans. Electr. Electron. Eng. 13 (2), 246–252. doi:10.1002/tee.22520
Li, B., Wan, C., Li, Y., Jiang, Y., and Yu, P. (2023). Generalized linear-constrained optimal power flow for distribution networks. IET Generation, Transm. Distribution 17 (6), 1298–1309. doi:10.1049/gtd2.12735
Li, H., Li, H., Lu, W., Wang, Z., and Bian, J. (2020). Optimal power flow calculation considering large-scale photovoltaic generation correlation. Front. Energy Res. 8, 590418. doi:10.3389/fenrg.2020.590418
Li, X., Cao, J., and Du, D. (2015). Probabilistic optimal power flow for power systems considering wind uncertainty and load correlation. Neurocomputing 148, 240–247. doi:10.1016/j.neucom.2013.09.066
Liao, X., Xu, Y., and Wei, Z. Probabilistic power flow analysis of integrated electricity-heat energy system based on GMM and multi-point linear cumulant method Electric Power Automation Equipment, 2019, 39(08): 55–62.
Lin, Li, and Zhang, Yu (2020). Uncertainty analysis of incentive demand response participating in optimal scheduling of active distribution network. Jilin: Journal of North China Electric Power University 47 (5), 10–20.
Liu, Z., Wei, Z., and Gao, S. (2019). Adaptive-linearized probabilistic power flow calculation for power grid integrated with high proportion wind power in source-load interactive environment. Power Syst. Technol. 43 (11), 3926–3937.
Morshed, M. J., Hmida, J. B., and Fekih, A. (2018). A probabilistic multi-objective approach for power flow optimization in hybrid wind-PV-PEV systems. Appl. Energy 211, 1136–1149. doi:10.1016/j.apenergy.2017.11.101
Pourbehzadi, M., Niknam, T., Aghaei, J., Mokryani, G., Shafie-khah, M., and Catalão, J. P. (2019). Optimal operation of hybrid AC/DC microgrids under uncertainty of renewable energy resources: a comprehensive review. Int. J. Electr. Power and Energy Syst. 109, 139–159. doi:10.1016/j.ijepes.2019.01.025
Sun, Y., Wang, Y., and Wang, B. (2018). Multi-time scale decision method for source-load interaction considering demand response uncertainty. Automation Electr. Power Syst. 42 (02), 106–113+159.
Wen, Y., Luo, Y., Dong, X., and Xie, X. (2023). Thermal and electrical demand response based on robust optimization. Electr. Power Syst. Res. 225, 109883. doi:10.1016/j.epsr.2023.109883
Xie, P., Cai, Z., and Liu, P. (2019). Cooperative optimization of energy storage capacity for renewable and storage involved microgrids considering multi time scale uncertainty coupling influence. Proc. CSEE 39 (24), 7126–7136.
Xin, B., Shan, B., and Li, Q. (2022). Rethinking of the “three elements of energy” toward carbon peak and carbon neutrality. Proc. CSEE 42 (09), 3117–3126.
Yan, Y., Su, H., and Che, Y. (2018). Probabilistic power flow calculation of power system considering wind power based on improved LHS. Acta Energiae Solaris Sin. 39 (04), 1111–1118.
Yang, Y., Wang, Y., Gao, Y., and Gao, C. (2022). Peak shaving analysis of power demand response with dual uncertainty of unit and demand-side resources under carbon neutral target. Energies 15 (13), 4588. doi:10.3390/en15134588
Yang, Z., Zhong, H., Xia, Q., and Kang, C. (2018). Fundamental review of the OPF problem: challenges, solutions, and state-of-the-art algorithms. J. Energy Eng. 144 (1), 04017075. doi:10.1061/(asce)ey.1943-7897.0000510
Zhao, B., Wang, X., and Zhang, X. (2018). Two-layer method of microgrid optimal sizing considering demand-side response and uncertainties. Trans. CHINA Electrotech. Soc. 33 (14), 3284–3295.
Zhao, L., Zeng, Y., Li, Y., Peng, D., and Wang, Y. (2023). Coordinated planning of power systems under uncertain characteristics based on the multilinear Monte Carlo method. Energies 16 (23), 7761. doi:10.3390/en16237761
Keywords: optimal power flow, demand response, renewable energy grid, cloud model theory, multiple uncertainties
Citation: Zhang W, Peng Z, Wang Q, Qi W and Ge Y (2024) Optimal power flow method with consideration of uncertainty sources of renewable energy and demand response. Front. Energy Res. 12:1421277. doi: 10.3389/fenrg.2024.1421277
Received: 22 April 2024; Accepted: 12 June 2024;
Published: 08 July 2024.
Edited by:
Yingjun Wu, Hohai University, ChinaCopyright © 2024 Zhang, Peng, Wang, Qi and Ge. This is an open-access article distributed under the terms of the Creative Commons Attribution License (CC BY). The use, distribution or reproduction in other forums is permitted, provided the original author(s) and the copyright owner(s) are credited and that the original publication in this journal is cited, in accordance with accepted academic practice. No use, distribution or reproduction is permitted which does not comply with these terms.
*Correspondence: Wenjia Zhang, MTcyMTg5MjUxOEBxcS5jb20=
Disclaimer: All claims expressed in this article are solely those of the authors and do not necessarily represent those of their affiliated organizations, or those of the publisher, the editors and the reviewers. Any product that may be evaluated in this article or claim that may be made by its manufacturer is not guaranteed or endorsed by the publisher.
Research integrity at Frontiers
Learn more about the work of our research integrity team to safeguard the quality of each article we publish.