 Sofia Rosén
 Lisa Göransson
 Maria Taljegård
 Mariliis Lehtveer
94% of researchers rate our articles as excellent or good
Learn more about the work of our research integrity team to safeguard the quality of each article we publish.
Find out more
ORIGINAL RESEARCH article
Front. Energy Res., 17 July 2024
Sec. Hydrogen Storage and Production
Volume 12 - 2024 | https://doi.org/10.3389/fenrg.2024.1420224
Introduction: The transition towards electrolysis-produced hydrogen in refineries and chemical industries is expected to have a potent impact on the local energy system of which these industries are part. In this study, three urban areas with hydrogen-intense industries are studied regarding how the energy system configuration is affected if the expected future hydrogen demand is met in each node individually, as compared to forming a “Hydrogen Valley,” in which a pipeline can be used to trade hydrogen between the nodes.
Method: A technoeconomic, mixed-integer, linear optimization model is used to study the investments in and dispatch of the included technologies with an hourly time resolution, while minimizing the total system cost. Four cases are investigated based on the availability of offshore wind power and the possibility to invest in a pipeline.
Results: The results show that investments in a pipeline reduces by 4%–7% the total system cost of meeting the demands for electricity, heating, and hydrogen in the cases investigated. Furthermore, investments in a pipeline result in greater utilization of local variable renewable electricity resources, as compared to the cases without the possibility to invest in a pipeline.
Discussion: The different characteristics of the local energy systems of the three nodes in local availability of variable renewable electricity, grid capacity and available storage options compared to local demands of electricity, heating and hydrogen, are found to be the driving forces for forming a Hydrogen Valley.
Urban areas account for two-thirds of global energy consumption and approximately 75% of annual global fossil carbon emissions (IEA, 2021a; UNEP, 2024). Actions need to be taken on the national, regional, and local levels to limit emissions in accordance with the targets set in the Paris Agreement (UNFCCC, 2016). Municipalities have an important role to play as the owners and operators of local utilities with the authority to set local environmental goals (IEA, 2021a). To decarbonize the different sectors, such as electricity, transportation, heating and cooling, and industry, in an efficient way, energy planning becomes important (Calvillo et al., 2016). Electrification is acknowledged as an important pathway towards carbon neutrality for cities (IEA, 2021a; IPCC, 2022). Historically, urban areas have primarily consumed power that is generated outside the city borders, though there is increasing interest in local power production within cities (IEA, 2021a). Direct electrification can act as a measure to decarbonize some sectors, while other sectors, such as industry, are also dependent upon green fuels such as hydrogen (Bataille, 2020; Seck, et al., 2022).
Hydrogen is already widely used in refining and chemical industries, while new applications to reduce CO2 emissions include hydrogen as a reducing agent in steel making, fuel for the transport sector and possibility to store energy (IEA, 2021b). To decarbonize sectors through the use of hydrogen, hydrogen production itself need to be carbon neutral, whereas today, most hydrogen globally is produced using natural gas and coal as feedstock. In Year 2022, 96% of Europe’s hydrogen was produced from natural gas in steam methane reformers (SMRs), resulting in significant levels of CO2 emissions (EC, 2024). Two mechanisms that have been suggested to reduce emissions from hydrogen production are: 1) the use of carbon capture and storage (CCS) in SMR or gasification processes; and 2) electrolyzers, whereby electricity is used to split water into oxygen and hydrogen (IEA, 2023). Due to electrolyzers potential to operate in a flexible manner, they can adapt to the outputs of variable renewable electricity (VRE) generation, such as wind and solar power (IRENA, 2019; Aboumahboub, et al., 2020; Kakoulaki, et al., 2021; Zhang et al., 2022; Jodry, et al., 2023; Chyong, et al., 2024). Kakoulaki et al. (2021) found that the total potential of VRE has been deemed sufficient to meet an expected increase in electricity demand due to hydrogen production through electrolysis, on a regional level for Europe. However, to gain a better understanding of the issues, a techno-economic analysis of regional energy systems with integrated hydrogen production using electrolyzers and renewable energy, as well as of the possibilities for transmission and storage of hydrogen was warranted by Kakoulaki et al. (2021).
By using pipelines to transmit hydrogen, regions with an abundance of VRE can be connected to regions with high hydrogen demands (Neumann, et al., 2023; Toktarova, 2023). Towards this goal, initiatives such as the European Hydrogen Backbone (EHB, et al., 2022) have been initiated. Previous studies of hydrogen infrastructures in energy systems (EHB, et al., 2022; Neumann, et al., 2023; Toktarova, 2023; Chyong, et al., 2024) have typically applied a top-down approach in which a continental, pan-national or national energy system and hydrogen network is presented to exploit efficiently national VRE resources. However, the pipelines are typically represented as simple energy flows rather than accounting for the gas dynamics within the pipeline, resulting in smaller investments in hydrogen storages and pipeline capacity due to overly flexible transmission (Shchetinin et al., 2023). Furthermore, the results from such top-down studies have indicated that continent-wide energy systems that have potential for electricity grid expansion can offer geographic smoothing, thereby outcompeting hydrogen pipeline infrastructures (Chyong, et al., 2024).
For hydrogen-intense industries located within the same region, hydrogen pipelines could mitigate challenging local characteristics, such as a low availability of VRE and limited electricity grid connections to the surrounding region. If several industry-intense urban areas are located within the same region, they can form a Hydrogen Valley. A Hydrogen Valley represents a bottom-up perspective of a specific geographic scope, being large in scale, supplying more than one sector, and covering multiple steps in the hydrogen value chain, from hydrogen production to storage and distribution, and eventual consumers (Weichenhain, et al., 2021). Wang et al. (2024) have studied a 7-node hydrogen network in an investment and dispatch optimization model that included hydrogen pipelines, hydrogen refueling stations, hydrogen storage devices, power-to-hydrogen devices, and renewable energy generation to supply fuels for the transportation sector. Their study focused on the coupling of multiple networks (electricity, hydrogen, and transportation) and concluded that the coupling of networks enhances investment efficiency and operational flexibility while meeting the electricity and hydrogen demands. The study did not include other sectors, such as industry and residential sectors, or heating demands.
For urban areas with hydrogen-intense industries, a transition towards zero emissions using electrolyzers could have a strong impact on the municipal-level energy system. Apart from electricity and hydrogen for the industry sector, heating and transportation are other sectors that make demands on the municipal energy system. To meet these demands from the different sectors in an efficient way, sector coupling has been recognized as an essential measure for achieving a fossil-free energy system (Lund, et al., 2017). Numerous studies have been conducted to investigate the potential of sector coupling in energy systems across a range of geographic scales, from urban to continental to global systems (Pursiheimo et al., 2019; Aboumahboub, et al., 2020; Arabzadeh, et al., 2020; Bogdanov, et al., 2021; Heinisch et al., 2021; Neumann, et al., 2023). Arabzadeh et al. (2020) have evaluated different decarbonization strategies using Helsinki as a case study. The study included Helsinki’s electricity and heating demands, as well as an additional need for electricity for electric vehicles. Energy storage and sector coupling were shown to enhance the integration of renewables and to reduce carbon emissions. Heinisch et al. (2019, 2021) and coworkers employed a linear optimization model to analyze sector coupling involving electricity, heating, electric cars and public transportation in an urban energy system. Sector coupling was found by Heinisch et al. (2019, 2021) to lower the cost of the energy system and to offer benefits in terms of managing fluctuations in supply and demand, which arise due to the intermittency of renewable energy sources and the demand patterns of the city. However, the studies conducted by Arabzadeh et al. (2020) and Heinisch et al. (2019, 2021) are lacking both hydrogen as an energy carrier and any possibility for collaboration between different urban areas.
Several studies have investigated the coupling of industry and other selected sectors in local and urban energy systems (Zhang et al., 2022; Jodry, et al., 2023; Wang, et al., 2023). Jodry et al. (2023) have included the hydrogen demands from industries, such as steelmaking, refineries, methanol and chlorine production plants, in a bottom-up techno-economic optimization model that investigated investments in and the hourly operation of hydrogen production and storage infrastructures. That study proposed that electrolyzers will assume an important role in producing low-carbon hydrogen and will be operated when local electricity generation from solar photovoltaics (PV) and onshore and offshore wind power are available, or when the price of electricity imported from the grid is low. Lacking from that study by Jodry et al. (2023) was the integration with other sectors, such as heating and transportation, as well as the electricity demands from residential and commercial sectors. Furthermore, only one node was investigated, thereby omitting trade with hydrogen between different nodes. Zhang et al. (2022) have used a techno-economic optimization model that represents an isolated region of Australia, to study the supply of electricity and hydrogen for the electricity, transport, and heating/industry sectors. Zhang et al. have shown that both electrolysis and the use of fossil fuels with CCS to produce hydrogen could have a significant presence in least-cost energy systems that aim at ≥80% abatement compared to current emissions levels. However, there was limited consideration of the interconnection between the heating and electricity sectors, and only one node was investigated.
Although the studies mentioned previously have contributed with valuable insights in hydrogen as an energy carrier in future decarbonized energy systems, studies investigating collaboration using a pipeline between urban areas located within the same region are lacking. Studies including the possibility to trade hydrogen through pipelines are typically using a national or continental scope where geographical smoothing becomes an important pipeline benefit. In addition, pipeline representation in models with large geographical scope typically does not take into consideration the actual gas dynamics of the flow. For studies with a local scope, pipelines between urban areas represented by multiple sectors have, to the authors’ knowledge, not been investigated. The aims of the present study are to: 1) understand how best to meet the hourly requirements for heating, electricity, and hydrogen from residential, commercial and transportation sectors, as well as selected parts of the industry sector in three urban areas; and 2) compare how the energy system configuration may be affected if hydrogen pipelines between the urban areas is allowed as an investment option. Thus, this study seeks to answer the following questions:
• In what ways do the hydrogen demands of industries affect municipal energy systems when the hydrogen is produced through electrolysis?
• How do regional collaborations in relation to exchanging hydrogen through a pipeline between three industry-intense urban areas affect the energy system configurations?
• Does the role of sector coupling depend on whether the demand for hydrogen is met locally or through regional collaboration?
This study applies a techno-economic modeling approach to a future zero fossil fuels energy system in three industry-intense urban areas. This approach addresses the growing demand for hydrogen from electrolysis in industrial processes within a regional context. The challenges associated with meeting the demands for electricity, heating, and hydrogen at the lowest operational and investment costs in the region are formulated as a linear mixed-integer problem. To investigate how an increased electricity demand linked to the production of hydrogen from electrolysis could affect the local energy system, the Swedish West Coast is taken as a case study. The Swedish West Coast could serve as an example of a Hydrogen Valley, since there are three industry-intense urban areas located in proximity to each other: Gothenburg, Stenungsund, and Lysekil. The industries include refineries in Gothenburg and Lysekil and chemical industry in Stenungsund, all of which are reliant on hydrogen in their processes.
This study uses a mixed-integer linear optimization model with the aim of minimizing the total system cost to analyze the impacts of the demands for hydrogen and electricity from the industry sector on the urban energy system. The model is run over 1 year with an hourly time resolution and covers the heat, electricity and hydrogen demands of the residential, commercial, transportation and industrial sectors. The objective of the model is to minimize the total system costs, including both operational and investment costs, while not allowing for fossil CO2 emissions, giving local energy prices for electricity, heat and hydrogen as an output. The model was first introduced by Heinisch et al. (2019), who investigated the interconnections between the district heating and electricity sectors in a single node urban energy system, using Gothenburg as a case study. The model was further developed by Heinisch et al. (2021) to include electric cars and public transportation. Figure 1 presents the model, whereby the green boxes indicate additions to the model in this study compared to the version used by Heinisch et al. (2021). The main additions are: 1) the implementation of hydrogen as an energy carrier with production and storage technology alternatives; 2) a representation of the electricity and hydrogen demands from the industry sector; 3) the use of several nodes representing different urban areas; and 4) the possibility to exchange hydrogen between the nodes via a pipeline. In Figure 2, a schematic representation of the modeled Hydrogen Valley is presented including the three industry-intense urban areas Gothenburg, Stenungsund and Lysekil. Each node in the model has its own demands for electricity, heating, and hydrogen that need to be fulfilled, as well as possibilities to invest in local electricity, heating, and hydrogen production and storage technologies. The nodes can be connected with each other through investments in pipelines, going from a decentralized system where every node needs to fulfil its own demands to a system in which collaboration can be an option to minimize the system cost.
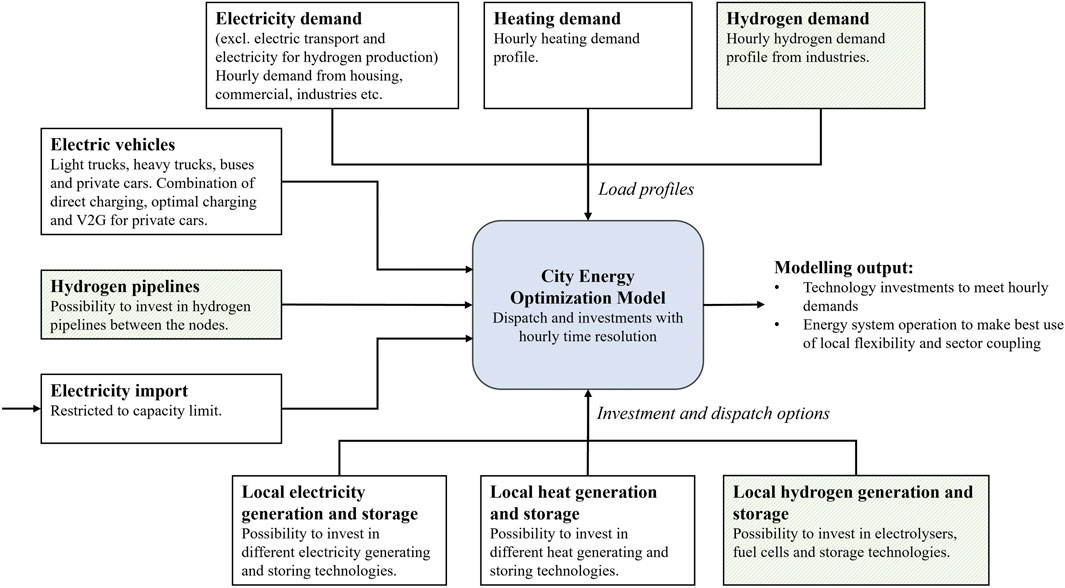
Figure 1. Schematic overview of the mixed-integer linear optimization model used. The green boxes indicate model developments compared to the model presented previously by Heinisch et al. (2021). The boxes represent inputs to the model and are specified for the electricity, heating, and transportation sectors, and to some extent, the industry sector.
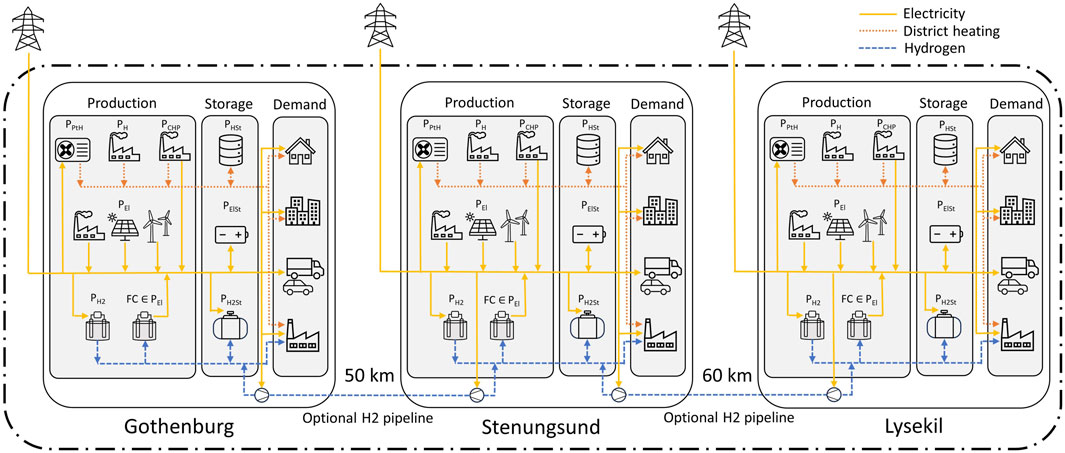
Figure 2. Schematic representation of the modeled nodes Gothenburg, Stenungsund and Lysekil, including production and storage units for electricity, heat and hydrogen, to meet the demand from residential, commercial, transportation and industry sectors. The optional pipeline investment makes it possible to connect the three nodes to form a Hydrogen Valley. The dash-dotted line represents the system boundary of the study.
The objective function of the model is given in Eq. 1 and aims to minimize the total system costs over 1 year (
Equations 2–6 describe the electricity, heating, and hydrogen balances, respectively. The balance equations ensure that the demands for electricity, heating, and hydrogen are met for every timestep, t, in each node, n. In the electricity balance, the fixed electricity demand (
The fixed hourly heating demand in each node (
The hydrogen demand equation is expressed as a separate balance equation for each node (Eqs 4–6), due to the nature of the pipeline implementation. The hydrogen balance includes a fixed hourly hydrogen demand profile for each node (
Equations 7–10 describe which variables are positive and binary, respectively, as well as the minimum and maximum values for trading hydrogen and electricity.
Additional constraints related to the charging and discharging of storages, load limits, thermal cycling, and more can be found in Heinisch et al. (2019). In Table 1, the sets, parameters and variables used to describe the model are summarized.
Table 1. Sets, variables, and parameters used to implement the constraints in the model.
Shchetinin et al. (2023) compared different ways to model hydrogen pipelines in techno-economic optimization models, to retain tractability while not over-simplifying the gas dynamics in the operation of the pipelines. Their study showed that a simplification of the pipeline dynamics results in smaller investments in pipeline capacity and hydrogen storage. The reason for this is an overestimation of pipeline flexibility. The method used to describe the pipeline dynamics in the present study is derived from that of Shchetinin et al. (2023), where the pipeline is divided into three segments (I), as visualized in Figure 3. The three segments result in four cross-sections (k), where the differences in pressure and mass flow between the cross-sections are retrieved from the Euler equations, assuming isothermal gas flow through a horizontal pipeline.
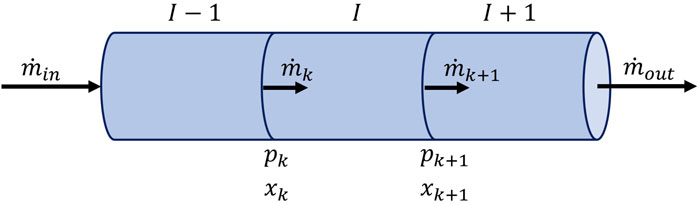
Figure 3. Pipeline divided into three segments (I) and four cross-sections (k). p, Pressure;
By discretizing the Euler equations in both time and space, the following equations are derived:
However, Eq. 12 is still non-linear. The mean mass flow between two pipeline segments,
In this linearized form, three coefficients,
To connect the mass flow in the pipeline to the rest of the model, a conversion factor,
Apart from describing the mass flow and pressure differences between the segments of a pipeline, an additional equation is introduced to describe the linepack. The linepack is the total amount of hydrogen stored within the pipeline and is calculated using the difference in the amounts of hydrogen that have been put into and taken out of the pipeline, in similarity to a storage unit. Since the pipeline is divided into segments, it is possible to pump hydrogen into the pipeline from two nodes simultaneously, thereby increasing the linepack, and subsequently to retrieve the hydrogen from the pipeline. The linepack process is described in Eq. 15, where
Equations 11, 13–15 are used in the final model formulation to describe the flow through the pipelines. Using this formulation allows the model to identify the optimal size of the pipeline by comparing the allowed capacities to transport hydrogen, as well as considering the allowed pressure differences between the cross-sections. The pressure difference between two consecutive timesteps in a cross-section is restricted according to Eq. 16. The limit is implemented to take into account the stress imposed on the pipeline material by pressure fluctuations.
Equations 17–19 are implemented to regulate the pressures and flow of the hydrogen in the pipeline, as well as the hydrogen stored in the linepack.
Lastly, consideration is taken to the electricity demand related to the work of compressors,
The three nodes modeled in this study are located within the same electricity price region (e.g., SE3). The prices used for the import and export of electricity to the surrounding region are based on a model developed by Göransson et al. (2017), which describes the electricity system of northern Europe. Öberg et al. (2022) developed the model further, and the electricity price profile used for this study is retrieved from their model. Just as this study, the electricity price profiles retrieved from the model presented by Öberg et al. are derived using the wind speeds, solar insolation, and electricity and heat demands from Year 2019, with costs and assumptions representing a future energy system around Year 2050. The techno-economic data used in this work to describe the technologies are retrieved from the Danish Energy Agency (2023), Danish Energy Agency (2024), using their approximations for Year 2050 and can be found in Supplementary Appendix A, together with the pipeline costs derived from European Hydrogen Backbone (EHB, et al., 2022) and values of the coefficients
Electricity generation: Solar PV on rooftops (PV rooftop), solar PV parks with optimal tilt (PV park), offshore wind power (Wind offshore), peak power gas turbines fired by biogas (GT biogas), condensing power plant with wood chips (W), combined cycle gas turbine (CCGT biogas), fuel cells (FC).
Electricity storage: Li-Ion batteries, EV batteries.
Combined heat and power (CHP) plants: CHP plants fired by wood chips (CHP wood chips) and combined cycle back pressure plants fired by biogas (CHP biogas).
Heat production: Heat-only boilers fired by wood chips (HOB wood chips) or biogas (HOB biogas), heat pumps (HP), electrical boilers (EB) and industrial waste heat (Waste heat).
Thermal storage units: Tank storage (TTES) and borehole storage (BTES).
Hydrogen production: Proton exchange membrane (PEM) electrolysis (electrolyzer).
Hydrogen storage units: Tank storage (H2tank) and lined rock caverns (LRC).
Hydrogen transportation: pipelines with diameters in the range of 200–700 mm (i.e., D200, D300, D400, D500, D700).
Onshore wind power is not included owing to the limited ground area within the studied urban nodes. The profiles used to represent solar and wind profiles are retrieved from Renewables Ninja (Renewables, 2023, Pfenninger and Staffell, 2016; Staffell and Pfenninger, 2016) and are included in Supplementary Appendix B. The pressure in the pipelines was allowed to vary between 40 and 70 bar (Danish Energy Agency and Energinet, 2017) and was allowed in each cross-section to change by no more than 0.5 bar between two consecutive timesteps, in order to take into account the stresses placed on the materials of the pipeline by the rapid pressure fluctuations (Wesselink et al., 2022). The maximum hydrogen flow capacity was retrieved from the European Hydrogen Backbone (EHB, et al., 2022) and extrapolated to the pipeline sizes included in the model runs. The friction coefficient, f, was set at 0.008 in accordance with the dissertation of O’Malley (2021), and the speed of sound for hydrogen, c, at 1,320 m/s. The electricity demand for compression of hydrogen before storage was calculated as 0.083 kWhel/kWhH2, assuming a pressure of 200 bar in both the hydrogen tank storage and LRC, using Eq. 26 as presented by Preuster et al. (2017), assuming hydrogen to have a lower heating value of 33.33 kWh/kgH2. Similarly, the electricity demand for the compressors related to the pipeline was calculated to 0.058 kWhel/kWhH2.
The three nodes modeled in this case study, Gothenburg, Stenungsund and Lysekil, are urban areas located on the Swedish West Coast and are included due to their expected future hydrogen demands from industries. Gothenburg and Lysekil have refineries, while chemical industries are located in Stenungsund. Apart from the industries, the nodes have different characteristics. Gothenburg is a node with a relatively large population, a high demand for electricity and limited access to imported electricity and offshore wind power. Stenungsund has access to substantial imports of electricity and offshore wind in relation to the increased electricity demand. Lysekil has a comparatively small population and poor import possibilities for electricity relative to the increased electricity demand, although it has possibilities for large investments in offshore wind power. The hourly electricity demand profile for Gothenburg is based on actual data for Gothenburg in Year 2019 and multiplied by a factor of 1.3 to represent the expected increase in electricity demand linked to population increases up to Year 2050 (Göteborgs Stad, 2024a; Göteborgs Stad, 2024b). The heat demand profile is based upon measured data from Year 2012, due to a lack of data for the studied year of Year 2019. A comparison of the temperatures in 2012 and 2019 is presented in Supplementary Appendix C. For Stenungsund and Lysekil, the annual electricity and heating demands (Länsstyrelserna, 2020) for the two nodes was used and divided to hourly demands based on the profiles for Gothenburg and included in Supplementary Appendix D. In this study, we have assumed a full electrification of the current private car fleet, buses and light and heavy trucks. Of the private electric cars, 30% are assumed to be available for vehicle-to-grid (V2G), i.e., also able to deliver electricity from the car battery to the grid. For more details on the representation of the private car fleet and trucks, see Taljegård et al. (2021).
The hydrogen demand is based on a report written by Edvall et al. (2022) that describes the current and future annual demands for hydrogen of industries located in the investigated nodes. In the report, the current yearly demand of 6.4 TWh was compared to an expected minimum demand of 4.9 TWh and maximum demand of 14 TWh. The maximum scenario of 14 TWh per year of hydrogen (∼20 TWh per year of electricity if produced with electrolysis) for the system was chosen for the studied main cases, based on replacing current SMR processes, as well as an increasing demand for hydrogen. The yearly demand is used to create an hourly demand profile, assuming that there is a continuous demand for hydrogen from the industrial processes for every hour of the year. For comparison, the total electricity demand in Gothenburg, Stenungsund and Lysekil was in Year 2020 approximately 4.2 TWh, 1.6 TWh and 0.5 TWh, respectively (Länsstyrelserna, 2020).
In Table 2, node-specific data are provided for Gothenburg, Stenungsund and Lysekil, respectively. The nodes differ, for example, in terms of access to electricity import capacity, available area for solar parks, available rooftop area for solar PV, access to offshore wind power, annual electricity, heating and hydrogen demand, and the possibility to invest in LRC. The electricity import capacity to the nodes is derived from future electricity system plans in Sweden (SvK, 2023) and is, therefore, larger than the capacity available today. The availability of offshore wind power is based on five offshore wind farm projects, which could be connected to the different nodes (Eolus, 2021; Hexicon, 2021; Zephyr, 2021; Njordr Offshore Wind, 2023; Vattenfall, 2024). Gothenburg is modeled with two different availabilities for offshore wind power. The difference in offshore wind farm availability for Gothenburg is due to two wind farms overlapping and these serve as the basis for the cases investigated in this study. Solar park availability is restricted to areas that can be assumed to be available within the three nodes. The available rooftop area that can be used for solar PV investments is based on population size, according to the method proposed by Wiginton et al. (2010). The possibility to invest in LRC is restricted in Gothenburg due to uncertainties related to suitable areas.
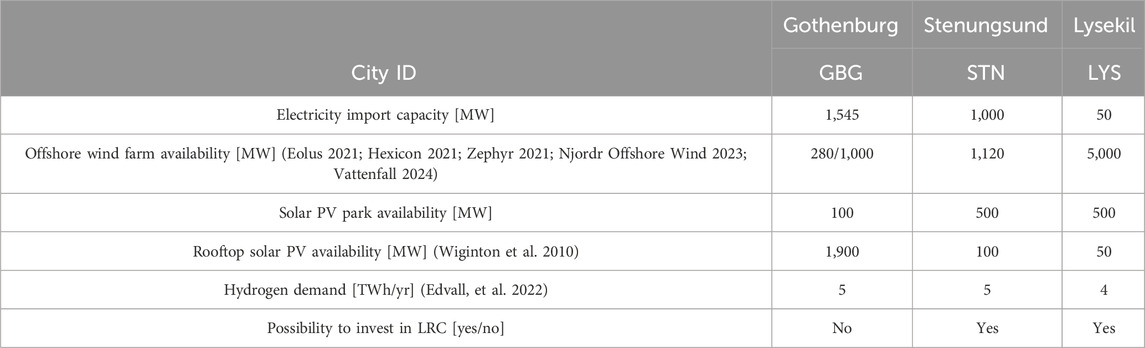
Table 2. Characteristics of the modeled nodes.
In this study, four cases were evaluated that reflect the available capacities of an offshore wind farm located outside of the larger city node (Gothenburg), as well as the possibility to invest in pipelines between the three nodes. The availability of offshore wind power outside the other two industry-intense nodes (Stenungsund and Lysekil) remains the same in all cases. For each offshore wind farm capacity available outside the larger city node, the model is run with and without the possibility to invest in pipelines between the nodes, so as to compare the effects on the energy system given the possibility of a shared hydrogen infrastructure. The four cases are summarized in Table 3.
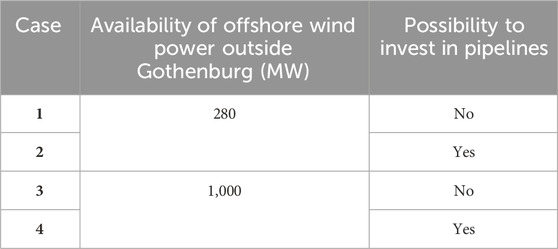
Table 3. Descriptions of the four modeled cases.
Figure 4 presents the installed capacities for electricity generation, summarized for all the nodes (A), as well as the annual levels of electricity generation (B), for the four cases investigated. The total annual electricity supplied amounts to 32–33 TWh for all cases, as shown in Figure 4B. Common to the four cases is the combination of investments in offshore wind farms and solar PV parks to meet the demand in Year 2050 (Figure 4A). In the first cases, i.e., with the limitation of a maximum 280 MW of offshore wind power capacity connected to Gothenburg and without a pipeline, a larger share of the annual electricity demand is met through imported electricity, as compared with the other cases in Figure 4B. With the possibility to invest in a pipeline and/or a larger wind farm outside Gothenburg, the model makes such investments, resulting in a larger share of the annual electricity demand being met locally through wind and solar power, while the amount of imported electricity is reduced (Figure 4B). Solar parks are the most-cost-efficient way to meet the electricity demand for the cases investigated, and there are investments in maximum capacity in all the cases and all three nodes.
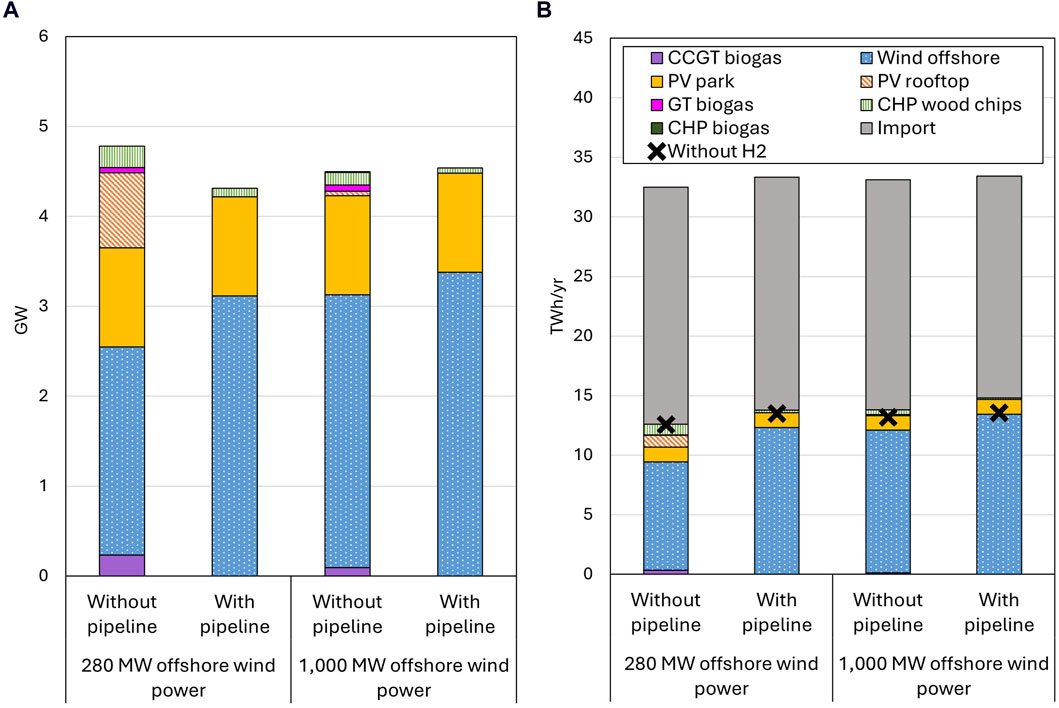
Figure 4. Invested-in electricity generation technologies (A) and the annual levels of electricity production (B) for all three nodes combined.
When it is possible to invest in hydrogen pipelines between the nodes, pipeline investments are found to be cost-efficient in both cases with larger and smaller offshore wind farms. Access to a pipeline affects the system configurations in the nodes, as can be seen in Figure 4. In Figure 4A, it is shown that the investment in a pipeline makes a larger difference to the technology investments when there is a possibility to invest in no more than 280 MW of offshore wind power capacity connected to Gothenburg, as compared with the case with up to 1,000 MW. With the availability of up to 280 MW of offshore wind power and the possibility to invest in a pipeline, there are no investments in rooftop PV and CCGT biogas capacities, while investments in CHP plants decrease (Figure 4A). Instead, investments are made in additional offshore wind power. The system configuration shows a similar trend in the cases with the possibility to invest in up to 1,000 MW offshore wind power capacity outside Gothenburg plus a pipeline, with slightly larger investments being made in offshore wind power when the pipeline is available than when it is not. Overall, curtailment of VRE resources for the whole system is reduced with investments in a pipeline, as compared to without a pipeline, from 1.3% to 1% with up to 280 MW of wind power outside Gothenburg, and from 1.1% to 0.6% with up to 1,000 MW of wind power. Lastly, the investments in CHP wood chip plants decrease to some extent with investments in a pipeline and no investments are made in CCGT biogas plants and PV rooftop.
In Figure 5, the investments in electricity generating technologies are presented for each node separately. The pipeline improves the utilization of the most-cost-efficient resources as hydrogen production is located where there is access to offshore wind power. The driving force for the collaboration towards meeting the future hydrogen demand through a pipeline resides in the different characteristics of the nodes. In Gothenburg, the maximum available capacity for offshore wind power is invested in for all four cases. With a maximum available offshore wind power capacity of 280 MW and without a pipeline, there are investments in rooftop PV, CCGT biogas and CHP wood chips plants, complementing the offshore wind farms and solar PV parks in Gothenburg. With access to a pipeline, the total electricity generation capacity invested in is significantly smaller in Gothenburg, with the greatest difference being that no investments are made in rooftop PV. Furthermore, no investments are made in CCGT biogas and the investments in CHP wood chip plants in Gothenburg are smaller with the pipeline than without the pipeline. With the possibility to invest in a wind farm with up to 1,000-MW capacity connected to Gothenburg, no investments in rooftop PV and GT biogas are made in the node, and the impact of a pipeline on the system composition is weaker than in the cases with availability of a 280-MW wind farm.
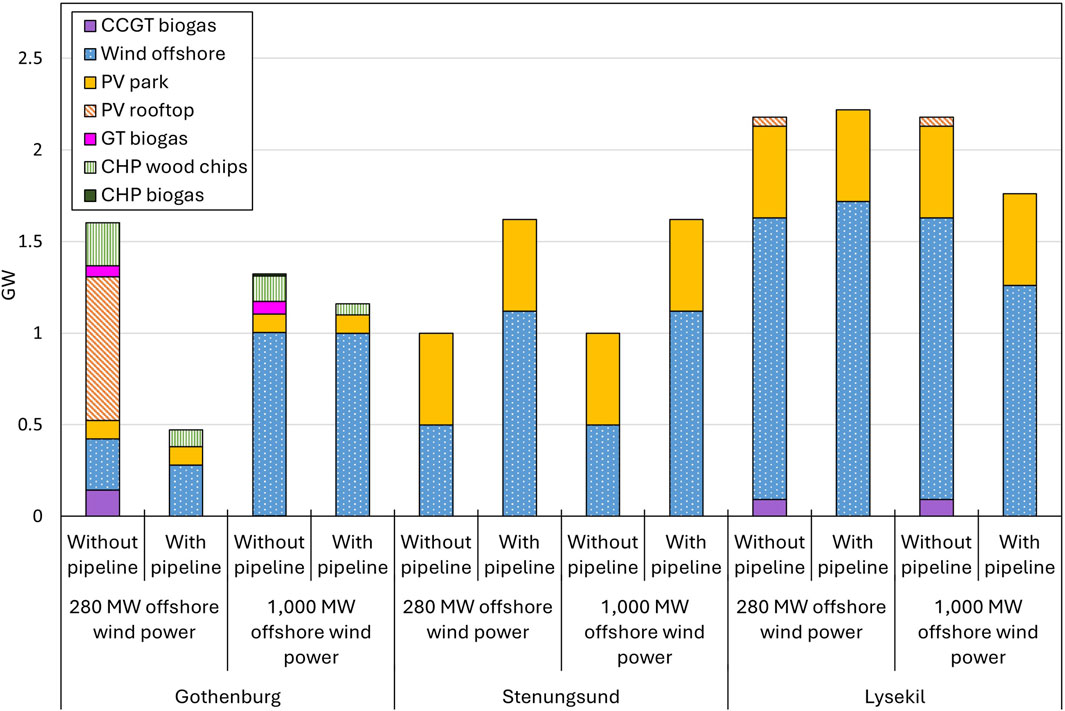
Figure 5. Invested-in electricity generating technologies depending on case and investigated node.
As for the other two nodes, investments are made primarily in a combination of solar PV parks and offshore wind power (see Figure 5). For Stenungsund, a node that has a comparatively large grid connection, no technology investments in addition to those in offshore wind power and solar PV parks are needed to meet the demand for electricity, with or without a pipeline. With a pipeline, the offshore wind power capacity in Stenungsund increases (from 500 MW to 1,120 MW, independent on offshore wind farm availability outside Gothenburg) to compensate for the lower investments in electricity generation capacity in Gothenburg with a pipeline compared to without a pipeline. The installed wind power capacity reaches the maximum limit in Stenungsund with both the 280-MW and 1,000-MW limits on wind power in Gothenburg when there is investment in a pipeline. In Lysekil, however, investments are made in PV rooftop and CCGT biogas as complements to those made in solar PV parks and offshore wind power in the cases without a pipeline. With a pipeline, only investments in solar PV parks and offshore wind power are made because the pipeline provides a flexibility option that is distinct from that conferred by local storage units. In Lysekil, a small increase in investments in offshore wind power can be seen when there are investments in a pipeline and up to 280 MW of wind power outside Gothenburg, as compared to without a pipeline. However, investments in offshore wind power decrease with a pipeline and 1,000 MW of offshore wind power outside Gothenburg, as compared to without a pipeline.
Figure 6 shows the annual levels of electricity generation for the different technologies and the net amounts of imported electricity annually from the regional grid to the nodes. The crosses in Figure 6 indicate the electricity demands in the absence of electricity for hydrogen production in each case. The diamonds in Figure 6 represent the electricity demands if the hydrogen were to be produced locally, showing clearly how Gothenburg becomes an importer of hydrogen (primarily from Stenungsund) when a shared pipeline is available. For Gothenburg and Stenungsund, imported electricity from the regional grid supplies most of the electricity needed in the node, followed by wind power (Figure 6). In Lysekil, wind power is the main contributor to meeting the demand for electricity, together with solar PV parks. In the cases without a pipeline, Lysekil becomes a net exporter of electricity to the regional grid, while the node becomes a net importer of electricity from the regional grid when a pipeline is available. Lysekil has few possibilities to balance the intermittency of wind and solar power with imports and exports of electricity from the regional grid, due to its strictly limited grid capacity. When more electricity is available in Gothenburg (1,000 MW of offshore wind power), it becomes cost-efficient to move hydrogen production from Lysekil to Stenungsund. This is because the larger grid capacity available in Stenungsund, as compared to Lysekil, can be used to balance VRE.

Figure 6. Annual electricity supply depending on case and investigated node.
The possibility to invest in a pipeline between the three nodes not only affects the configuration of the electricity system, as shown in Figures 4–6, but also affects the investments in the district heating sector. For Stenungsund and Lysekil, waste heat from the industry sector can meet the demand for heat, so no further investments in heating technologies are needed in the four cases. In Gothenburg, however, additional investments are made in CHP woodchips, CHP biogas, HOB biogas, HP and EB. As more cheap electricity becomes available in Gothenburg, either through the larger offshore wind farm, or through investments in a pipeline, PtH technologies (EB and HP) takes on a larger share of the annually produced heat. In the cases with a 280 MW offshore wind farm, the share of heat produced with PtH technologies goes from 16% to 47% as investments in a pipeline are made. With a 1,000 MW offshore wind farm, the share of heat from PtH technologies increases from 38% to 51%. HOB biogas is used when the cost of imported electricity is high and electricity production from VRE sources low. The investments in heating technologies as well as annually produced heat can be found in greater detail in Supplementary Appendix E.
The total installed electrolyzer capacity varies between 3.1 GWEl and 3.5 GWEl depending on the case, while the minimum capacity needed is 2.3 GWEl for the three nodes in total (i.e., there is an overinvestment of 36%–53%). Investments in electrolyzer capacity are in the higher range for the two cases with investments in pipelines (49%–53% of overinvestments), and in the lower range (36%–41% of overinvestments) for the cases without a pipeline. In Figure 7, the installed electrolyzer capacity is presented. The red lines indicate the minimum capacity that is needed if the electrolyzers are to be run at full capacity throughout the year to meet the hydrogen demand; thus, representing the minimum possible size of investment. Overcapacity is cost-efficient since it, together with the storage units, makes it possible to avoid hydrogen production during hours of low wind and solar power production and high prices for imported electricity. In the cases without a pipeline, there is overcapacity of the electrolyzers in every node. However, the overcapacity is significantly smaller in the Gothenburg node due to the higher cost of storing hydrogen (only tank storage units are allowed). For the cases with pipeline investments, LRC storage is accessible to all three nodes via the pipeline, and the total electrolyzer overcapacity increases. It is noteworthy that no investments are made in fuel cells although the hydrogen infrastructure is available and receives investment. This has mainly to do with the low roundtrip efficiency and the fact that hydrogen can be used directly as a feedstock in industry.
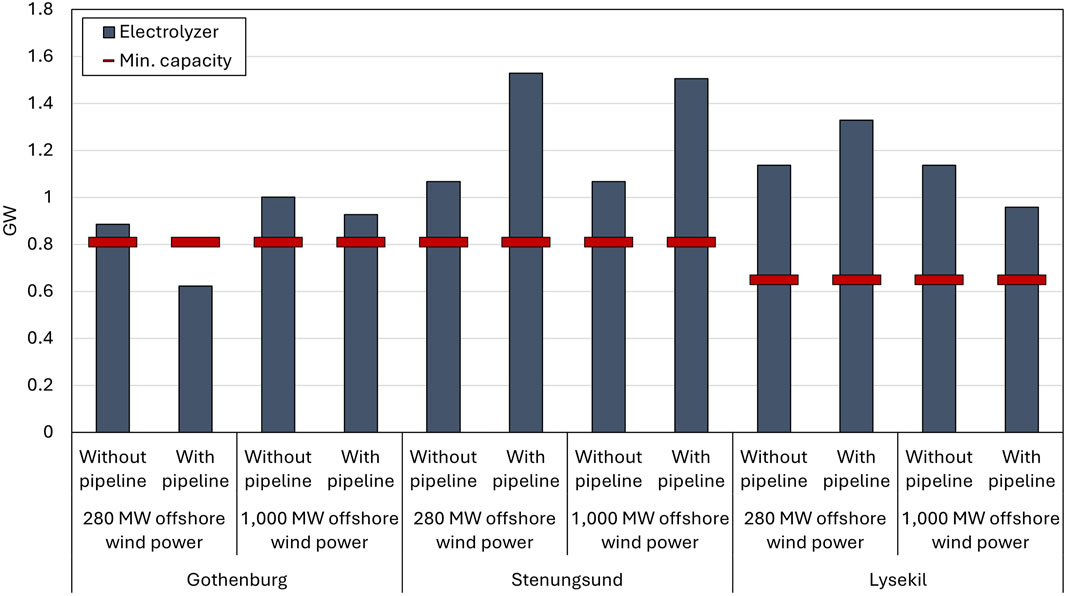
Figure 7. Invested-in electrolyzer capacities depending on case and investigated node.
In the cases with wind power capacity limited to 280 MW, the access to a pipeline reduces investments in electrolyzer capacity in Gothenburg to below the minimum capacity for the node to be self-sufficient, while the electrolyzer size in Stenungsund increases by approximately 43%. Gothenburg is a node that has a high demand for electricity, and with a pipeline, part of the hydrogen production is shifted to Stenungsund where the availability of offshore wind is greater, resulting in a lowered demand for electricity in Gothenburg. In Lysekil, investment in a pipeline results in an approximately 17% increase in the installed electrolyzer capacity. With a shared pipeline, the maximum capacity of offshore wind power is installed in both Gothenburg and Stenungsund, and it becomes cost-efficient to produce hydrogen in Lysekil, where there is greater access to offshore wind power.
With a larger wind farm connected to Gothenburg, a larger electrolyzer is invested in locally (1 GWEl). With access to a pipeline, the Gothenburg electrolyzer capacity decreases slightly to 0.93 GWEl, although the overall investment in electrolyzer capacity increases (+6%) in the system. In Stenungsund, the electrolyzer capacity increases in a similar way as in the case with a 280-MW wind farm and pipeline. The electrolyzer in Lysekil becomes 15% smaller when a pipeline is introduced. The change in electrolyzer size correlates with the smaller wind farm that is invested in for Lysekil. As Gothenburg can cover a larger fraction of its own demands for hydrogen locally due to the enhanced access to offshore wind power, it becomes cost-efficient for Lysekil to reduce its hydrogen production and in doing so reduce its electricity demand. In fact, Lysekil produces less hydrogen than its annual demand in the case where 1,000 MW of offshore wind is connected to Gothenburg. The explanation for this can be found in the larger electricity grid capacity found in Stenungsund compared to Lysekil, which makes it more cost-efficient to balance the intermittency of VRE in Stenungsund than in Lysekil. With investments in a pipeline, the curtailed VRE in Lysekil changes from 2.2%–2.3% to 1.7%–1.8%.
In Figure 8, the investments in hydrogen storage facilities are presented. In the case with a 280-MW offshore wind farm outside Gothenburg and without a pipeline, LRCs with storage capacities of 50 GWhH2 and 57 GWhH2 are invested in for Stenungsund and Lysekil, respectively. In Gothenburg, investments are made in a hydrogen tank storage because LRC storage is not allowed within the city. The hydrogen tank storage is dimensioned to provide hydrogen during a period of approximately 14 h (8 GWhH2). With a pipeline, the tank storage in Gothenburg is replaced with a larger, less expensive, LRC in Stenungsund, as shown in Figure 8, while the storage in Lysekil becomes smaller with the pipeline than without the pipeline. The results become even more prominent in the case with the possibility to invest in a 1,000-MW offshore wind farm connected to Gothenburg, as compared with the 280-MW wind farm case. Furthermore, a larger share of the hydrogen is produced in Stenungsund, where large investments in wind power capacity are made. Storage at the same node as the production of wind power makes it possible to consider variations in wind power locally and limit the need for pipeline investments. In Lysekil, the LRC storage is retained even with a pipeline, adding to the argument that an LRC storage facility close to the site of hydrogen production is beneficial from a cost-efficient system perspective.
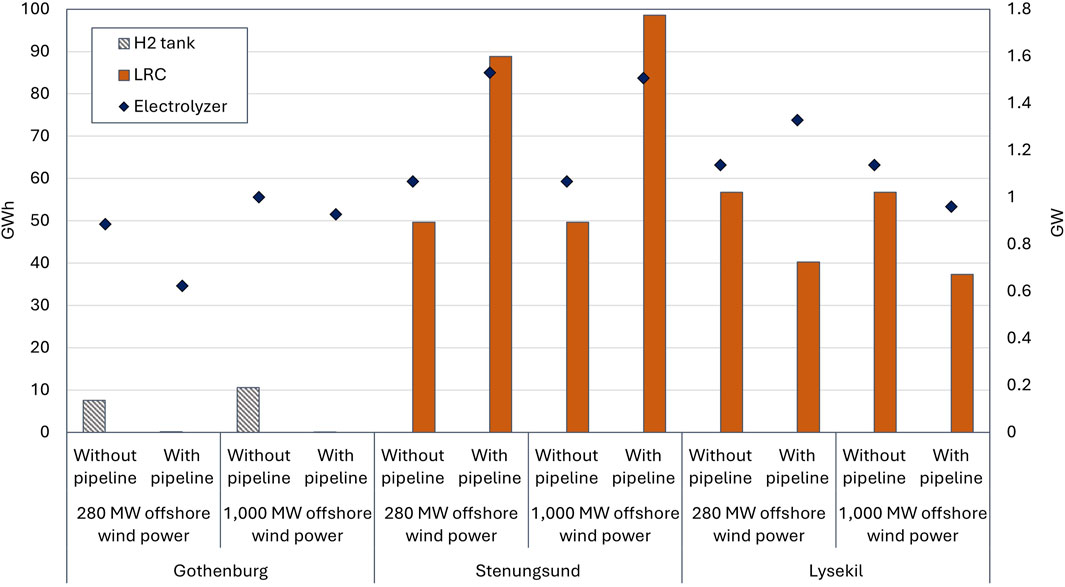
Figure 8. Investments in hydrogen storage (GWh), together with the installed electrolyzer capacities (GW) at the different sites.
The pipeline diameters invested in differ depending on the case and connecting nodes. With availability limited to 280 MW of offshore wind power capacity, the pipeline diameters are optimized to 300 mm between Gothenburg and Stenungsund, and 200 mm between Stenungsund and Lysekil. A pipeline diameter of 300 mm allows for a hydrogen flow of 0.61 GWH2, which is close to the demand for hydrogen in Gothenburg at 0.57 GWH2. With access to a wind farm of 280 MW, Gothenburg imports 43% of the annual hydrogen demand. As the available offshore wind farm capacity is expanded to 1,000 MW, the diameter of the pipeline between Gothenburg and Stenungsund increases to 400 mm, while that between Stenungsund and Lysekil remains the same (200 mm). With a wind farm of 1,000 MW, hydrogen net import is reduced to 16% of the annual demand, as hydrogen is also exported to Stenungsund for storage. Stenungsund remains a net exporter of hydrogen with both sizes of offshore wind farms, although both imports and exports are reduced when a larger wind farm is connected to Gothenburg. It is noteworthy that even though the total amount of hydrogen transported through the pipeline is reduced, the pipeline diameter increases. This is because larger fluctuations in the pipeline occur due to the larger variations in hydrogen production derived from the larger investment in offshore wind power. To comply with the pressure constraint in each cross-section, a larger pipeline diameter becomes cost-efficient. For Lysekil, the change in offshore wind availability in Gothenburg results in the node converting from a net exporter to a net importer of hydrogen. This can be explained by the limited connection to the regional grid in Lysekil, as described previously. Importing hydrogen provides an alternative way to fulfil the demand for hydrogen without needing additional local investments in electricity production and storage of hydrogen to balance the demand and supply. Investment in a pipeline becomes a cost-efficient alternative to manage the intermittency of VRE, independent of Lysekil’s role as a net importer or exporter of hydrogen, which can be seen from the reduced curtailment of VRE presented in Section 3.2.1.
To verify the robustness of the pipeline investments, two sensitivity analyses were conducted: changing the hydrogen demand in the nodes and the investment cost of the pipelines. As for the hydrogen demand, the Current (6.4 TWh/year) and Minimum (4.9 TWh/year) demand (Edvall, et al., 2022) for hydrogen in the three nodes were evaluated and compared to the Maximum demand (14 TWh/year) applied in this work. The pipeline diameter between Stenungsund and Lysekil (STN-LYS) remains at 200 mm independent on demand. However, the pipeline diameter between Gothenburg and Stenungsund changes. With availability of a 280 MW offshore wind farm, the investment goes from a diameter of 300 mm to a diameter of 200 mm when the demand is changed to the Current and Minimum demand. With availability of a wind farm of 1,000 MW, the investment goes from a diameter of 400 mm in the Maximum scenario, to 300 mm with the Current hydrogen demand and 200 mm in the Minimum demand-case. Stenungsund remains the main exporter of hydrogen with the largest investment in electrolyser capacity as well as LRC independent of hydrogen demand. The most prominent difference is the share of the annual hydrogen demand that is imported. For the case with 280 MW offshore wind power, the share of net imported hydrogen related to annual demand in Gothenburg goes from 43% with a hydrogen demand of 14 TWh (Maximum) to 23% (Current) and 17% (Minimum) as the hydrogen demand decreases while Lysekil goes from −15% (net export) to 69% (Current) and 81% (Minimum) as the demand decreases. A similar effect can be seen in the cases with available offshore wind power of 1,000 MW outside Gothenburg. As the investment cost for the pipelines was doubled, investments in pipelines remained, although the pipeline diameter between Gothenburg and Stenungsund is reduced to 300 mm in the case with 1,000 MW offshore wind power.
In Figure 9, 2 weeks of pipeline operation between Stenungsund and Gothenburg (GBG-STN) (A) and Stenungsund and Lysekil (STN-LYS) (B), together with the state-of-charge for the LRC storage (C), operation of the electrolyzer (D) and electricity supply (E) in Stenungsund are presented for the case with up to 1,000 MW of offshore wind power outside Gothenburg. The electrolyzer can be seen to adapt to offshore wind patterns, together with electricity production from the solar PV park between Hours 2,352 and 2,688. When there is lower electricity production and importation of electricity due to high electricity prices (e.g., Hours 2,390 to 2,455), the electrolyzer reduces its load to zero. Simultaneously, the export to Lysekil is limited, although export to Gothenburg is continued. The storage level of the LRC decreases during these hours, indicating that Stenungsund takes on the role of a centralized hydrogen storage facility that supports both its own hydrogen demand and the hydrogen demand of Gothenburg. As electricity production increases, Stenungsund imports hydrogen from Gothenburg and the LRC is charged. Similar patterns are repeated over the year. The electrolyzers in both Lysekil and Gothenburg show a similar pattern, where the electrolyzer is run under windy conditions, on sunny days, and during periods with a low cost for imported electricity. Similar plots for Gothenburg and Lysekil are depicted in Supplementary Appendix F.
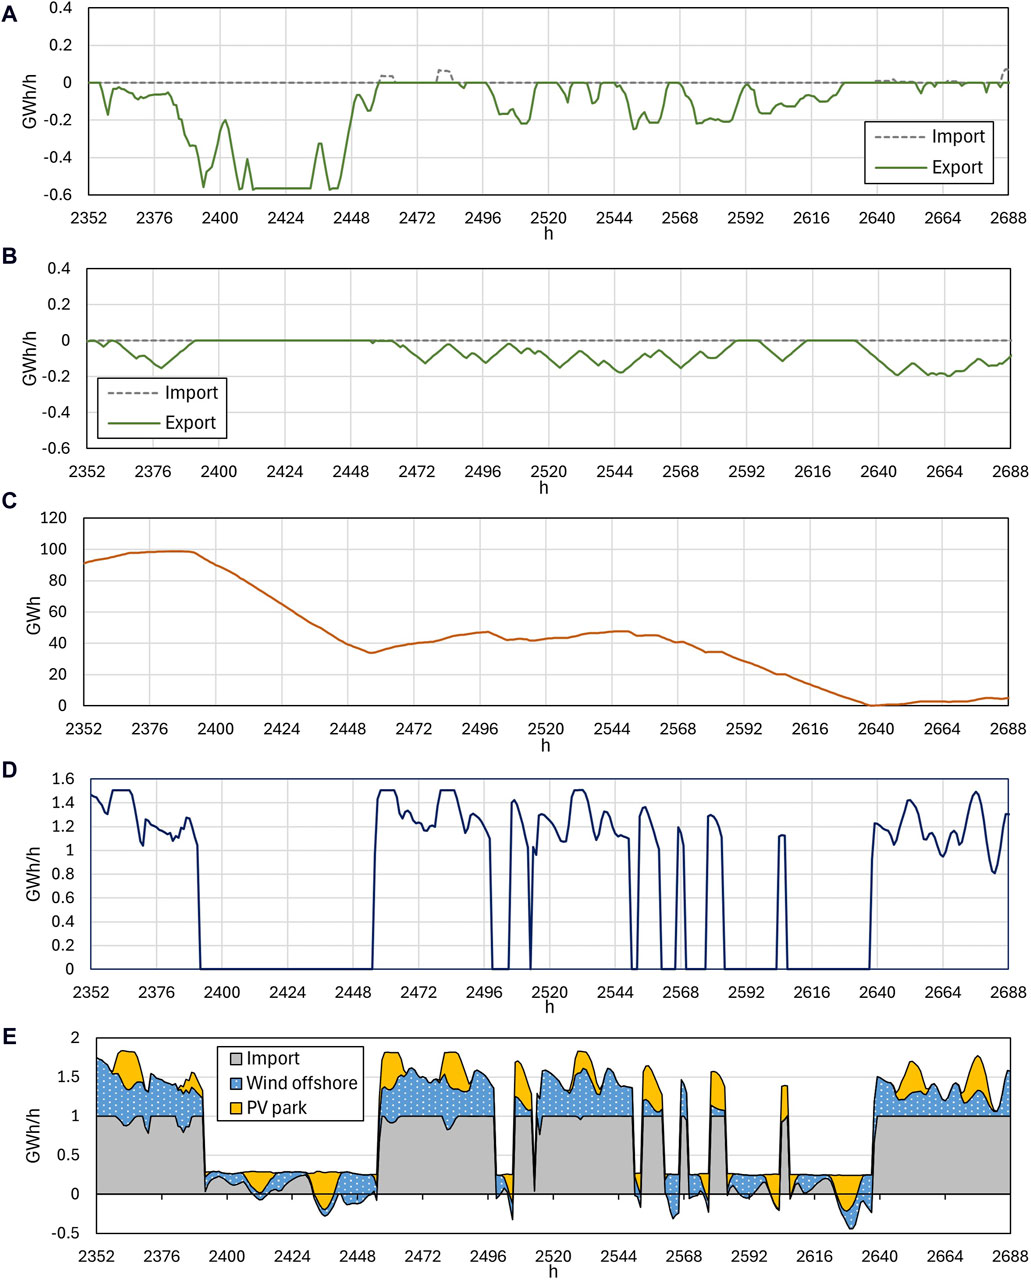
Figure 9. Hydrogen balance for Stenungsund in the case with a 1,000-MW wind farm in Gothenburg and investments in pipelines. The import of hydrogen takes a positive value, whereas the export of hydrogen takes a negative value. (A) Import and export through pipeline connection GBG-STN. (B) Import and export through pipeline connection STN-LYS. (C) LRC storage energy content. (D) Electrolyzer load (electricity). (E) Electricity supplied from offshore wind power, solar PV parks, and import/export to regional grid over a 2 weeks period.
In Table 4, the total system costs and marginal costs for hydrogen for the four cases are presented. The introduction of a pipeline results in decreases in the total system cost of 4% and 7% for the 1,000-MW and 280-MW offshore wind farms, respectively. The reduction in system cost is attributed to the collaboration of infrastructures, with an observed trend towards a large hydrogen production and storage facility in Stenungsund. For the cases with a pipeline, the investment costs for the pipeline and related compressors represent 0.66% (9.7 M€/yr) and 0.70% (10.2 M€/yr) of the total cost, respectively. The marginal cost of hydrogen ends up being 2.3–2.9 €/kg depending on the case, where the lowest cost is achieved with access to a 1,000-MW offshore wind farm and pipeline, and the highest cost is noted for a 280-MW offshore wind farm and no pipeline. The pipeline investment reduces the cost for producing hydrogen by 17% for the cases with 280 MW of wind power and by 12% for the cases with 1,000 MW of offshore wind power.
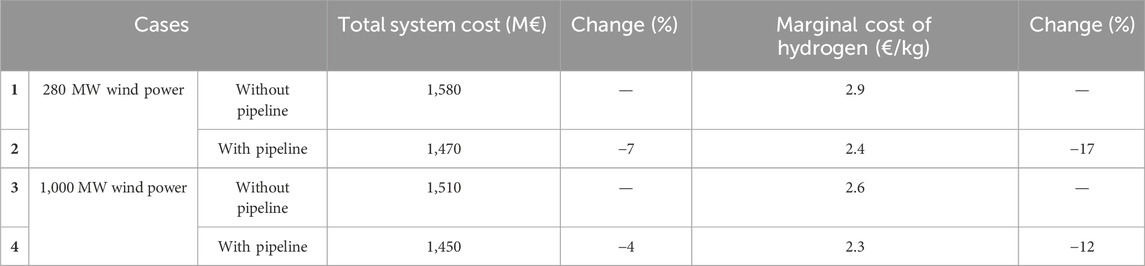
Table 4. Total system cost and marginal cost of hydrogen for the four main cases.
This study is based on assumptions regarding the future hydrogen demands of the industries in the investigated nodes. The demands can change depending on the pathways taken by the industries (i.e., SMR+CCS, gasification and/or electrolysis), as well as whether other sectors are included, such as hydrogen in the transportation sector. Zhang et al. (2022) and Jordy et al. (2023) have concluded that SMR and gasification together with CCS remain as important technologies for abating emissions from hydrogen production. If other technologies, such as SMR and gasification, are used in combination with the electrolyzer, redundancy can be introduced into the system, which could lead to a different system structure becoming the optimal one. Furthermore, alternative technologies for the production of hydrogen could play important roles during the period of transition towards zero emissions. Therefore, additional technologies and alternatives for meeting the hydrogen demand should be included in future studies.
In this work, the level of availability of wind power is based on ongoing projects. How many of these facilities will eventually be built remains uncertain. The results show that the value of regional collaboration via a hydrogen pipeline is greater if access to offshore wind power capacity is very limited in one of the nodes. In addition, the results indicate that hydrogen production is located in areas where there is access to offshore wind power and there are possibilities to balance the electricity demand with imports from the regional grid. If some of the offshore wind power projects fail, it seems likely that the investments in electrolyzers will be moved to another node and hydrogen will be transferred using a pipeline. Similarly, changes to the reinforcements of the connections to the regional grid could have an impact on the results, as the possibility to import and export electricity helps to balance the intermittency of VRE. Uncertainties related to the pathways for the industries as well as in relation to the amounts of electricity that will be available, make it interesting for future studies to evaluate how the order in which decisions are made will affect the system. In addition, the tipping points for when investments in a pipeline are made, based on the availability of VRE and the chosen technology for producing hydrogen, warrant further investigation.
The investigated nodes can collaborate towards meeting the hydrogen demand by investing in a pipeline. An alternative to the pipeline could be to expand the electricity grid to distribute electricity between the nodes instead. This alternative was not included in the current study but should be investigated, since it has been shown that electricity grid expansions can outcompete hydrogen pipelines in larger geographic scopes (Chyong, et al., 2024). Having the ability to import and export additional electricity between the nodes would probably have the strongest impact on Gothenburg, where there is a significant demand for electricity even without the demand from hydrogen production. Since the availability of cheap electricity also affects the heating sector, it is possible that having a reinforcement of the electricity transmission grid is cost-competitive compared to a pipeline that transports hydrogen, resulting in a different energy system configuration.
The flow of hydrogen through the pipeline was regulated by a constraint that allows for a pressure difference of 0.5 bar between two consecutive timesteps. It would be more accurate to restrict the number of cycles that are allowed over a year. As described by Wesselink et al. (2022), smaller fluctuations in pressure can occur daily, while larger fluctuations risk damaging the material of the pipeline if they occur more than once a month. The diameter of the pipeline between Gothenburg and Stenungsund in which there is investment became larger (400 mm) with a 1,000-MW offshore wind farm. The full capacity of the larger pipeline was, however, never utilized; instead, the larger pipeline diameter made it possible to change the flow between two separate hours while not exceeding the pressure difference limit between those 2 hours. Implementing a restriction on the number of cycles rather than a pressure difference between hours could result in investment in a smaller-diameter pipeline.
In the present study, it is assumed that a share of 0.3 of today’s waste heat will remain in the system at the same quality in the future. What is lacking is consideration of low-quality heat, which is heat at lower temperatures that is not directly usable in the district heating system without first being spiked with heat pumps to higher temperatures, such as waste heat from electrolyzers. The connection between electrolyzers and the heating system has not been considered in this study, but it could provide the possibility for further sector coupling. Even though processes change, it is assumed that low-quality heat will be present in future urban areas and may have an impact on the heating system, as compared to the results presented in this study.
In this study, a techno-economic modeling approach to describe mathematically a Hydrogen Valley is presented and applied to the west coast of Sweden, encompassing three industry-intense nodes: Gothenburg, Stenungsund, and Lysekil. Four cases are investigated, which vary in terms of the availability of sites for offshore wind power and the possibility to invest in hydrogen pipelines between the nodes. The results show that the increased demand for hydrogen produced from electrolysis is primarily met with electricity from local VRE (solar parks and offshore wind power) and imports from the regional electricity grid. Overinvestments in electrolyzer capacity (+36%–53%) are made in the system together with investments in hydrogen storage units, following line with the availability of local VRE resources.
For the cases investigated, it is found to be cost-efficient to distribute hydrogen between the nodes through a pipeline, i.e., to form a Hydrogen Valley. Investments in a pipeline results in lower total system costs (reductions of 4%–7% for the cases investigated), lower costs for hydrogen (12%–17% for the cases investigated), and greater utilization of local VRE resources, as compared with the cases without the pipeline investment option. The different characteristics of the nodes are identified as important factors in terms of the value of forming a Hydrogen Valley. For a node with overall high electricity demand and without possibility to invest in large-scale hydrogen storage, a hydrogen pipeline could shift part of the electricity demand, due to hydrogen production with electrolysis, to another node that has greater availability of cheap electricity. For a node with a strictly limited grid connection, investment in a hydrogen pipeline provides a cost-efficient flexibility option to balance the intermittency of local VRE. Investments in pipelines remained cost-efficient when lowering the hydrogen demand.
Further investigations should be made into the tipping points for pipeline investments, such as the availability of VRE resources and grid capacity. Lastly, this study represents one future year, and depending on the order in which decisions are taken regarding investments in VRE and grid reinforcements, the cost-efficient system configuration could change.
The raw data supporting the conclusions of this article will be made available by the authors, without undue reservation.
SR: Investigation, Methodology, Writing–original draft. LG: Conceptualization, Methodology, Supervision, Writing–review and editing. MT: Supervision, Writing–review and editing. ML: Resources, Supervision, Writing–review and editing.
The authors declare that financial support was received for the research, authorship, and/or publication of this article. This work was financed by Göteborg Energi AB (Gothenburg Energy AB) within the project Modellering av stadens energiomställning (ES02) (Modeling of the city’s energy transition).
Warm thanks to Erik Fiedler-Blackhammar at Nordion Energy and Anna-Karin Jannasch at Uniper who shared their expertise in hydrogen pipelines and Mikael Niklasson at LEVA for help with data retrieval. Lastly, thanks to Niclas Mattsson for sharing his knowledge on energy systems modeling.
Author ML was employed by Göteborg Energi AB.
The remaining authors declare that the research was conducted in the absence of any commercial or financial relationships that could be construed as a potential conflict of interest.
All claims expressed in this article are solely those of the authors and do not necessarily represent those of their affiliated organizations, or those of the publisher, the editors and the reviewers. Any product that may be evaluated in this article, or claim that may be made by its manufacturer, is not guaranteed or endorsed by the publisher.
The Supplementary Material for this article can be found online at: https://www.frontiersin.org/articles/10.3389/fenrg.2024.1420224/full#supplementary-material
Aboumahboub, T., Brecha, R., Shrestha, H., Fuentes, U., Geiges, A., Hare, W., et al. (2020). Decarbonization of Australia's energy system: integrated modeling of the transformation of electricity, transportation, and industrial sectors. Energies 13, 3805. doi:10.3390/en13153805
Arabzadeh, V., Mikkola, J., Jasiūnas, J., and Lund, P. D. (2020). Deep decarbonization of urban energy systems through renewable energy and sector-coupling flexibility strategies. J. Environ. Manag. 260, 110090. doi:10.1016/j.jenvman.2020.110090
Bataille, C. G. F. (2020). Physical and policy pathways to net-zero emissions industry. WIREs Clim. Change 11 (2). doi:10.1002/wcc.633
Bogdanov, D., Gulagi, A., Fasihi, M., and Breyer, C. (2021). Full energy sector transition towards 100% renewable energy supply: integrating power, heat, transport and industry sectors including desalination. Appl. Energy 283, 116273. doi:10.1016/j.apenergy.2020.116273
Calvillo, C. F., Sánchez-Miralles, A., and Villar, J. (2016). Energy management and planning in smart cities. Renew. Sustain. Energy Rev. 55, 273–287. doi:10.1016/j.rser.2015.10.133
Chyong, C. K., Pollitt, M., Reiner, D., and Li, C. (2024). Modelling flexibility requirements in deep decarbonisation scenarios: the role of conventional flexibility and sector coupling options in the european 2050 energy system. Energy Strategy Rev. 52, 101322. doi:10.1016/j.esr.2024.101322
Danish Energy Agency (2023). Technology data. Available at: https://ens.dk/en/our-services/projections-and-models/technology-data.
Danish Energy Agency (2024). Technology data. Available at: https://ens.dk/en/our-services/projections-and-models/technology-data/.
Danish Energy Agency, and Energinet (2017). Technology data - energy transport, 125. Energinet: Danish Energy Agency.
EC (2024). Hydrogen. European comission. Available at: https://energy.ec.europa.eu/topics/energy-systems-integration/hydrogen_en (Accessed February 26, 2024).
Edvall, M., Eriksson, L., Harvey, S., Kjärstad, J., and Larfeldt, J. (2022). Vätgas på Västkusten. Gothenburg: RISE.
EHB, van Rossum, R., Jens, J., Guardia, G.La, Wang, A., Kühnen, L., and Overgaag, M. (2022). European Hydrogen Backbone - a European hydrogen infrastructure vision covering 28 countries. Available at: https://ehb.eu/files/downloads/ehb-report-220428-17h00-interactive-1.pdf.
Eolus (2021). Vindkraftpark västvind - samradsunderlag avgränsningssamrad. Hässleholm: Eolus. Available at: https://www.eolusvind.com/projekt/havsbaserad-vind/vastvind-vindkraftpark/ (Accessed February 14, 2024).
Goransson, L., Goop, J., Odenberger, M., and Johnsson, F. (2017). Impact of thermal plant cycling on the cost-optimal composition of a regional electricity generation system. Appl. Energy 197, 230–240. doi:10.1016/j.apenergy.2017.04.018
Göteborgs Stad (2024a). Demografisk analys: befolkningsprognos 2024–2050. Göteborg: Göteborgs Stad, stadsledningskontoret, statistik och analys.
Göteborgs Stad (2024b) “Folkmängd 1984-2022 (SCB),” in Statistikdatabas Göteborgs Stad. Available at: https://statistikdatabas.goteborg.se/pxweb/sv/1.%20G%c3%b6teborg%20och%20dess%20delomr%c3%a5den/1.%20G%c3%b6teborg%20och%20dess%20delomr%c3%a5den__Kommun__Befolkning__Folkm%c3%a4ngd__Folkm%c3%a4ngd%20hel%c3%a5r/10_FolkmHelar_GBG.px/table/tableViewLayout1/.
Heinisch, V., Göransson, L., Erlandsson, R., Hodel, H., Johnsson, F., and Odenberger, M. (2021). Smart electric vehicle charging strategies for sectoral coupling in a city energy system. Appl. Energy 288, 116640. doi:10.1016/j.apenergy.2021.116640
Heinisch, V., Göransson, L., Odenberger, M., and Johnsson, F. (2019). Interconnection of the electricity and heating sectors to support the energy transition in cities. Int. J. Sustain. Energy Plan. Manag. 24, 57–66. doi:10.5278/ijsepm.3328
Hexicon (2021). Mareld vindkraftspark - samrådsunderlag. Stockholm: Hexicon. Available at: https://mareld.gatsby.qte.nu/wp-content/uploads/2023/03/SamradsunderlagMareldmedbilaga.pdf.
IEA (2021a). Empowering Cities for a Net Zero Future: unlocking resilient, smart, sustainable urban energy systems. Paris: IEA. Available at: https://www.iea.org/reports/empowering-cities-for-a-net-zero-future.
IEA (2021b). Net zero by 2050 - a roadmap for the global energy sector. Paris: IEA. Available at: https://www.iea.org/reports/net-zero-by-2050.
IEA (2023). The oil and gas industry in net zero transitions. Paris: IEA. Available at: https://www.iea.org/reports/the-oil-and-gas-industry-in-net-zero-transitions.
IPCC (2022). Summary for Policymakers. In: Climate Change 2022: Mitigation of Climate Change. Contribution of Working Group III to the Sixth Assessment Report of the Intergovernmental Panel on Climate Change. Editor P. R. Shukla, J. Skea, R. Slade, A. Al Khourdajie, R. van Diemen, and D. McCollum (Cambridge, United Kingdom: Cambridge University Press).
IRENA (2019). Hydrogen: a renewable energy perspective. Abu Dhabi: International Renewable Energy Agency.
Jodry, A., Girard, R., Nóbrega, P. H. A., Molinier, R., and Faris, M.-D.El A. (2023). Industrial hydrogen hub planning and operation with multi-scale optimisation. J. Clean. Prod. 426, 138750. doi:10.1016/j.jclepro.2023.138750
Kakoulaki, G., Kougias, I., Taylor, N., Dolci, F., Moya, J., and Jäger-Waldau, A. (2021). Green hydrogen in Europe - a regional assessment: substituting existing production with electrolysis powered by renewables. Energy Convers. Manag. 228, 113649. doi:10.1016/j.enconman.2020.113649
Länsstyrelserna. 2020. "Energistatistik." Accessed 02 September, 2024. Available at: https://www.leks.se/energistatistik/.
Lund, H., Østergaard, P. A., Connolly, D., and Vad Mathiesen, B. (2017). Smart energy and smart energy systems. Energy 137, 556–565. doi:10.1016/j.energy.2017.05.123
Neumann, F., Zeyen, E., Victoria, M., and Brown, T. (2023). The potential role of a hydrogen network in Europe. Joule 7 (8), 1793–1817. doi:10.1016/j.joule.2023.06.016
Njordr Offshore Wind (2023). Skagerak offshore gamma - samrådsunderlag. Karlstad: Njordr Offshore Wind.
Oberg, S., Odenberger, M., and Johnsson, F. (2022). The cost dynamics of hydrogen supply in future energy systems - a techno-economic study. Appl. Energy 328, 120233. doi:10.1016/j.apenergy.2022.120233
O'Malley, C. (2021). Coordination of gas-electric networks: modeling, optimization and uncertainty. Zürich. [Dissertation].
Pfenninger, S., and Staffell, I. (2016). Long-term patterns of European PV output using 30 years of validated hourly reanalysis and satellite data. Energy 114, 1251–1265. doi:10.1016/j.energy.2016.08.060
Preuster, P., Alekseev, A., and Wasserscheid, P. (2017). Hydrogen storage technologies for future energy systems. Annu. Rev. Chem. Biomol. Eng. 8, 445–471. doi:10.1146/annurev-chembioeng-060816-101334
Pursiheimo, E., Holttinen, H., and Koljonen, T. (2019). Inter-sectoral effects of high renewable energy share in global energy system. Renew. Energy 136, 1119–1129. doi:10.1016/j.renene.2018.09.082
Renewables (2023). ninja. Available at: https://www.renewables.ninja/.
Seck, G. S., Hache, E., Sabathier, J., Guedes, F., Reigstad, G. A., Straus, J., et al. (2022). Hydrogen and the decarbonization of the energy system in europe in 2050: a detailed model-based analysis. Renew. Sustain. Energy Rev. 167, 112779. doi:10.1016/j.rser.2022.112779
Shchetinin, D., Knezović, K., and Oudalov, A. (2023). Pipeline dynamics approximation for coordinated planning of power and hydrogen systems. Sustain. Energy, Grids Netw. 33, 100990. doi:10.1016/j.segan.2022.100990
Staffell, I., and Pfenninger, S. (2016). Using bias-corrected reanalysis to simulate current and future wind power output. Energy 114, 1224–1239. doi:10.1016/j.energy.2016.08.068
Taljegård, M., Göransson, L., Odenberger, M., and Johnsson, F. (2021). To represent electric vehicles in electricity systems modelling-aggregated vehicle representation vs. Individual driving profiles. Energies 14 (539), 539. doi:10.3390/en14030539
Toktarova, A. (2023). Electrification of the basic materials industry - implications for the electricity system [Dissertation]. Gothenburg: Chalmers University of Technology.
Toktarova, A., Göransson, L., Thunman, H., and Johnsson, F. (2022). Thermochemical recycling of plastics - modeling the implications for the electricity system. J. Clean. Prod. 374, 133891. doi:10.1016/j.jclepro.2022.133891
UNEP (2024). Cities and climate change. U. N. Environ. Programme. Available at: https://www.unep.org/explore-topics/resource-efficiency/what-we-do/cities/cities-and-climate-change (Accessed February 27, 2024).
Vattenfall (2024). Vindkraftsprojekt poseidon. Vattenfall. Available at: https://group.vattenfall.com/se/var-verksamhet/vindprojekt/poseidon (Accessed March 25, 2024).
Wang, J., Qi, An, Zhao, Y., Pan, G., Song, J., Hu, Q., et al. (2023). Role of electrolytic hydrogen in smart city decarbonization in China. Appl. Energy 336, 120699. doi:10.1016/j.apenergy.2023.120699
Wang, Y., Liu, J., and Qu, Z. (2024). Multi-stage collaborative planning of electricity-hydrogen-transportation coupling network considering carbon emission reduction. Electr. Power Syst. Res. 228, 110071. doi:10.1016/j.epsr.2023.110071
Weichenhain, U., Kaufmann, M., Benz, A., and Gomez, G. M. (2021). Hydrogen Valleys - insights into the emerging economies around the world. Luxembourg: Publications Office of the European Union. (FCH 2 JU).
Wesselink, O., Krom, A., and Agteren, M. van (2022). “Balancing hydrogen networks safely: a method for calculating linepack potential without causing integrity risk due to hydrogen-enhanced fatigue,” in 2022 14th international pipeline conference (Calgary, Alberta, Canada).
Wiginton, L. K., Nguyen, H. T., and Pearce, J. M. (2010). Quantifying rooftop solar photovoltaic potential for regional renewable energy policy. Comput. Environ. Urban Syst. 34 (4), 345–357. doi:10.1016/j.compenvurbsys.2010.01.001
Zephyr (2021). Vindpark vidar. Zephyr. Available at: https://zephyr.no/wp-content/uploads/2023/06/Bilaga-1-Samradshandling-fran-28-oktober-2021.pdf.
Keywords: hydrogen, hydrogen pipeline, industry, optimization, energy system, electrolysis, urban
Citation: Rosén S, Göransson L, Taljegård M and Lehtveer M (2024) Modeling of a “Hydrogen Valley” to investigate the impact of a regional pipeline for hydrogen supply. Front. Energy Res. 12:1420224. doi: 10.3389/fenrg.2024.1420224
Received: 19 April 2024; Accepted: 20 June 2024;
Published: 17 July 2024.
Edited by:
Muhammad Aziz, The University of Tokyo, JapanReviewed by:
Zhijie Chen, University of New South Wales, AustraliaCopyright © 2024 Rosén, Göransson, Taljegård and Lehtveer. This is an open-access article distributed under the terms of the Creative Commons Attribution License (CC BY). The use, distribution or reproduction in other forums is permitted, provided the original author(s) and the copyright owner(s) are credited and that the original publication in this journal is cited, in accordance with accepted academic practice. No use, distribution or reproduction is permitted which does not comply with these terms.
*Correspondence: Sofia Rosén, c29maWEucm9zZW5AY2hhbG1lcnMuc2U=
Disclaimer: All claims expressed in this article are solely those of the authors and do not necessarily represent those of their affiliated organizations, or those of the publisher, the editors and the reviewers. Any product that may be evaluated in this article or claim that may be made by its manufacturer is not guaranteed or endorsed by the publisher.
Research integrity at Frontiers
Learn more about the work of our research integrity team to safeguard the quality of each article we publish.