 Huanruo Qi1
 Zishuai Yang
94% of researchers rate our articles as excellent or good
Learn more about the work of our research integrity team to safeguard the quality of each article we publish.
Find out more
ORIGINAL RESEARCH article
Front. Energy Res., 03 July 2024
Sec. Smart Grids
Volume 12 - 2024 | https://doi.org/10.3389/fenrg.2024.1418893
The randomness and fluctuation of large-scale distributed photovoltaic (PV) power will affect the stable operation of the distribution network. The energy storage system (ESS) can effectively suppress the power output fluctuation of the PV system and reduce the PV curtailment rate through charging/discharging states. In order to improve the operation capability of the distribution network and PV consumption rate, an optimal multi-objective strategy is proposed based on PV power prediction. First, the back propagation (BP) neural network with an improved genetic algorithm (GA) is used to predict PV power output. Furthermore, an adaptive variability function is added to the GA to improve the prediction accuracy. Then, the distribution network model containing distributed PV and the ESS is constructed. The optimal object contains network power loss, voltage deviation, and PV consumption. The model is solved based on the improved multi-objective particle swarm optimization (MOPSO) algorithm of Pareto optimality. The probabilistic amplitude is adopted to encode the particles for avoiding local optimal. Finally, the proposed optimal strategy is verified by the IEEE 33-bus distribution network. The results show that the proposed strategy has an obvious effect on reducing the network power loss and voltage deviation, as well as improving the PV consumption rate.
In recent years, global resources and environmental issues have become increasingly severe. With the increase in photovoltaic (PV) capacity, distributed renewable energy has become a hot topic due to its advantages of environmental protection, low carbon, and low investment (Jafari et al., 2022). However, the phenomenon of PV curtailment is inevitable (Singh et al., 2021) due to source–load imbalance. The energy storage system (ESS) is an effective solution to deal with PV power fluctuation. Therefore, installation of the ESS cooperative with PV has become a valid method to solve the issue of PV curtailment. The energy management strategies of ESS for participation in optimized operation of distribution networks are studied in Murty and Kumar (2020). The capacity allocation of the ESS in the distribution network was discussed, and a two-stage optimal allocation model was provided in Jiang et al. (2021). Li et al. (2021) proposed a centralized scheduling model for the ESS participating in the distribution network penetrated with renewable energy. The objective function was minimized by optimizing costs related to active power loss and voltage deviation penalty, and the second-order cone programming method was used to simplify the problem. However, the aforementioned works focus on optimization of the ESS in the distribution network, while they did not consider the collaborative operation between PV and ESS.
Large-scale integration of PV into the distribution network will bring uncertainty and randomness. PV power prediction has been proposed to alleviate the impact of uncertainty on the power grid, as well as improve the collaborative operation capability of PV and ESS (Yang and Huang, 2018). The back propagation (BP) neural network has been widely used in the field of power forecasting research due to its advantages such as nonlinear mapping ability, self-learning and adaptability ability, and generalization ability (Liu and Huang, 2022). Considering the similarity between weather conditions and PV power generation, a new genetic algorithm–BP (GA–BP) neural network prediction model based on artificial classification was proposed (Meng et al., 2018). The existing BP neural network prediction model has a large prediction error due to the lack of a variety of numerical optimization algorithms. GA–BP and particle swarm optimization BP (PSO–BP) are used to construct the PV output prediction model and prove that its combination with the algorithm can effectively reduce the prediction error (Li et al., 2022). In Huang et al. (2022), through the quantitative analysis of PV output fluctuation and PV operating status, the PV output prediction model of the digital twin system based on the GA–BP NN algorithm was further improved in accuracy and running time compared with traditional prediction methods. Liu et al. (2023) innovatively combined the multi-layer GA–BP neural network with the AdaBoost algorithm to form the AdaBoost–GA–BP strong predictor and applied it to short-term PV prediction, proving that it had good generalization ability. In Zjavka (2020), for the problem that the numerical weather prediction system only provided rough local prediction of cloud cover each time, the differential polynomial neural network algorithm D-PNN was transformed by operational calculus, but the prediction model was limited to the clear sky index. A convolutional autoencoder prediction model was proposed to avoid the error of digital image processing technology in Fu et al. (2021). To handle the disadvantage of traditional PV power modeling methods, an ultrashort-term PV power prediction framework was proposed combining fluctuation pattern recognition in Wang et al. (2022). The aforementioned works only focused on the accuracy of PV prediction while ignoring the PV consumption strategy.
Based on the above analysis, it is necessary to add ESS devices to the PV system to reduce fluctuations and improve consumption rates. In Giglio et al. (2023), the proposed PV and ESS optimized energy management system can not only maximize the use of renewable energy but also reduce user-perceived energy prices. Shin et al. (2020) proposed a scheduling method for energy management of electric vehicle charging stations using PV and ESS, which can make full use of PV and ESS to effectively process the dynamic charging data of large-scale electric vehicles during operation. Kim et al. (2020) proposed a shared ESS operation strategy to arbitrage to maximize regional profits and reduce PV curtailment. The control algorithm of hybrid energy storage for smoothing PV power fluctuations was studied in Ma et al. (2019), and an optimization model for power scheduling of the ESS was established to improve the economy and extend energy storage life. Hu and Man (2022), aiming to solve the problem of unstable and unreasonable power consumption in complex industrial processes, proposed a two-stage optimal scheduling model, which can not only use PV to reduce carbon emissions but also use the ESS to deal with the instability of PV power generation. Ma et al. (2022) proposed a stochastic robust day-ahead scheduling method, in which air conditioning was used as a controllable load to replace part of the ESS to stabilize the fluctuation of renewable energy output, promote new energy consumption, and improve economy. Although the aforementioned works have established a complete distribution network model of PV and the ESS, the optimization algorithms have problems such as low efficiency or local convergence.
A large number of improved algorithms have been studied to solve multi-objective optimization problems (Arif et al., 2020; Chen et al., 2020; Majeed et al., 2023; Qiao et al., 2023; Wu et al., 2023) for the collaborative optimization model of PV and the ESS. Quantum PSO was used to analyze the reactive power optimization of distribution networks in Amiri (2023). The various power and energy losses during the operation of PV and ESS were considered in Wang et al. (2016). Then, a near-optimal energy storage control algorithm containing reinforcement learning mechanisms was proposed to reduce electricity costs effectively. A collaborative scheduling model for distributed PV and ESS was proposed in Li et al. (2023). The model was solved by using the PSO algorithm to achieve minimized node voltage deviation and limit generator peak power. A solar wind hybrid with double energy storage model was established in Guo et al. (2023), and a multi-objective planning strategy was proposed to solve the objective function through multi-objective PSO (MOPSO). In Baghaee et al. (2016), the annualized cost, expected load loss, and expected energy loss of the system were taken as three objectives, and a MOPSO algorithm with an external archiving mechanism was used to solve the problem. Simulation analysis was conducted in different scenarios to verify the superiority of the proposed algorithm. This algorithm was used in Ghorbani et al. (2017) to optimize wind solar electric hybrid systems to achieve cost reduction and reliability improvement.
In summary, the above research studies mainly focus on the direct combination of the traditional numerical optimization algorithm and BP neural network, ignoring the traditional algorithm’s limitations of falling into a local optimal solution. When dealing with the multi-objective solution of the system, the traditional algorithm has slow search ability and is prone to local convergence problems. In this paper, an improved multi-objective optimization strategy for PV power prediction has been proposed based on the improved GA–BP neural network, which is suitable for the distribution network with distributed PV and the ESS. The balance of network power loss, voltage deviation, and PV consumption rate is realized, and the operation ability and PV consumption level of the system are significantly improved.
The main innovations and contributions of this study are as follows: 1) the traditional GA is improved by the adaptive mutation rate, and the BP neural network is trained as a predictor to form an improved PV power output prediction model of the GA–BP neural network, which effectively realizes the complementary advantages of the two algorithms. 2) A multi-objective optimization model of the distribution network is established. The objectives of the optimization model are active power loss cost, voltage deviation, and PV consumption rate, and the balance and optimization among the three objectives are realized. 3) An improved MOPSO algorithm is proposed. The probabilistic amplitude coding method is used to obtain the spatial position of the particles, and the traversal speed and search ability of the solution space are accelerated. The algorithm solves the local convergence problem and improves the solution speed on the basis of traditional real coding.
The BP neural network is a multilayer feedforward neural network based on error BP theory, which generally includes the input layer, hidden layer, and output layer. The BP neural network can significantly improve prediction accuracy in the face of random factors. It can be achieved to adaptive results through deeper learning and sampling training. It can reduce the impact of the error caused by randomness by applying this method to renewable energy and load forecasting. The topology structure of the BP network is shown in Figure 1. The input variables of the model are environmental data and historical data of renewable energy, and the output variable is the predicted renewable energy output data.
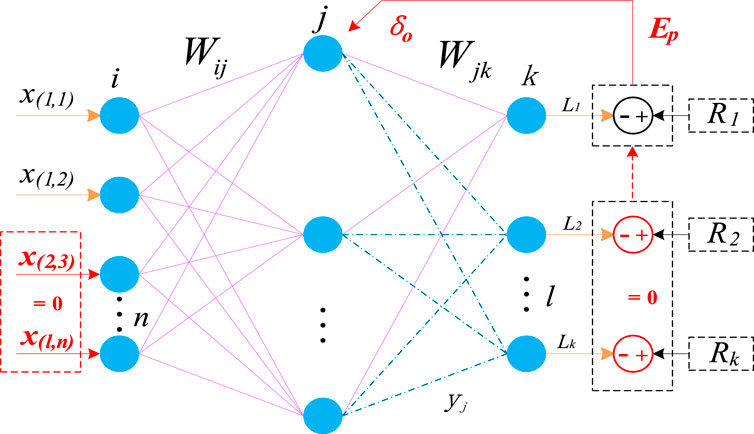
Figure 1. Topology structure of the BP neural network.
The number of input, hidden, and output layers in the model is set to 1. The fastest descent is used as the default calculation method. The weight adjustment of the BP neural network is presented in Eq. (1):
where
The weight update strategy is given in Eq. (3):
where
The prediction of traditional BP neural networks is trained based on known values for renewable energy sources such as PV with random fluctuation characteristics. The weights and thresholds are obtained during initialization. Therefore, the random characteristics of the above variables are not satisfied. The GA can effectively optimize weights and thresholds to avoid getting stuck in local optimal solutions (Maleki et al., 2021). An adaptive mutation rate will be used for improving the computational speed of GAs. The threshold and weight calculation of the improved GA–BP neural network can be used to avoid the occurrence of local minima in the results due to improper initial value selection. The algorithm steps are as follows:
Step 1: Encode the initial weights, thresholds, and smoothing factors of the neural network by using real number encoding.
Step 2: Initialize the population size and define fitness function
Step 3: The preserved selection method is used for selection to prioritize individuals with higher fitness for inheritance.
Step 4: Individuals use real number crossover for operations by using real number encoding. The crossover function is presented in Eq. (5):
Step 5: Improve the local search ability of GAs by adding mutation operations to maintain population diversity and avoid premature convergence. The equation is described in Eq. (6).
where
Step 6: Decode the final encoding to output the optimal solution by determining whether the optimal value can be reached and stop evolution if the conditions are met.
The improved GA–BP algorithm process is shown in Figure 2.

Figure 2. Improved GA–BP algorithm flowchart.
This paper aims to minimize active power loss and voltage deviation and maximize PV consumption to improve the operational efficiency of the distribution network. A multi-objective optimization model for the distribution network is established with a time step of 24 h a day. Furthermore, it is also considered for the integration of load and energy storage into the distribution network with setting constraints for each variable. The objective function of active power loss is given in Eq. (7):
where
The voltage stability is measured by the sum of squared voltage deviations of each node in the distribution network. The voltage index function is given in Eq. (8):
where
In order to achieve the highest PV consumption capacity in the distribution network, the objective function is given in Eq. (9):
where
a) Power flow constraint: The voltage of the load node must satisfy the balance of active and reactive power. The balance of power flow constraint is given in Eq. (10):
where
b) ESS power constraint: The ESS adopts constant power for charging and discharging. The output power constraint is given in Eq. (11):
where
c) PV power output constraints: The PV output is related to the panel area and solar irradiance. The power output constraint of PV is given in Eq. (12):
where
d) Static var compensator SVC constraints: The reactive power compensator is used to regulate the reactive power distribution of the distribution network. The operating constraint is given in Eq. (13):
where
e) On-load tap changer (OLTC) model constraints: The on-load regulating transformers can change the output voltage by adjusting the position of the tap to ensure the voltage of the distribution network at an appropriate level. The operating constraints are given in Eqs (14), (15):
where
f) Capacitor (CB) model constraints: The CB can improve the reactive power optimization of the distribution network. The operating constraint is given in Eq. (16):
where
Pareto solutions first appeared in game theory. The solution will sacrifice other objective values when optimizing the objective value of a solution in a model (Raut and Mishra, 2021). Ultimately, each objective function can be optimized without discrimination.
We assume there are
1) For
2) At least one objective function
If there is a solution set
The PSO algorithm simulates the information exchange behavior within a population in nature by designing massless particles. At the same time, it only endows particles with the simplest movement behavior to achieve the goal of solving intelligent optimization problems. The calculation for optimization iteration for each particle are given in Eq. (17) and Eq. (18):
where
Traditional PSO algorithms generally use real number encoding. Each particle can only correspond to one position in space, which may lead to local optimal solutions. The decision variables of the optimization model include continuous variables and discrete variables. The discrete variables include OLTC degree and operation group number of CB. The continuous variables include ESS charging and discharging power and SVC compensation capacity. The matrix of decision variables composed of mixed encoding of real numbers and integers is given in Eq. (19):
where
For each decision variable in
where
In order to avoid the problem of getting stuck in local optimal solutions during traditional PSO coding, probability amplitude is used as the current position for encoding of particles. The probability amplitude encoding method can obtain two positions in the solution space at the same time. It can also enhance the traversal of the solution space. Therefore, the probability amplitude encoding method can effectively improve the search ability of the algorithm. The encoding method are given in Eq. (21) and Eq. (22):
where
The particle updating method for multi-objective problems are presented in Eqs (23)–(25):
where
The improved MOPSO algorithm uses the dominance relationship between particles to find the historical optimal solution. Then, the non-inferior solution set is updated by using the Pareto mechanism. At the same time,
where
The MOPSO algorithm is used for solving. The flowchart is shown in Figure 3. The specific steps are as follows:
Step 1: Initialize the distribution network and various equipment parameters, set the maximum number of iterations, initialize the population, and use the objective function obtained by the initialized particles as the initial optimal solution for each particle.
Step 2: Update the speed, position, and weight of each particle by using the improved optimization algorithm.
Step 3: Calculate the fitness of each particle and update the individual optimal solution. Calculate the active power loss, voltage deviation, and PV consumption rate.
Step 4: Calculate the distance between particles and eliminate individuals with smaller fitness within a certain distance range. Sort the new population and save the top
Step 5: Determine whether the iteration is completed based on the maximum number of iterations. Output the Pareto optimal solution set when completed. Otherwise, return to step 2.
Step 6: Update the Pareto solution set and calculate the satisfaction of each result in the Pareto optimal solution set. Select the particle with the highest satisfaction as the global optimal particle.
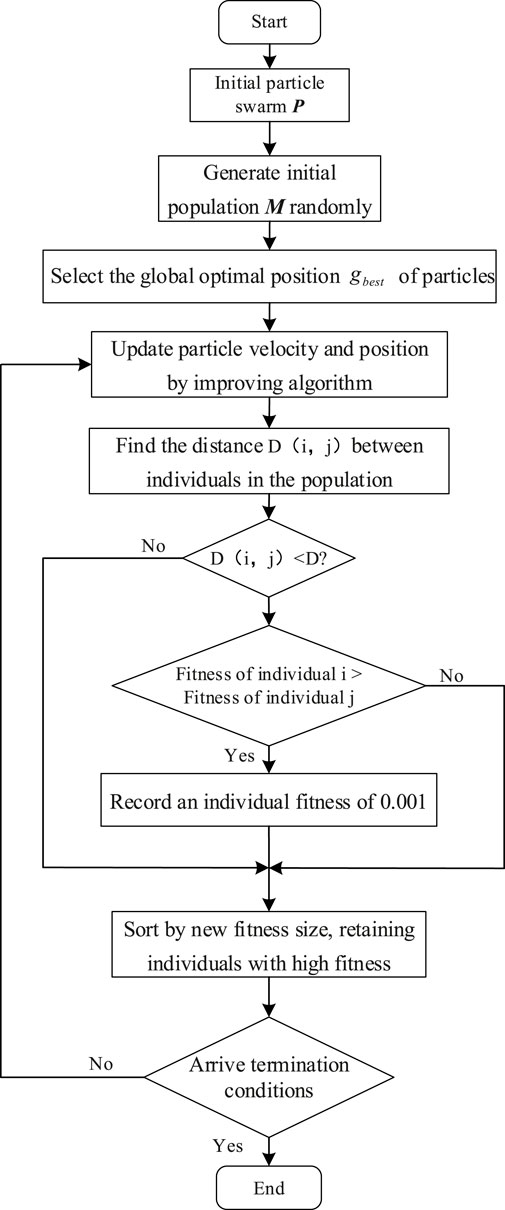
Figure 3. Flowchart of the proposed process.
In order to verify the effectiveness of the proposed optimization algorithm, simulation analysis was conducted based on MATLAB 2019a. The simulation verification was used by the IEEE 33-bus distribution network. The system structure is shown in Figure 4. The calculation results are all standard values, with a reference voltage of 12.66 kV and an initial voltage of 1.00 p.u at each node. Distributed PV units are connected to the distribution network through node 21, and distributed energy storage is connected through node 17. The rated capacity of PV units is 50 kW, and the rated capacity of energy storage units is 25 kW. The time period is 24 h per day, and the initial SOC is set to 0.4. The SVCs are set at nodes 2, 5, and 21, respectively, and the CB are set at nodes 10 and 24.
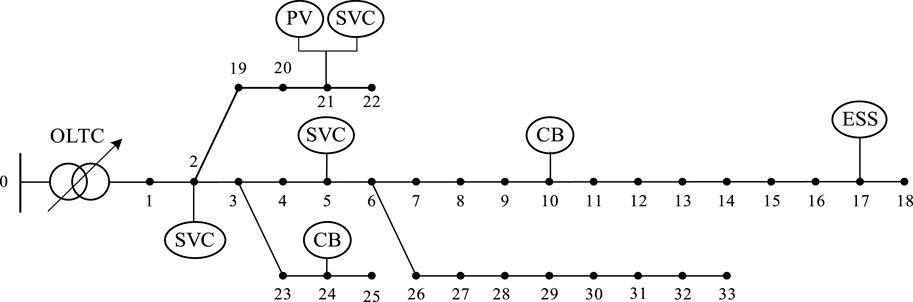
Figure 4. IEEE33 distribution network.
In this paper, 24,000 sets of continuous data from a PV power station in spring/autumn, summer, and winter of 2022 are selected for GA–BP training and testing. All data are randomly shuffled to break the temporal correlation of training data. A total of 21,000 sets of data are selected for training, and the remaining 3,000 sets of data are used as the test set. The variables for each data set include temperature, humidity, and solar irradiance. The length of the test period is 24 h. The relative parameters of the BP neural network are set at first, the maximum training frequency is 100 times, and the learning rate is set to 0.1. Then, the relevant parameters of the GA are set as follows: the population size is 10, the number of genetic iterations is 30, and the crossover probability is 0.2. The prediction results in different seasons using the improved GA–BP neural network are shown in Figure 5.
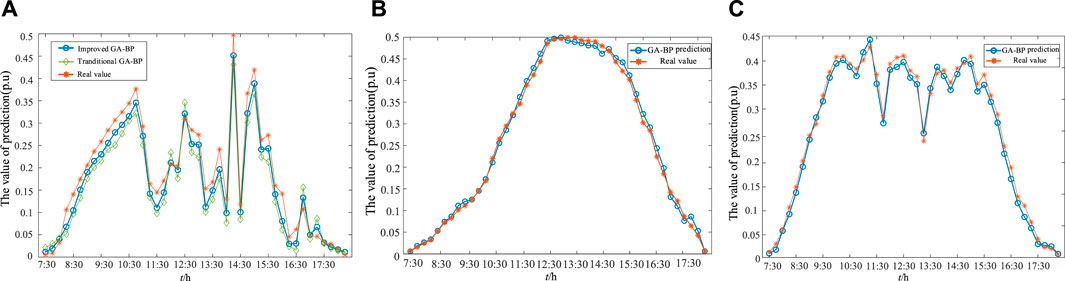
Figure 5. GA–BP PV power prediction in (A) spring/autumn, (B) summer and (C) winter.
The accuracy of prediction can be measured by the error rate in short-term prediction by using the GA–BP the neural network:
where
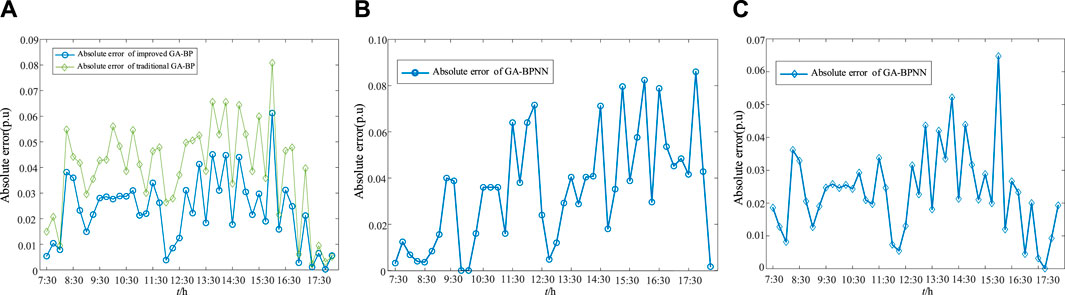
Figure 6. Absolute error under GA–BP neural network prediction in (A) spring/autumn, (B) summer and (C) winter.
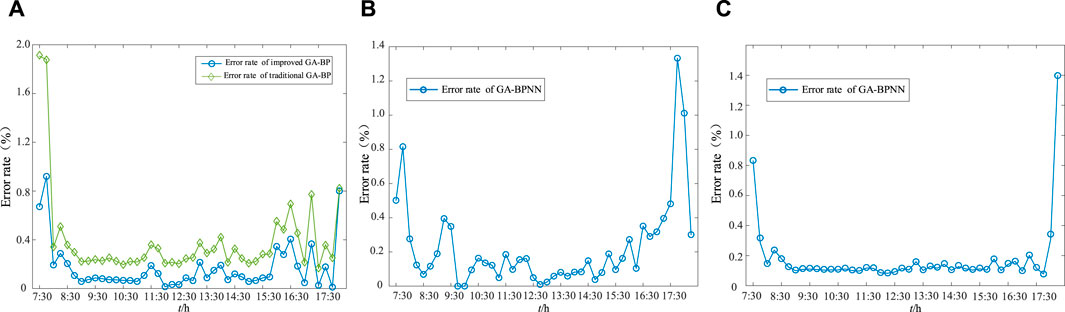
Figure 7. Error rates under GA-BP neural network prediction in (A) spring/autumn, (B) summer and (C) winter.
There will be a phenomenon of PV curtailment when PV units are added to the distribution network. In order to significantly reduce the PV curtailment rate, add the ESS into the system and combine optimization algorithms to improve the operational capacity of the distribution network. The PV output power predicted by the GA–BP neural network algorithm and the load power are shown in Figure 8. It can be seen that distributed PV start to output at 8 a.m. and reach their highest point of output at noon. During night and early morning periods, the PV will not supply power output. The optimized output of PV and ESS is shown in Figure 9. It can be seen that the optimized output curve of PV is relatively smooth. The energy storage device operates 24 h a day. Although the daytime PV output is high, the energy storage device operates in the charging mode. Although the PV power is not output at night, the energy storage operates in the discharge mode. The overall output power curve is smoother than the PV power curve without the ESS. Although the PV output is at its maximum, the energy storage charging power is at its maximum. Due to the inability of PV power generation at night, energy storage releases the stored electricity during the day for power supply. Light fluctuations are effectively suppressed according to energy storage devices, and the PV consumption rate reached 74.37%.
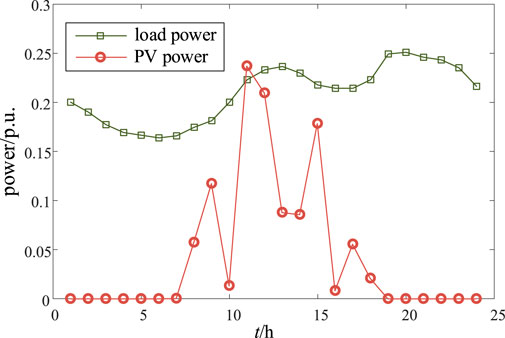
Figure 8. PV and load power output.
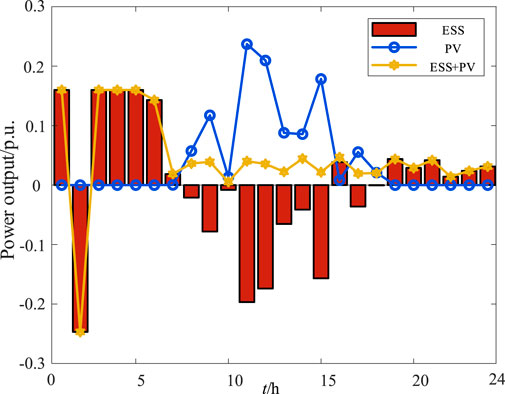
Figure 9. Power output of PV and ESS optimization.
The objectives of minimizing network active power loss, minimizing voltage deviation, and maximizing PV consumption in the distribution network are solved by using the improved MOPSO algorithm. The comparison of algorithm convergence is shown in Figure 10. It is shown that the improved MOPSO proposed in this paper has higher convergence speed and better optimization effect. The Pareto solution set is shown in Figure 11. It can be known that the distribution of the Pareto solution set is relatively concentrated, and the convergence of the solution is satisfied. Any point in the solution set can achieve the above optimization objectives. The determined optimal solution is marked in Figure 11 with 0.407 p.u. active power loss, 1.04 p.u. voltage deviation, and 69.5% PV consumption rate.

Figure 10. Comparison of algorithm convergence.
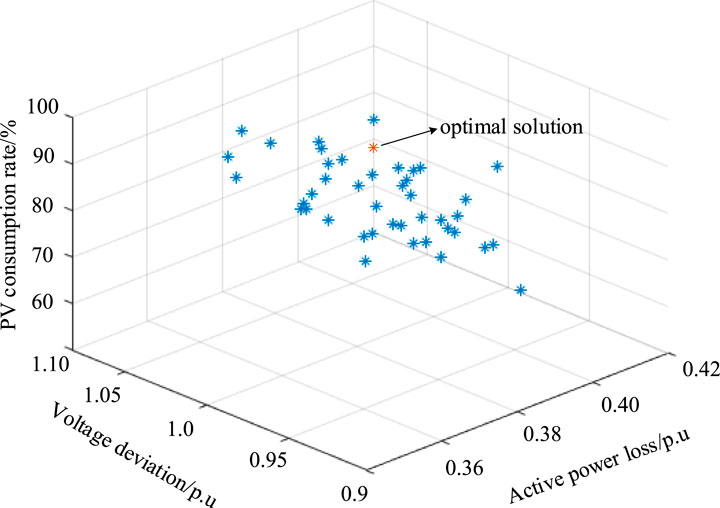
Figure 11. Optimal leading edge of the Pareto solution set.
A comparison of distribution network loss and voltage deviation before and after optimization is shown in Figures 12, 13 to demonstrate the effectiveness of the proposed algorithm. The optimized voltage and network loss are improved compared to the situation before optimization. The distribution network loss is shown in Figure 12. It can be seen that the optimized network loss has significantly improved within 24 h of operation. The network loss before optimization is lower at night, but it will reach a maximum of 0.44
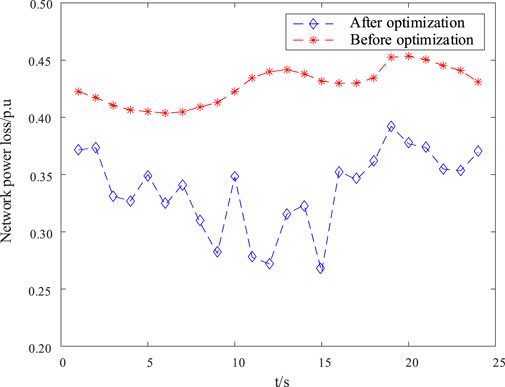
Figure 12. Comparison of distribution network losses before and after optimization.
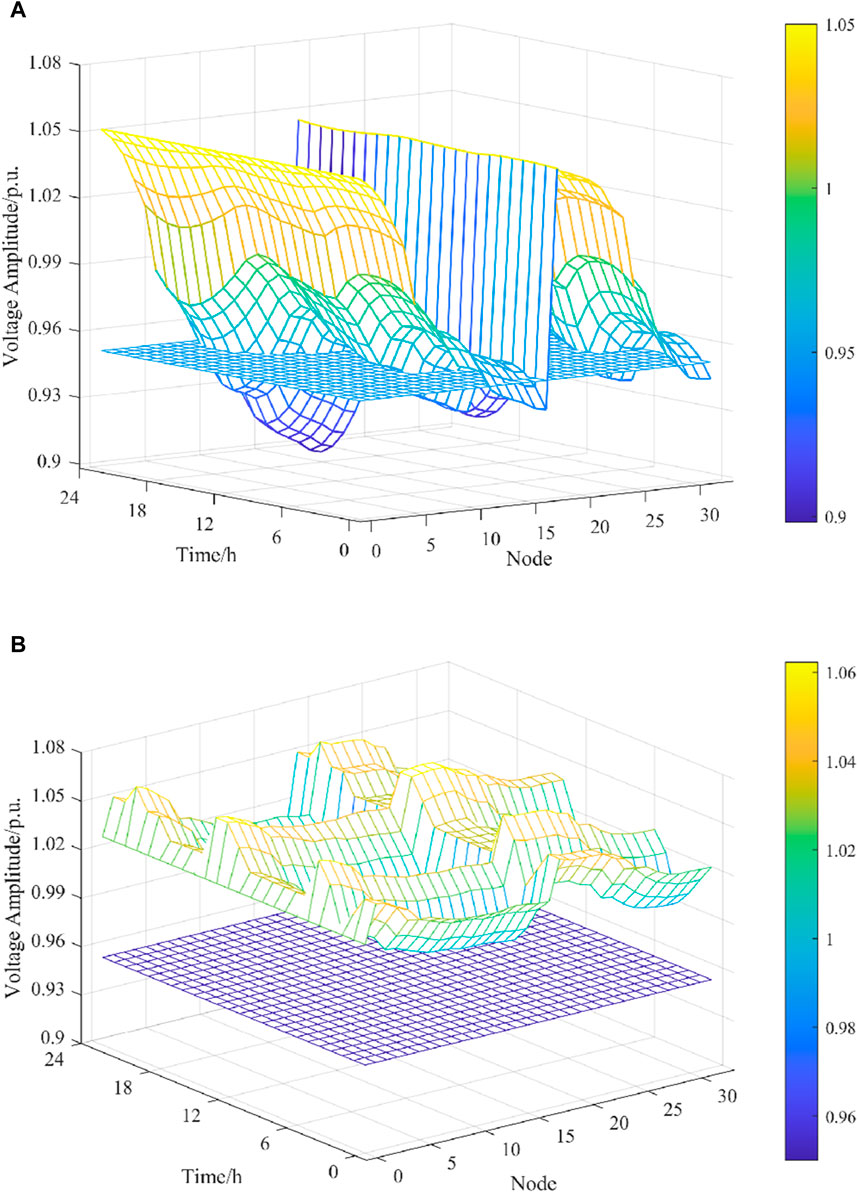
Figure 13. Voltage of distribution network nodes (A) before optimization and (B) after optimization.
The voltage amplitude of the nodes before optimization is shown in Figure 13A. The voltage deviation of the nodes before optimization is large. Moreover, there will be situations where the voltage exceeds the lower limit. The lowest voltage will reach less than 0.90
A multi-objective optimization model is established, and an improved MOPSO algorithm is proposed for the distribution network with distributed PV and ESS based on PV power prediction. In response to the problem of poor prediction accuracy in traditional algorithms, the GA–BP neural network is adopted for PV power prediction. The prediction accuracy is enhanced by improving the mutation function. The distribution network model is constructed with distributed PV, energy storage, and power compensation devices. Then, the model can be solved by using an improved MOPSO algorithm based on Pareto optimality. The probability amplitude is adopted in solving the algorithm as the current position encoding of particles to avoid getting stuck in local optimal solution and improve global search speed. The results show that the maximum error rate of improved PV power prediction is less than 1%, which can precisely track on PV power output. The network loss can be reduced by 29.55% according to the proposed optimization strategy, and the voltage off-limit phenomenon is eliminated. The voltage range can change to 0.98–1.06
The original contributions presented in the study are included in the article/Supplementary Material; further inquiries can be directed to the corresponding author.
HQ: writing–original draft. XY: writing–review and editing. YK: writing–review and editing. ZY: writing–review and editing. SM: writing–review and editing. YM: writing–review and editing.
The author(s) declare that financial support was received for the research, authorship, and/or publication of this article. This work is supported by Project of State Grid Henan Economic Research Institute (No. SGHAYJ00SJJS2310140).
Authors HQ, XY, and YK were employed by State Grid Corporation of China.
The remaining authors declare that the research was conducted in the absence of any commercial or financial relationships that could be construed as a potential conflict of interest.
All claims expressed in this article are solely those of the authors and do not necessarily represent those of their affiliated organizations, or those of the publisher, the editors, and the reviewers. Any product that may be evaluated in this article, or claim that may be made by its manufacturer, is not guaranteed or endorsed by the publisher.
Amiri, H. (2023). “Analysis and comparison of reactive power optimization using improved genetic algorithm and improved quantum particle swarm algorithm in an active distribution network,” in 2023 8th International Conference on technology and energy management (ICTEM), Babol, Iran, February 8–9, 2023 (IEEE), 1–4.
Arif, S. M., Hussain, A., Lie, T. T., Muhammad Ahsan, S., and Abbas Khan, H. (2020). Analytical hybrid particle swarm optimization algorithm for optimal siting and sizing of distributed generation in Smart grid. J. Mod. Power Syst. Clean Energy 8 (8), 1221–1230. doi:10.35833/mpce.2019.000143
Baghaee, H. R., Mirsalim, M., Gharehpetian, G. B., and Talebi, H. (2016). Reliability/cost-based multi-objective pareto optimal design of stand-alone wind/PV/FC generation microgrid system. Energy 115 (1), 1022–1041. doi:10.1016/j.energy.2016.09.007
Chen, Q., Wang, W., Wang, H., Wu, J., and Wang, J. (2020). An improved beetle swarm algorithm based on social learning for a game model of multi-objective distribution network reconfiguration. IEEE Access 8 (8), 200932–200952. doi:10.1109/access.2020.3035791
Fu, Y., Chai, H., Zhen, Z., Wang, F., Xu, X., Li, K., et al. (2021). Sky image prediction model based on convolutional auto-encoder for minutely solar PV power forecasting. IEEE Trans. Industry Appl. 57 (57), 3272–3281. doi:10.1109/tia.2021.3072025
Ghorbani, N., Kasaeian, A., Toopshekan, A., Bahrami, L., and Maghami, A. (2017). Optimizing a hybrid wind- PV- battery system using GA-PSO and MOPSO for reducing cost and increasing reliability. Energy 154 (1), 581–591. doi:10.1016/j.energy.2017.12.057
Giglio, E., Luzzani, G., Terranova, V., Trivigno, G., Niccolai, A., and Grimaccia, F. (2023). An efficient artificial intelligence energy management system for urban building integrating photovoltaic and storage. IEEE Access 11 (11), 18673–18688. doi:10.1109/access.2023.3247636
Guo, S., Kurban, A., He, Y., Wu, F., Pei, H., and Song, G. (2023). Multi-objective sizing of solar-wind-hydro hybrid power system with doubled energy storages under optimal coordinated operational strategy. CSEE J. Power Energy Syst. 9 (6), 2144–2155. doi:10.17775/CSEEJPES.2021.00190
Hu, Y., and Man, Y. (2022). Two-stage energy scheduling optimization model for complex industrial process and its industrial verification. Renew. Energy 193 (193), 879–894. doi:10.1016/j.renene.2022.05.064
Huang, Y., Chen, S., Tan, X., Hu, T., and Zhang, C. (2022). “Power prediction method of distributed photovoltaic digital twin system based on GA-BP,” in 2022 4th international conference on electrical engineering and control technologies (CEECT), Shanghai, China, December 16–18, 2022 (IEEE), 241–245.
Jafari, M. R., Parniani, M., and Ravanji, M. H. (2022). Decentralized control of OLTC and PV inverters for voltage regulation in radial distribution networks with high PV penetration. IEEE Trans. Power Deliv. 37 (06), 4827–4837. doi:10.1109/tpwrd.2022.3160375
Jiang, X., Chen, J., Zhang, W., Wu, Q., Zhang, Y., and Liu, J. (2021). Two-step optimal allocation of stationary and mobile energy storage systems in resilient distribution networks. J. Mod. Power Syst. Clean Energy 9 (4), 788–799. doi:10.35833/mpce.2020.000910
Kim, D., Kim, H., and Won, D. (2020). Operation strategy of shared ESS based on power sensitivity analysis to minimize PV curtailment and maximize profit. IEEE Access 8, 197097–197110. doi:10.1109/access.2020.3034339
Li, X., Wang, L., Yan, N., and Ma, R. (2021). Cooperative dispatch of distributed energy storage in distribution network with PV generation systems. IEEE Trans. Appl. Supercond. 31 (08), 1–4. doi:10.1109/tasc.2021.3117750
Li, Y., Xiao, X., Huang, B., Cai, Y., Ye, Y., and Zhi, J. (2023). “Multi-timescale optimization of distribution network with distributed photovoltaic and energy storage through coordinated operation,” in 2023 Panda Forum on Power and Energy (PandaFPE), Chengdu, China, April 27–30, 2023 (IEEE), 113–118.
Li, Y., Zhou, L., Gao, P., Yang, B., Han, Y., and Lian, C. (2022). Short-term power generation forecasting of a photovoltaic plant based on PSO-BP and GA-BP neural networks. Front. Energy Res. 9, 824691. doi:10.3389/fenrg.2021.824691
Liu, C., and Huang, Y. (2022). “Short term photovoltaic power prediction based on BP neural network optimized by improved sparrow search algorithm,” in 2022 4th international academic exchange conference on science and technology innovation (IAECST), Guangzhou, China, December 9–11, 2022 (IEEE), 314–317.
Liu, Y., He, X., Duan, S., and Wang, S. (2023). “Short-term PV power prediction model based on weather feature clustering and Adaboost-GA-BP,” in 2023 35th Chinese control and decision conference (CCDC), 1306–1312.
Ma, W., Wang, W., Wu, X., Hu, R., Tang, F., and Zhang, W. (2019). Control strategy of a hybrid energy storage system to smooth photovoltaic power fluctuations considering photovoltaic output power curtailment. Sustainability 11 (5), 1324–1345. doi:10.3390/su11051324
Ma, Y., Xu, W., Yang, H., and Zhang, D. (2022). Two-stage stochastic robust optimization model of microgrid day-ahead dispatching considering controllable air conditioning load. Int. J. Electr. Power and Energy Syst. 141, 108174. doi:10.1016/j.ijepes.2022.108174
Majeed, M. A., Phichaisawat, S., Asghar, F., and Hussan, U. (2023). Optimal energy management system for grid-tied microgrid: an improved adaptive genetic algorithm. IEEE Access 11, 117351–117361. doi:10.1109/access.2023.3326505
Maleki, N., Zeinali, Y., and Niaki, S. T. A (2021). A k-NN method for lung cancer prognosis with the use of a genetic algorithm for feature selection. Expert Syst. Appl. 164, 113981–114148. doi:10.1016/j.eswa.2020.113981
Meng, X., Xu, A., Zhao, W., Wang, H., Li, C., and Wang, H. (2018). “A new PV generation power prediction model based on GA-BP neural network with artificial classification of history day,” in 2018 international conference on power system technology, Guangzhou, China, November 6–8, 2018 (IEEE), 1012–1017.
Murty, V. V. S. N., and Kumar, A. (2020). Multi-objective energy management in microgrids with hybrid energy sources and battery energy storage systems. Prot. Control Mod. Power Syst. 5, 1–20. doi:10.1186/s41601-022-00229-y
Qiao, W., Han, Y., Si, F., Li, K., Wang, J., and Zhao, Q. (2023). Optimal economic-emission scheduling of coupled transportation and power distribution networks with multi-objective optimization. IEEE Trans. Industry Appl. 59 (4), 4808–4820. doi:10.1109/TIA.2023.3261864
Raut, U., and Mishra, S. (2021). A new Pareto multi-objective sine cosine algorithm for performance enhancement of radial distribution network by optimal allocation of distributed generators. Evol. Intell. 14 (4), 1635–1656. doi:10.1007/s12065-020-00428-2
Shin, M., Choi, D. H., and Kim, J. (2020). Cooperative management for PV/ESS-enabled electric vehicle charging stations: a multiagent deep reinforcement learning approach. IEEE Trans. Industrial Inf. 16 (05), 3493–3503. doi:10.1109/tii.2019.2944183
Singh, B., Kumar, N., and Panigrahi, B. K. (2021). Steepest descent Laplacian regression based neural network approach for optimal operation of grid supportive solar PV generation. IEEE Transaction Circuits Syst. 68 (6), 1947–1951. doi:10.1109/tcsii.2020.2967106
Wang, F., Li, J., Zhen, Z., Wang, C., Ren, H., Ma, H., et al. (2022). Cloud feature extraction and fluctuation pattern recognition based ultrashort-term regional PV power forecasting. IEEE Trans. Industry Appl. 58 (5), 6752–6767. doi:10.1109/tia.2022.3186662
Wang, Y., Lin, X., and Pedram, M. (2016). A near-optimal model-based control algorithm for households equipped with residential photovoltaic power generation and energy storage systems. IEEE Trans. Sustain. Energy 7 (1), 77–86. doi:10.1109/tste.2015.2467190
Wu, X., Li, C., Jiang, J., Sun, A., and Zhang, Q. (2023). “Distribution network Reconfiguration based on improved particle swarm optimization algorithm,” in 2023 IEEE 7th information technology and mechatronics engineering conference (ITOEC), Chongqing, China, September 15–17, 2023 (IEEE), 971–975.
Yang, M., and Huang, X. (2018). Ultra-short-term prediction of photovoltaic power based on periodic extraction of PV energy and LSH algorithm. IEEE Access 6, 51200–51205. doi:10.1109/access.2018.2868478
Keywords: genetic algorithm–back propagation neural network, photovoltaic power prediction, energy storage systems, distribution network, multi-objective particle swarm optimization
Citation: Qi H, Yan X, Kang Y, Yang Z, Ma S and Mi Y (2024) Multi-objective optimization strategy for the distribution network with distributed photovoltaic and energy storage. Front. Energy Res. 12:1418893. doi: 10.3389/fenrg.2024.1418893
Received: 17 April 2024; Accepted: 03 June 2024;
Published: 03 July 2024.
Edited by:
Pasquale De Falco, University of Naples Parthenope, ItalyReviewed by:
Antonio Bracale, University of Naples Parthenope, ItalyCopyright © 2024 Qi, Yan, Kang, Yang, Ma and Mi. This is an open-access article distributed under the terms of the Creative Commons Attribution License (CC BY). The use, distribution or reproduction in other forums is permitted, provided the original author(s) and the copyright owner(s) are credited and that the original publication in this journal is cited, in accordance with accepted academic practice. No use, distribution or reproduction is permitted which does not comply with these terms.
*Correspondence: Siyuan Ma, bWFzeTE5OTZAMTYzLmNvbQ==
Disclaimer: All claims expressed in this article are solely those of the authors and do not necessarily represent those of their affiliated organizations, or those of the publisher, the editors and the reviewers. Any product that may be evaluated in this article or claim that may be made by its manufacturer is not guaranteed or endorsed by the publisher.
Research integrity at Frontiers
Learn more about the work of our research integrity team to safeguard the quality of each article we publish.