
94% of researchers rate our articles as excellent or good
Learn more about the work of our research integrity team to safeguard the quality of each article we publish.
Find out more
ORIGINAL RESEARCH article
Front. Energy Res., 04 July 2024
Sec. Smart Grids
Volume 12 - 2024 | https://doi.org/10.3389/fenrg.2024.1418833
This article is part of the Research TopicLearning-assisted Diagnosis and Control of Electric Distribution NetworkView all 12 articles
 Wang Qian1,2*
 Li Yuquan2Wang Xiaohui3Yang Kun1Liu Yang1Xia Zhongyuan3Lan Guangyu3Liu Yunlong3Tang Jiyuan1
Voltage instability, power imbalance, and unreliability are caused mainly by equipment failure in the distribution system, so it is important to accurately and quickly assess the status of distribution network equipment. However, it is challenging to detect equipment failures, the traditional XGBoost algorithm is unsuitable because some evaluation indices are incompetent to quantify. To address these issues, we propose a fast evaluation method for the state of electrical distribution equipment based on fuzzy decision-making. Firstly, key indices are selected from the multi-source equipment information. Secondly, this paper constructs the mapping between key indices and equipment status scores by combining the fuzzy iterative method and the XGBoost algorithm. Finally, the proposed assessment model is confirmed by using the distribution transformers as an example. The result shows that the proposed multi-source information assessment method can quickly and accurately determine the operation status of electrical distribution equipment, and the proposed method has better accuracy than the traditional method.
With social and economic development, the scale of the power grid is gradually expanding, prompting higher reliability requirements. The distribution network is an essential part of the power system. It is responsible for the critical task of supplying power directly to customers (Liang et al., 2009). At the same time, the clear aims of operational status analysis improving the reliability of the power supply. It is an integral part of operations and maintenance in the power system (Guan, 2022). Through testing and evaluating equipment such as distribution transformers (DTs) and circuit breakers, system operators can ensure the safe and stable operation of distribution equipment and improve the economy of power supply companies.
In the research on equipment evaluation, there is more research on primary equipment such as generators, transformers, circuit breakers, etc., and less on medium- and low-voltage equipment. Most of them are limited to studying the remaining life of power transformers, and the distribution equipment still needs to form a set of quantitative evaluation methods (Fang et al., 2023). However, the location dispersion, the large amount of monitoring data, and the lack of uniform evaluation standards have brought significant challenges in assessing equipment status (Yuan et al., 2019; Tamma et al., 2021).
The transformer is the main equipment for distributing power and transforming voltage to a wide range of customers, and people have always valued it (Guo and Liu, 2005). Methods such as fuzzy evaluation and artificial intelligence are widely used in transformer status assessment (Zhu et al., 2008; Xie et al., 2012; Chen, 2017; Zhou et al., 2020; Lv, 2022). Zhou et al. proposed a transformer condition assessment method based on an interval grey number dynamic grey target (Lv, 2022). The accuracy of the proposed transformer condition assessment method is verified by integrating the dynamic changes of transformer operation data and index information in multi-dimensional time phases. Zhu et al. used the transformer oil chromatography data as the operational condition assessment index, proposed a new method to transform the qualitative indexes into quantitative indexes, and finally used the obtained assessment results as the training set of the SVM and obtained the transformer’s status level (Xie et al., 2012). However, the model consideration is relatively single, and the assessment results are not accurate. Reference (Zhou et al., 2020) studied the power transformer condition evaluation index system in depth, as well as the calculation method and model of the transformer health index based on fuzzy logic. Reference (Chen, 2017) established an insulation state evaluation system and proposed a transformer insulation state evaluation method based on fuzzy cloud theory. The affiliation degree cloud model was utilized to describe its fuzziness and randomness. Zhe et al. applied a conventional approach to evaluate transformers’ condition and introduced a condition assessment model using support vector regression. However, this method heavily relies on the size of the transformer’s sample capacity (Zhu et al., 2008). References (Ahmad and Senroy, 2020; Zhang et al., 2020) proposed a cloud model for transformer condition assessment considering the randomness of the data and the ambiguity of the evaluation level, which successfully realized the transformation between qualitative and quantitative indicators. Zhang et al. proposed a condition assessment index system based on the transformer test category, and the evaluation level was divided by solving the relative deterioration of the index. Finally, the confidence criterion was introduced for comprehensive judgment (Zhang et al., 2010). The model is more subjective, and new solutions need to be proposed to reduce the interference of human factors in the model. Zheng et al. introduced the grey assessment decision theory (Wang et al., 2012), but the index system was not comprehensive enough to consider the data of all the transformer components, and the results were more one-sided and lacked persuasive power.
The current evaluation method for distribution network equipment is not comprehensive. It lacks a quantitative assessment method and is greatly influenced by subjective factors, such as the experts’ experience. Therefore, it is important to establish an assessment method that better aligns with the actual operating conditions of the electrical distribution equipment. The proposed method allows for the assessment of distribution transformers, providing a valuable reference for the economic and operational reliability of power system operators.
In this paper, we propose a state assessment model for distribution network equipment. This model integrates multi-source information derived from the operational data of the equipment, taking into account critical state variables. To establish the relationship between the multi-sources information and the equipment’s state, we utilize a data-driven fuzzy iterative method and the XGBoost algorithm. This enables a more accurate evaluation of the equipment’s condition. Additionally, the paper introduces a method for multi-source information to assess the operation status of distribution equipment, using DTs as an example. This method effectively determines the equipment’s operation status by leveraging various types of information, offering a more comprehensive evaluation compared to other approaches.
There are five categories of key equipment for the distribution network, which are DTs, switchgear, cables, overhead lines, and pole-mounted switches. During operation, a large amount of data is generated, including real-time and historical data, hardware information, and environ-mental conditions. To accurately determine the operating status of equipment, it is necessary to process data and extract key condition indicators that characterize the equipment’s operation. Establishing a scientific and comprehensive evaluation system for condition indicators is significant for the status evaluation of distribution network equipment.
DT is an important equipment in the distribution network, and its operation status is closely related to the reliability of the power supply. The Table A1 in the appendix displays various types of faults in DT, including insulation, short-circuit, discharge, and mechanical drive operating mechanism faults. Since the DTs used in industry and large users are mainly step-down transformers and mostly oil-immersed transformers, the condition indicators in Table A1 are selected and classified according to the principle of selecting key condition indicators by referring to standards such as “Guidelines for Condition Evaluation of Equipment in Distribution Networks” (State Grid Corporation, 2011), and the results are shown in Table 1.
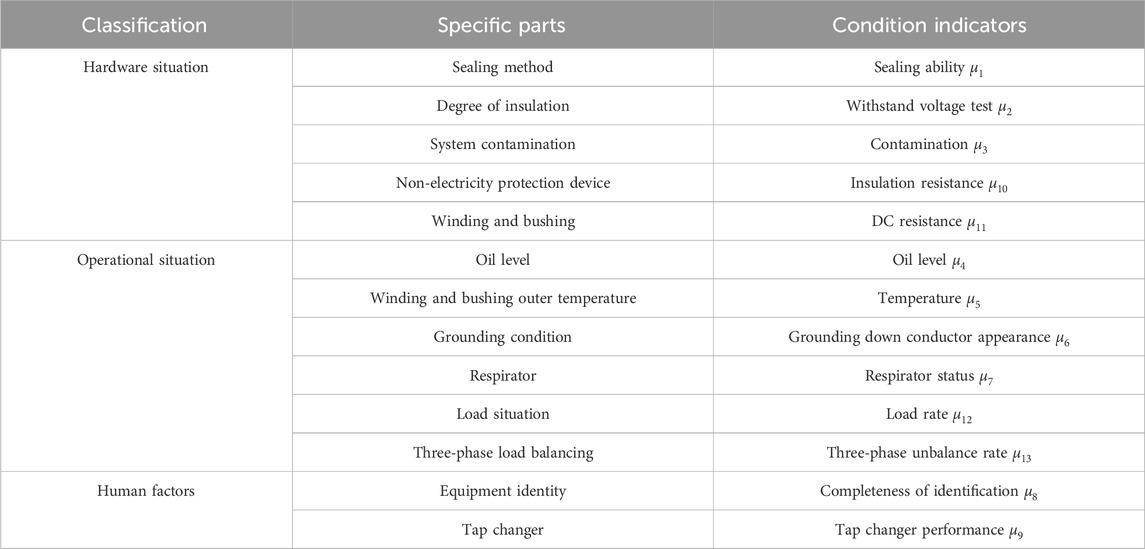
Table 1. Classification of key state variables of DT.
Once the condition indicators are selected, it is necessary to score them to further evaluate the state of the DT. According to the uniform regulations, the evaluation principles for each condition indicators are shown in the third column of Table 1. Before evaluation, the condition indicators of the transformer shown in Table 1 need to be normalized due to their qualitative and quantitative indicators varying in orders of magnitude and dimensions. The condition indicators that makes the status of the equipment better when the value gets smaller or lower, such as winding DC resistance and oil temperature, are processed by Eq. 1; The state quantities (withstand voltage, insulation resistance, etc.) that make the equipment state better when the value becomes larger or higher are handled by Eq. 2. (Wang and Zhao, 2020). Empirical data gives the degree of deterioration in the qualitatively measured condition indicators such as running time and sealing performance.
Where the value of the subscript
According to the evaluation criteria of condition indicators given in Table 1, combined with a large number of experts and long-term experience in the field (China Electric Power, 2008), the assessment set of DT key condition indicators in Table 1 is obtained, as shown in Table 2.
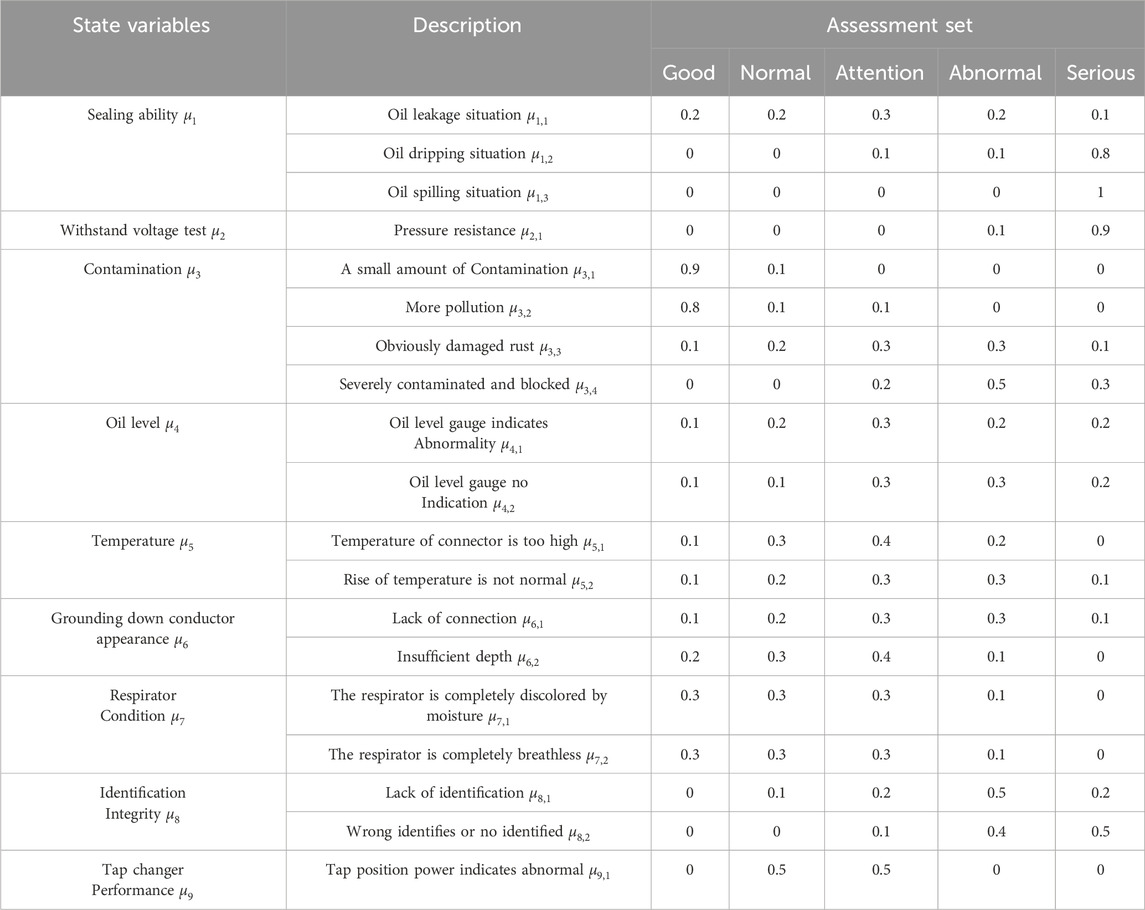
Table 2. Key condition indicators assessment set of DT.
After selecting the key condition indicators for distribution network equipment, reasonable weights must be assigned to each status variable before conducting a comprehensive state assessment. In this paper, we use the eclectic fuzzy decision-making and multilevel fuzzy integrated evaluation model to analyze the pre-data of DT’s. Then, the weight ratios of the assessment set are constantly updated by the XGBoost algorithm, which reduces the influence of subjective factors brought by experts and improves the reliability of data analysis. Finally, an expert database was established.
The flow chart for eclectic fuzzy decision-making is illustrated in Figure 1. Beginning with the original sample data, First, virtualizing the fuzzy positive ideal and fuzzy negative ideal. The fuzzy positive ideal is composed of the maximum value of the fuzzy indicator in each indicator, while the fuzzy negative ideal is composed of the minimum value of the fuzzy indicator in each indicator (Zadeh, 1965). Next, the weighted Euclidean distance is used to calculate the distance between each alternative object and the fuzzy positive ideal and fuzzy negative ideal. Based on this, the degree of affiliation of each alternative object belonging to the fuzzy positive ideal is calculated. The greater the degree of affiliation, the more desirable the scheme is.
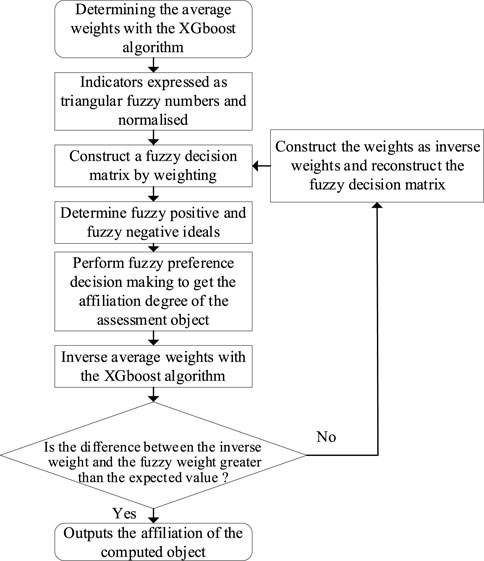
Figure 1. Flow chart of eclectic fuzzy decision-making model.
The basic solution steps for eclectic fuzzy decision-making are as follows.
Step 1: Transform the indicator data into triangular fuzzy numbers;
Suppose that
Where
The qualitative indicators

Table 3. Index transformation of triangular fuzzy number method.
The quantitative indicator values
After transforming all indicators into triangular fuzzy numbers, the matrix of fuzzy indicators is obtained and denoted as
The weighted triangular fuzzy number of quantitative indicators is obtained according to Eq. 4 and is expressed as Eq. 5:
The weighted triangular fuzzy numbers of qualitative indicators were obtained according to the transformation method in Table 3.
Step 2: Fuzzy indicator matrix normalization process;
Assuming that there are
①. If
②. If
The normalized fuzzy indicator matrix is denoted as
Step 3: Constructing the fuzzy decision-making matrix
The fuzzy decision-making matrix can be obtained by weighting
Step 4: Determine the fuzzy positive ideal
where component
Step 5: Determine the distance
Step 6: Fuzzy optimal decision-making.
Let the assessment object
Obviously
XGBoost (Chen and Guestrin, 2016) is an integrated learning algorithm based on gradient advancement that shows good performance in classification and regression problems. To reduce the influence of subjective factors brought about by expert experience and to avoid errors caused by data redundancy or error omission, this paper adopts a combination of eclectic fuzzy decision-making and the XGboost algorithm to improve the assessment accuracy of DT. This model integrates multiple weak learners together to build a strong learner, as follows:
For a dataset
Where
The XGBoost model is trained by additive approach, the optimal structure of this model is found by successively adding tree and segmentation features. Therefore, the predicted value of the nth tree is
The objective function of the final model consists of two parts, the loss function
where the loss function represents the predictive power of the model and the regularization term restricts the structure of the tree, as shown in Eq. 16:
where
A second-order Taylor expansion of the objective function can be approximated as Eq. 17:
Where
where
In Eq. 7,
After obtaining the weight distribution, it is replaced with step 3 in the basic solution step of eclectic fuzzy decision-making, and then the final expert group assessment set is obtained by repeated iterations.
In this section, the proposed state assessment approach is verified in the distribution transformers. We obtained the data, including state parameters and health index, from DTs of 50 units in 20 maintenance periods.
Table 2 displays the 13 important state quantities of the DT, which consist of four quantitative and nine qualitative markers. The rated values of the five major factor sets of DT are derived using the frequency statistics method in order to reduce data redundancy and clearly demonstrate the algorithm’s accuracy. This method includes four qualitative metrics (grounding down conductor appearance µ6, sealing ability µ1, withstand voltage test µ2, and identification integrity µ8) in addition to one quantitative metric (winding DC resistance). The relevant data are divided into training and test sets according to the ratio of 7:3. All the cases were obtained by using Python 3.8 in a 3.4 GHz Intel Core i5-7500 computer with 8 GB of RAM, and the configuration of XGBoost-related parameters is shown in Supplementary Table S4.
According to the health index of the DT, it is categorized into [S1,S2,S3,S4,S5] five states. S1 indicates that the transformer is in good condition with low risk of failure. S5 indicates that the transformer is in very poor condition with a high risk of failure. The lower the status number, the better the condition of the transformer. The percentage of transformers in various health states in the dataset is shown in Figure 2.
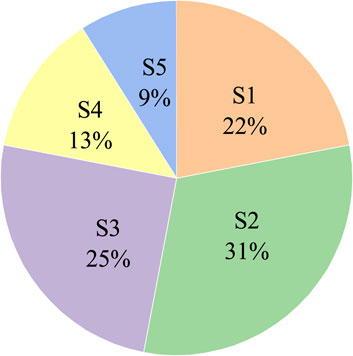
Figure 2. Percentage of transformer health status in the data set.
The dataset’s character-labeled data must first undergo preprocessing in order to be used. There are five values that make up the health index: good, normal, attention, abnormal, and serious, which are converted into (Liang et al., 2009; Yuan et al., 2019; Tamma et al., 2021; Guan, 2022; Fang et al., 2023). Figure 3 shows the result of encoding the transformer health state using one-hot encoding.
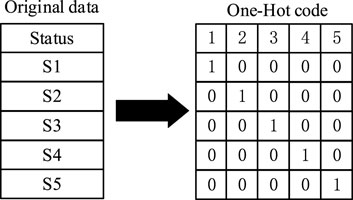
Figure 3. One-Hot code of transformer health status.
In this part, the health status of the transformer is evaluated by fuzzy iteration and XGBoost. The model is applied to the test set and the predictions of the model can be calculated as shown in Figure 4.
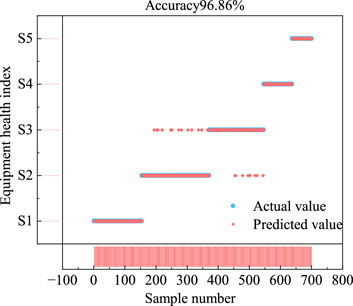
Figure 4. Prediction results of fuzzy decision model.
The actual and predicted categories are formed into rows and columns of a matrix, respectively, each element in the confusion matrix represents a categorization result, and the elements on the diagonal line indicate the number of correct predictions. Obviously, the lager the elements on the diagonal, the better the confusion matrix, and the confusion matrix is shown in Figure 5. The accuracy of S2 is 94.01%, the accuracy of S3 is 94.86%, and the accuracy of the other three categories is 100%. The model produces confusion only between S2 and S3, and all other categories are correctly categorized.

Figure 5. Confusion matrix of prediction results of XGBoost model.
In the multiclassification problem, as shown in Figure 6, if S2 is set as a positive sample and the other categories are considered as negative samples, we can classify the results as True Positive (TP), False Positive (FP), True Negative (TN) and False Negative (FN). Similarly, the other categories can be divided in this way. We can calculate the situation of the evaluation indicators for each category based on the prediction results, and we can calculatethe the suituation of the evaluation indicators by the model through the macro-averaging method.
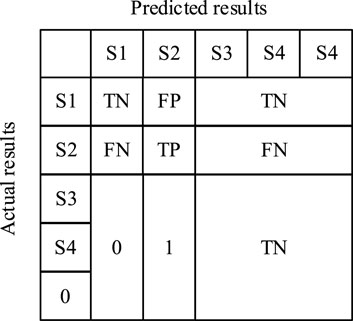
Figure 6. Prediction results classification diagram.
Accuracy is the percentage of correct predictions to the total sample, and is expressed as Eq. 21:
Precision is the percentage of true positive samples to the total positive samples in the predicted results, and is expressed as Eq. 22:
Recall is the percentage of true positive samples to actual positive samples in the predicted results, and is expressed as Eq. 23:
The F1 indicator (F1-score) is the average of precision and recall, and can be expressed as Eq. 24:
According to the above equation, we can calculate the precision index of the evaluation results of the proposed model. The recall rate is 97.77%, the accuracy rate is 96.86%, the precision rate is 97.78%, and the F1 indicator is 97.77%. The evaluation indicators of the proposed method are all above 96%. Therefore, the method can accurately and comprehensively identify the aging condition of cables.
The importance weights of the characteristic state quantities are shown in Figure 7. Winding DC resistance, sealing ability and insulation performance are the three key variables for evaluating the health status of the transformer.
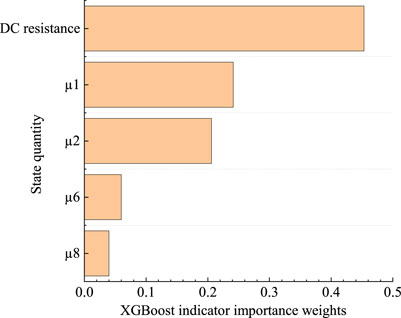
Figure 7. Weight of feature state.
In order to validate the performance of the proposed model, this section compares the algorithm proposed in the paper with other classification models concluding traditional XGBoost model, random forest (RF) (Breiman, 2001), decision tree (DT) (Fürnkranz et al., 2011), and support vector machine (SVM) (Cortes and Vapnik, 1995). These classification algorithms are briefly described below.
The DT model classifies the instances based on the feature values, the nodes of the decision tree contain judgments on the features, and then, the model outputs the classification results based on the judgments of each node.
The RF model consists of multiple independent decision trees, each decision tree in the forest classifies the samples individually, and the category with the highest score among all the decision tree is used as the classification result of RF.
SVM is a linear classifier, the idea is to find a suitable hyperplane for sample classification, it is usually used to deal with binary classification problems, but it also can be used to deal with multiclassification problems using a one-to-one approach.
The model evaluation results of the fuzzy decision-based XGBoost algorithm and the other four models are shown in Table 4. The model evaluation accuracy of SVM is the lowest among all the models, which is due to the fact that traditional SVM is a linear classifier and cannot handle nonlinear problems well. RF and XGBoost are integrated learning models, while DT belongs to the weak learner model, its performance is weaker than of RF and XGBoost models.
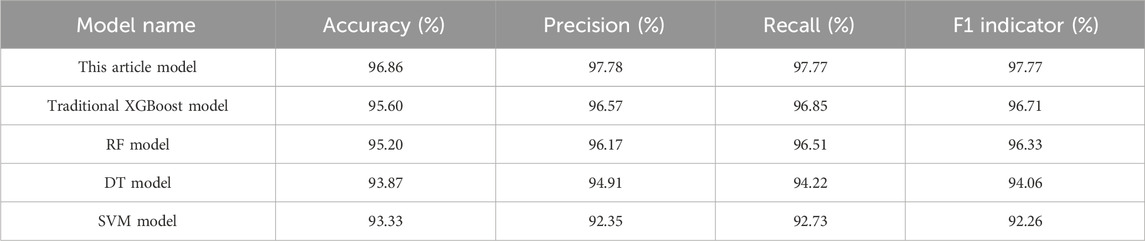
Table 4. Evaluation effect indicators of all models.
The XGBoost algorithm shows better evaluation compared to all other methods. The regular XGBoost algorithm increases the regularization term compared to other algorithms, which improves the model accuracy and avoids overfitting. And among all the algorithms, the model proposed in the paper has the best performance. From the comparative results, it is clear that the use of fuzzy decision making method to optimize the qualitative state quantities by incorporating them into the classification model does improve the performance of the XGBoost model.
The sensitivity (sensitivity curve,SC) curve is plotted based on the false positive rate (FPR) and true positive rate (TPR) of the model. The goodness of the model can be quantified by the area under the SC curve (AUC) (Bradley, 1997). The TPR and FPR are expressed as Eq. 25.
The SC curves for each model are shown in Figure 8. If the prediction is completely random, the curve is a straight line with slope 1. Among the multiple curves, the curve positions and AUC values allow a visual comparison of the model’s performance. The larger the AUC value, the more accurate the prediction. The curve of the fuzzy decision-based XGBoost model is closer to the upper left corner with an AUC of 0.988 9, it indicates that the model has a good performance in prediction accuracy.
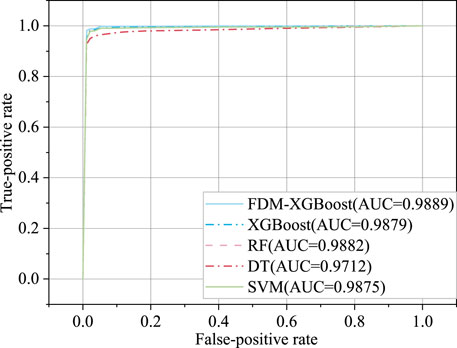
Figure 8. Comparison of SC curves of each mode.
The P-R curve can be plotted on the basis of the checking accuracy and the checking precision. In multiple classification problems, the area under the P-R curve is called the mean of average precision (mAP) for each category, and this value describes the accuracy of classification. The P-R curve is shown in Figure 9. The fuzzy decision based XGBoost model has the best curve performance with the largest mAP value among all models at 0.985 9. The DT model with the smallest mAP, it is 0.9211.
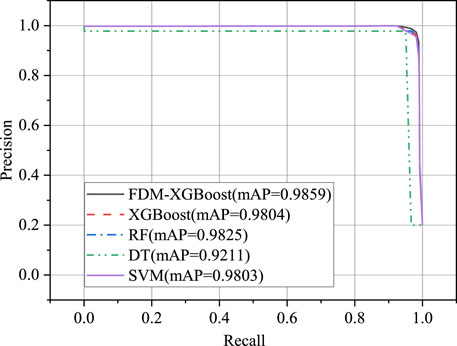
Figure 9. Comparison of P-R curves of each model.
Equipment breakdowns are the primary source of voltage instability, power imbalance, and unreliability in power systems. This work proposes a transformer health state evaluation model based on the fuzzy decision-making XGBoost algorithm in order to precisely analyze the DT health state. Nevertheless, the traditional XGBoost algorithm cannot quantitatively measure the assessment indexes of transformer health state, in order to overcome the difficulty, this paper combines the fuzzy iterative method with the XGBoost algorithm, constructs the mapping relationship between the key indexes and the state scores of the equipment, and puts forward a fuzzy decision-making based rapid assessment method of the state of the distribution equipment, which realizes the multi-source data fusion of systematic assessment.
The experimental results show that the accuracy, precision, recall and F1 indicator of the fuzzy decision-based XGBoost model are 96.86%, 97.78%%, 97.77%% and 97.77%%, respectively, the result are superior to the traditional XGBoost, RF, DT and SVM models mentioned in the paper. By comparing with the XGBoost model, which is constructed directly using quantitative parameters, the XGBoost model useing fuzzy decision theory does improve the evaluation performance. In addition, the AUC and mAP values of the XGBoost model are larger than the other three models, indicating that the proposed model has better overall performance. The results show that the XGBoost transformer health state assessment model proposed in the paper is more accurate, and the model can effectively assess the DT state.
The original contributions presented in the study are included in the article/Supplementary Material, further inquiries can be directed to the corresponding author.
WQ: Conceptualization, Writing–original draft. LY: Data curation, Writing–review and editing. WX: Formal Analysis, Writing–original draft. YK: Funding acquisition, Writing–original draft. LY: Investigation, Writing–original draft. XZ: Methodology, Writing–review and editing. LG: Project administration, Writing–review and editing. LY: Resources, Writing–review and editing. TJ: Software, Writing–review and editing.
The author(s) declare financial support was received for the research, authorship, and/or publication of this article. Technology Project of State Grid Henan Electric Power Company in 2023 (521702220005).
Authors WX, XZ, LG, and LYl were employed by State Grid Henan Electric Power Company.
The remaining authors declare that the research was conducted in the absence of any commercial or financial relationships that could be construed as a potential conflict of interest.
The authors declare that this study received funding from State Grid Henan Electric Power Company. The funder had the following involvement in the study: collection and analysis of data.
All claims expressed in this article are solely those of the authors and do not necessarily represent those of their affiliated organizations, or those of the publisher, the editors and the reviewers. Any product that may be evaluated in this article, or claim that may be made by its manufacturer, is not guaranteed or endorsed by the publisher.
The Supplementary Material for this article can be found online at: https://www.frontiersin.org/articles/10.3389/fenrg.2024.1418833/full#supplementary-material
Ahmad, T., and Senroy, N. (2020). Statistical characterization of PMU error for robust WAMS based analytics. IEEE Trans. Power Syst. 35, 920–928. doi:10.1109/tpwrs.2019.2939098
Bradley, A. P. (1997). The use of the area under the ROC curve in the evaluation of machine learning algorithms. Pattern Recognit. 30 (7), 1145–1159. doi:10.1016/s0031-3203(96)00142-2
Chen, T., and Guestrin, C. (2016). “Xgboost: a scalable tree boosting system,” in Proceedings of the 22nd acm sigkdd international conference on knowledge discovery and data mining, 785–794.
Chen, Z. (2017). Fault prediction of distribution network equipment based on bp neural network. Master’s Thesis. Guangdong, China: Guangdong University of Technology.
China Electric Power (2008). Q/GDW 168—2008 regulations of condition-based maintenance test for electric equipment. Beijing, China: China Electric Power Press.
Cortes, C., and Vapnik, V. (1995). Support-vector networks. Mach. Learn 20, 273–297. doi:10.1007/BF00994018
Fang, M., Huang, R., and Lv, T. G. (2023). “Research on state assessment method of key equipment in distribution network,” in Asia conference on power and electrical engineering (Tianjin, China: ACPEE), 2614–2618.
Fürnkranz, J. (2011). “Decision tree,” in Encyclopedia of machine learning. Editors C. Sammut, and G. I. Webb (Boston, MA: Springer). doi:10.1007/978-0-387-30164-8_204
Guan, C. X. (2022). Evaluation and prediction of distribution network operation status based on multi-source data fusion. Master’s Thesis. Shenyang, China: Shenyang University of Technology.
Guo, J., and Liu, C. S. (2005). Research on lightning accidents and lightning protection measures of distribution transformer. J. Electr. Power Sci. Technol. 3, 14–17.
Liang, J. L., Wang, Z. D., and Liu, X. (2009). State estimation for coupled uncertain stochastic networks with missing measurements and time-varying delays: the discrete-time case. IEEE Trans. Neural Netw. 20, 781–793. doi:10.1109/tnn.2009.2013240
Lv, B. (2022). Health evaluation of main transformer in power plant based on AHP- fuzzy comprehensive evaluation metho. Chongqing, China: Chongqing University.
State Grid Corporation (2011). Q/GDW 645-2011 Guidelines for state evaluation of distribution network equipment. Beijing, China: State Grid Corporation.
Tamma, W. R., Prasojo, R. A., and Suwarno, (2021). High voltage power transformer condition assessment considering the health index value and its decreasing rate. High. Volt. 6, 314–327. doi:10.1049/hve2.12074
Wang, N., and Zhao, F. (2020). An assessment of the condition of distribution network equipment based on large data fuzzy decision-making. Energies 13, 197. doi:10.3390/en13010197
Wang, Y. L., Zhao, X. P., and Bian, J. (2012). “Cloud model-based risk assessment of power transformer,” in International conference on high voltage engineering and application (IEEE).
Xie, H. X., Shi, L. P., and Hui, Z. Y. (2012). Research on immune clustering algorithm for transformers fault diagnosis. Electr. Meas. Instrum. 49, 15–18.
Yuan, F., Guo, J., Xiao, Z. H., Zeng, B., Zhu, W., and Huang, S. (2019). A transformer fault diagnosis model based on chemical reaction optimization and twin support vector machine. Energies 12, 960. doi:10.3390/en12050960
Zhang, Z., Zhao, W. Q., and Zhu, Y. L. (2010). State evaluation of power transformer based on support vector regression. Electr. Power Autom. Equip. 30, 81–84.
Zhang, J. W., Yang, Y., Weng, Y., and Zhang, N. (2020). Topology identification and line parameter estimation for non-PMU distribution network: a numerical method. IEEE Trans. Smart Grid 11, 4440–4453. doi:10.1109/tsg.2020.2979368
Zhou, J. S., Yu, J. F., and Yang, H. H. (2020). A condition assessment method of transformers based upon the dynamic grey target with theinterval grey number. J. Electr. Power Sci. Technol. 35, 133–140.
Zhu, Y. L., Shen, T., and Li, Q. (2008). Transformer condition assessment based on support vector machine and DGA. J. Electr. Power Syst. Automation 24, 47–50.
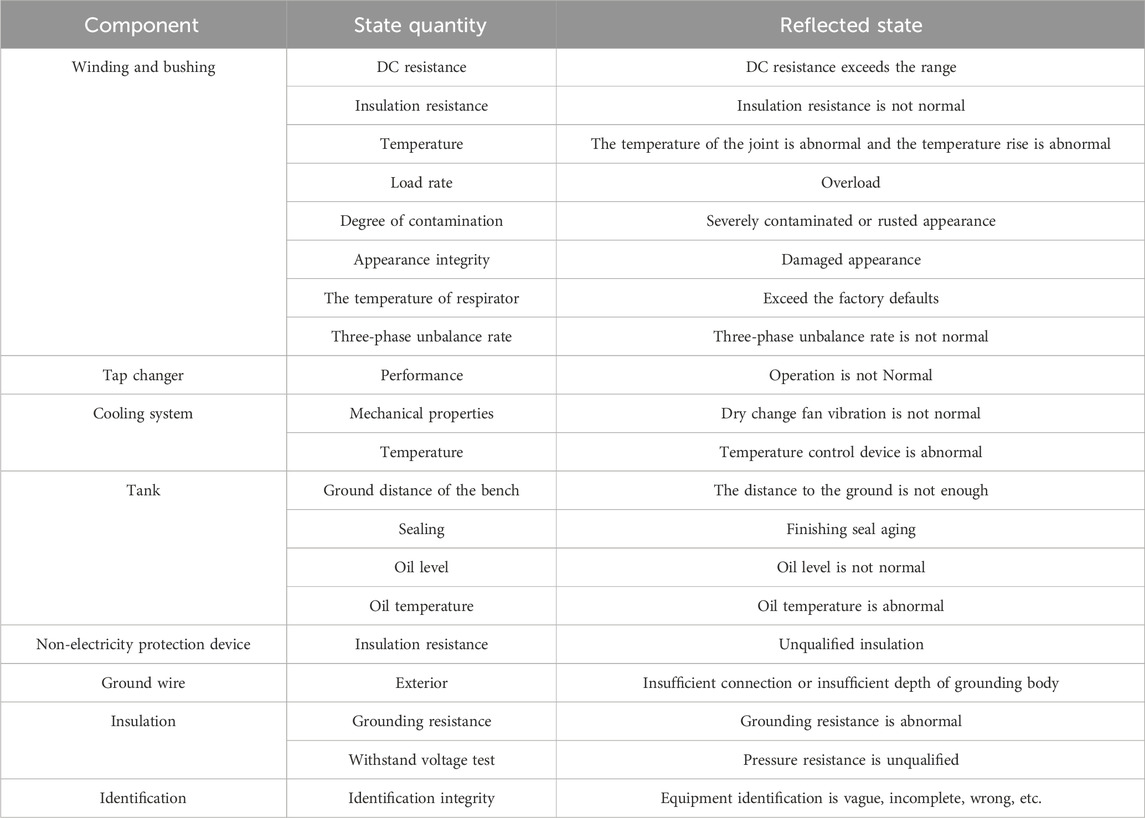
TABLE A1. Critical state evaluation set of DT.
Keywords: electrical distribution equipment, fuzzy decision making, data-driven, status assessment, XGBoost
Citation: Qian W, Yuquan L, Xiaohui W, Kun Y, Yang L, Zhongyuan X, Guangyu L, Yunlong L and Jiyuan T (2024) Rapid assessment of distribution network equipment status based on fuzzy decision making. Front. Energy Res. 12:1418833. doi: 10.3389/fenrg.2024.1418833
Received: 17 April 2024; Accepted: 04 June 2024;
Published: 04 July 2024.
Edited by:
Chaolong Zhang, Jinling Institute of Technology, ChinaReviewed by:
Carlos Roberto Minussi, São Paulo State University, BrazilCopyright © 2024 Qian, Yuquan, Xiaohui, Kun, Yang, Zhongyuan, Guangyu, Yunlong and Jiyuan. This is an open-access article distributed under the terms of the Creative Commons Attribution License (CC BY). The use, distribution or reproduction in other forums is permitted, provided the original author(s) and the copyright owner(s) are credited and that the original publication in this journal is cited, in accordance with accepted academic practice. No use, distribution or reproduction is permitted which does not comply with these terms.
*Correspondence: Wang Qian, MjAyMjExMTMxMzE1QHN0dS5jcXUuZWR1LmNu
Disclaimer: All claims expressed in this article are solely those of the authors and do not necessarily represent those of their affiliated organizations, or those of the publisher, the editors and the reviewers. Any product that may be evaluated in this article or claim that may be made by its manufacturer is not guaranteed or endorsed by the publisher.
Research integrity at Frontiers
Learn more about the work of our research integrity team to safeguard the quality of each article we publish.