 Lu Yu*
 Lu Chao
- State Grid Shanghai Municipal Electric Power Company, Shanghai, China
With the increasing penetration level of electric vehicles (EVs) in distribution networks, the limited capacity of distribution networks has become a bottleneck for EV integration. Considering the difficulties of capacity expansion in distribution networks, especially in large cities, integrating EVs with photovoltaic (PV) generation systems and battery energy storage systems has become a possible technical solution for distribution networks. However, uncertainties in the PV generation systems and EV loads make planning and operating methods difficult for such systems. This paper presents an evaluation model that simulates the uncertainties of EV and PV power generation systems using a large number of stochastic scenarios generated by the Monte Carlo method to assess the revenue of various operators under multiple possible scenarios. Multiple operation constraints were considered in the proposed method, including voltage deviations, capacity limitation of the transformer, EV owner satisfaction, and other physical constraints. In order to accelerate the evaluation process of the EVs, the Distflow equations for distribution networks were applied in the proposed evaluation model. The results of case studies indicate that the maximum capacity of EVs with different scenarios can be calculated by the proposed model.
1 Introduction
Electric vehicles (EVs) have been regarded as an effective technology for reducing carbon emissions (Hu et al., 2024). Compared with conventional fossil-powered vehicles, EVs could reduce carbon emissions to 50% of the original level (Wang et al., 2023). Compared with their internal combustion engine counterparts, EVs are often characterized by their rapid acceleration performance, the provision of a more refined and comfortable driving experience, and a significantly reduced level of noise emissions. While the initial acquisition cost of EVs is potentially higher, their operational expenses are significantly reduced, particularly when the vehicles are charged during off-peak hours when electricity rates are more favorable. However, several technical factors limit EVs from replacing conventional fossil-powered vehicles. First, compared with the number of petrol stations for fossil-powered vehicles, the number of charging stations is still relatively small. More charging stations are under construction to meet the charging needs of EVs in the near future, requiring higher-capacity distribution networks. This additional capacity of the distribution network is a great technical challenge for the current distribution network, especially for the distribution network in large cities (Dyke et al., 2010; Jokinen and Lehtonen, 2023). The lands in the large cities for expanding the existing distribution network are very limited and valuable. These factors create great difficulties for capacity expansion in distribution networks in large cities. Another factor to limit the increasing speed of the number of EVs is charging time. Comparing the charging time of petrol with fossil-powered vehicles, the charging time for EVs is still more than 1 hour for most charging stations. Although rapid charging technologies have been developing fast in recent years, and the charging speed can be reduced to several minutes in the laboratory, the limited power capacity is still an important limitation for building fast charging EV stations (Yao et al., 2014; Tu et al., 2019; Arya and Das, 2023).
As mentioned above, the limited power capacity of the distribution network is a bottleneck for accelerating EVs to replace conventional fossil-powered vehicles. As a possible solution, building a PV–Storage–EV hybrid fast EV charging station (EVCS) could reduce the required power capacity of the distribution network by increasing the self-generation capability. The development of PV technology can further enhance the environmental friendliness of energy on the basis of the development of EVs (Kim et al., 2019; Bhang et al., 2023). The characteristics of the energy storage system (ESS) can effectively address the challenges posed by the uncertainty of EV loads and PV power generation (Ribeiro et al., 2001; Bhattacharya et al., 2018; Zhang et al., 2022). In Manoj et al. (2023), the Monte Carlo simulation technique models authentic charging and battery exchange scenarios for EVs, capturing the inherent uncertainties and variability in real-life operations. For planning the hybrid EV fast charging stations, balancing the uncertainties, construction costs, and the risk of limiting charging capacity is one of the most important issues. Many researchers have carried out related research to develop and improve the planning method for hybrid charging stations. Leadbetter and Swan (2012) studied the energy storage capacity required for peak shaving and valley filling of civilian charging piles. Das et al. (2023) discussed the collaborative operation strategy of PV, charging stations, and energy storage in a joint system and verified the feasibility of the system. Van Roy et al. (2014) studied the EV charging strategy in areas with distributed thermoelectric and photovoltaic industries. Wi et al. (2013) proposed an EMS-based intelligent charging method for household EVs connected to photovoltaics. Xuewei et al. (2020) analyzed short-time power generation characteristics of photovoltaic and wind power and discussed the compensation effect of energy storage systems on the power generation instability.
The above literature does not provide an economic analysis and evaluation model in collaborative systems. This paper proposed an economic evaluation model for EVCS power supply based on PV, ESS, and distribution networks. The adaptability of different types of EV charging loads to ESS and PV is discussed. Furthermore, the application of the Monte Carlo method, as discussed in Manoj et al. (2023), has been extended from EVs to photovoltaic power generation in this study.
This study contributes to the field by developing a model that enables a swift evaluation of the economic benefits for operators of energy storage facilities, PV generation systems, and EVCS within the power grid. The paper also presents a set of strategic recommendations for operators concerning optimal site selection and strategies for expanding their operational scale.
2 Mathematical model
Figure 1shows the collaborative system diagram. The system comprises PV generation, ESS, and EVCS, which are connected to the distribution network. A static var generation (SVG) is connected to the electric charging station to compensate for reactive charging power, and a linear voltage regulator (LVR) is connected at the distribution network. The LVR can flexibly adjust bus #1 voltage to improve the power quality of bus #3 (Geth et al., 2012). In the proposed model, time of use (TOU) electricity prices are used to represent the electricity sale price, which can guide users to participate in demand response, improve user satisfaction, and enhance the economic efficiency of the power grid (Zhao et al., 2014; Yi et al., 2019; Liu et al., 2021).

Figure 1. System diagram.
In this model, PV generates electricity, and the priority for selling electricity is EVCS, distribution network, and ESS, which is determined based on the price sold to them, which are noted as
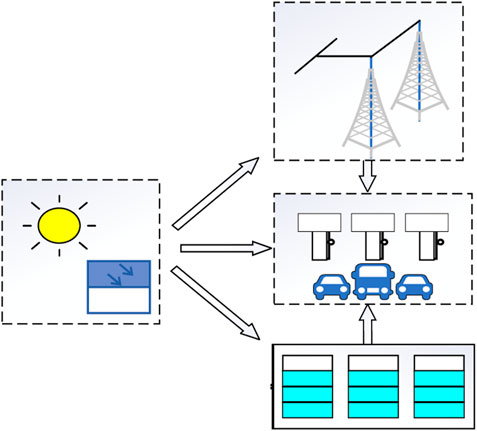
Figure 2. Power flows in this model.
Considering the unit cost of building PV, EVCS, and ESS, the profit of the three units can be calculated separately as Eqs 1–3:
where
Based on the SOC level of ESS
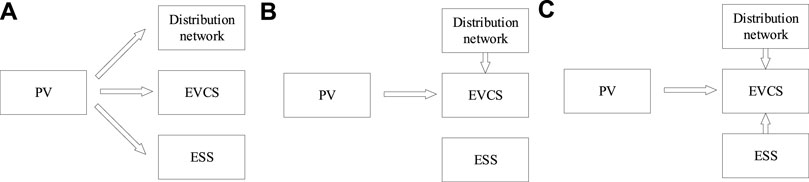
Figure 3. Three possible power flow scenarios. (A) Power flow scenario #1. (B) Power flow scenario #2. (C) Power flow scenario #3.
In the situation shown in Figure 3A, PV power generation
In the situation shown in Figure 3B, PV power generation
In the situation shown in Figure 3C, PV power generation
In this model, the reactive power required by the EVCS can be compensated by on SVG. If the EVCS needs more reactive power, the distribution network and ESS can provide it. Reactive power transmitted on line 1 and line 2 can be calculated as Eqs 4, 5:
where
After determining the active and reactive power transmitted on line 1, bus #2 voltage can be calculated by the DistFlow model. Assuming a section of the transmission line, its line parameters and voltage and power parameters are shown in Figure 4. The voltage drop on line 1 can be calculated by Equation 6 based on the DistFlow model. Farivar and Low (2013) and Borland and Singh (2018) have validated the adaptability of the DistFlow model, demonstrating its potential for scalability to encompass all radial distribution networks. Hence, the model introduced in this study is designed with the flexibility to be applicable across a wide range of radial distribution network configurations.
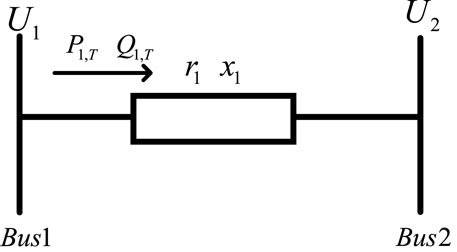
Figure 4. Transmission line.
Because
Similarly, bus #3 voltage can be calculated by Eq. 8.
It is possible to compute the voltage values across different scenarios using the linear calculation formula (8) for nodal voltages derived from the analysis. Change the state of LVR to adjust
3 Scenario generation
In this paper, normal distribution models of PV generation and different types of EV charging load are built to reflect the uncertainty of EV and PV generation systems, as is shown in Figure 5. The mean or expectation of the distribution
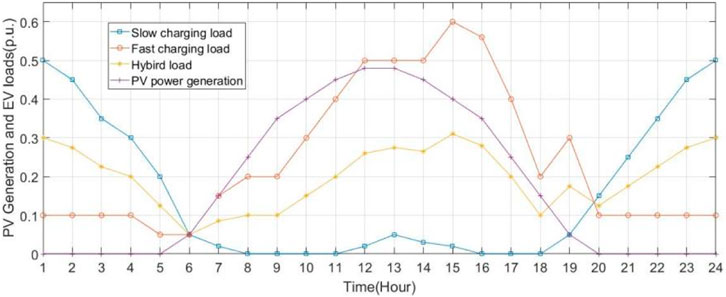
Figure 5. Daily load curves of three types of EV charging loads and PV daily generation curve.
In Borland and Singh (2018), the typical PV power generation curve is discussed, which indicates that PV power generation is only possible during daylight hours and peaks around 12:00–13:00. The distribution network and the ESS must meet the charging demand for EVs at night. In Hasan et al. (2019), the differences between fast and slow charging loads of EVs are identified based on actual measured load curves. This paper simulates three types of loads based on the characteristics summarized therein: the first two types represent fast and slow charging loads, respectively, and the third type is a hybrid load composed of a combination of fast charging load and slow charging load, with each contributing 50% to the composite load.
Using the Monte Carlo method, many curves can be generated randomly by each normal distribution model. Because of the randomness inherent in the normal distribution, there are scenarios that include negative power, which are unreasonable and must be eliminated. We employ the k-means clustering algorithm among the remaining data to reduce the number of curve samples. The k-means clustering algorithm compares the distance between each data in the samples and the centroids of all k clusters, assigning the data to the closest cluster. We randomly generate 10,000 scenarios and set the original curves as the initial centroids. The k-means algorithm then reduces the sample size to 365 daily data points over a year. The daily load data collected throughout this year will serve as the dataset to demonstrate the effectiveness of the method introduced in this paper. The PV daily output power of 1 year is shown in Figure 6. The output power reaches its peak value at noon with high uncertainty while performing more stably at the beginning and end of the day.
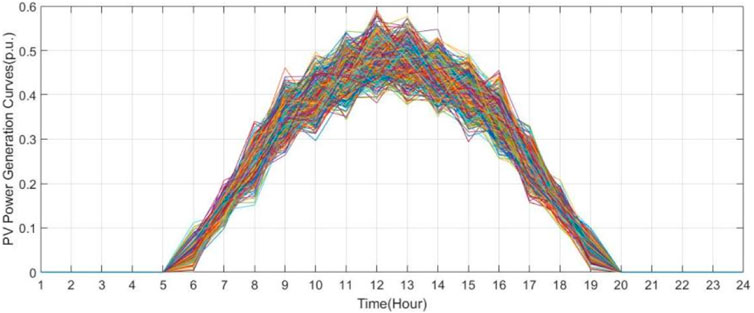
Figure 6. PV daily generation curves in 1 year.
The slow EVCS daily load curves in 1 year are in Figure 7. This kind of load is often distributed in residential areas of EVCSs. Its characteristics are that most users are more likely to charge at midnight for cheaper electricity price and some users choose to charge temporarily at noon time. Consequently, the mean value
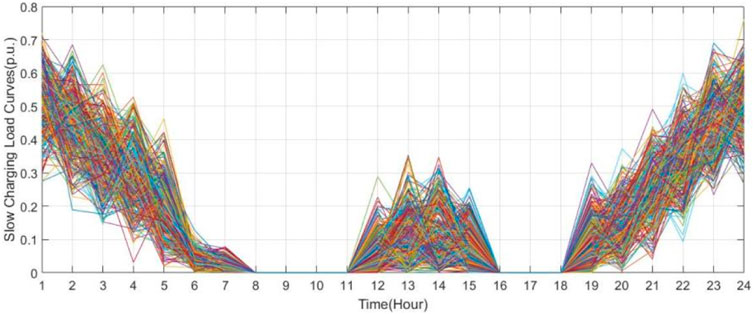
Figure 7. Slow EVCS daily load curves in 1 year.
The fast EVCS daily load curves in 1 year are shown in Figure 8. This kind of load is often distributed in EVCSs in commercial areas. Its characteristics are that there will be a charging demand at any time, and demand and uncertainty at daytime are significant. The mean value
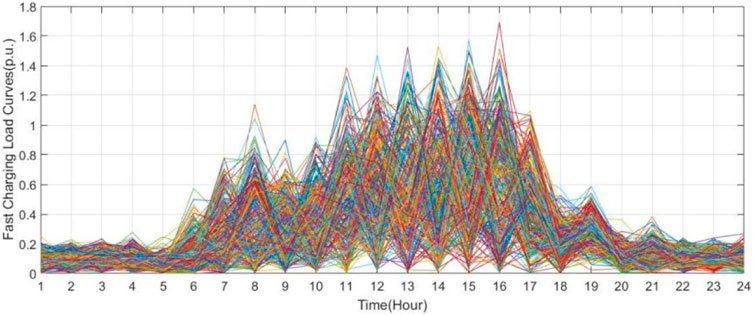
Figure 8. Fast EVCS daily load curves in 1 year.
The hybrid EVCS daily load curves in 1 year are shown in Figure 9. This kind of load is a hybrid distribution of commercial and residential areas. Its characteristics include the nighttime rise characteristics of slow charging loads and the daytime high uncertainty of fast charging loads. Some consumers prefer to arrange slow charging schedules, whereas others opt for impromptu fast charging sessions at different periods. Therefore, the mean
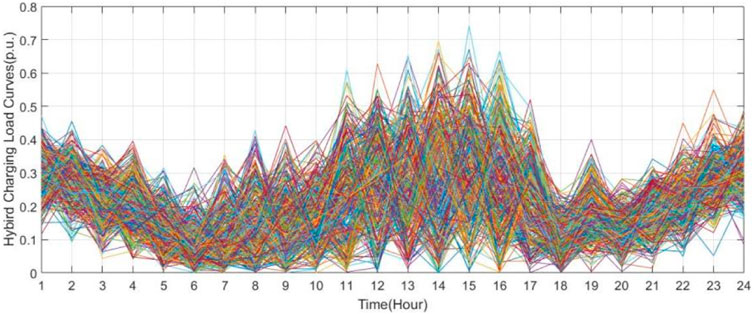
Figure 9. Hybrid EVCS daily load curves in 1 year.
The three delineated charging load profiles, slow charging load, fast charging load, and hybrid charging load, exhibit both correlations and complementarity in their operational characteristics and user preferences. Slow charging loads are typically more stable and peak during nighttime hours. In contrast, the high randomness of fast charging loads, if not strategically managed, may impose stress on the power grid. Hybrid charging loads, a combination of slow and fast charging loads, reflect a more diversified and flexible user behavior and may offer strategic advantages in load management. This combination can leverage the characteristics of both slow and fast charging, smoothing out the overall demand curve and enhancing the resilience of the charging infrastructure to meet varying user demands across different periods of the day.
4 Case studies
Based on a 10-year depreciation rate, the installation costs for photovoltaic power stations, EVCS, and energy storage systems are estimated to be 30 W RMB/WM, 40 W RMB/MW, and 300 RMB/kWh, respectively. The PV cost is sourced from the statistical data provided by the US Energy Information Administration, which is 21.2 W RMB/WM. The cost reference value for the EVCS provided in Ortenzi et al. (2017) is 23.1 RMB/MW. Meanwhile, the cost reference value for the ESS provided in Fu et al. (2018) is 250 RMB/kWh. It is important to note that all costs we used have been conservatively estimated based on the previous data, suggesting that actual costs may be lower. The typical price and TOU price settings mentioned above are shown in Tables 1–3.
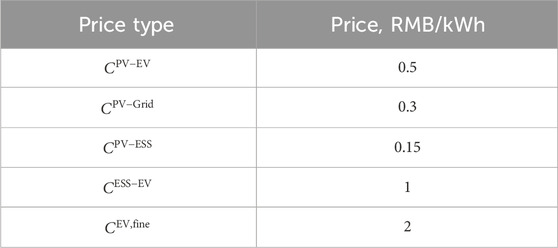
Table 1. Typical price between PV, EVCS, ESS, and Grid in China.
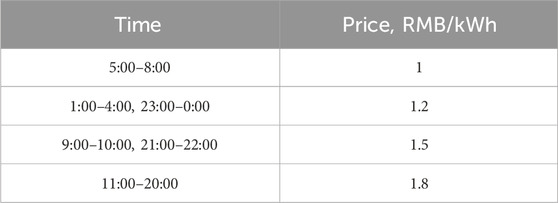
Table 2. Typical TOU EV charging price in China.
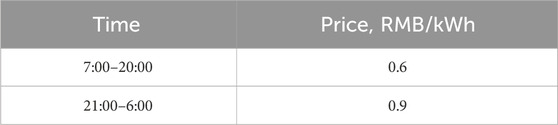
Table 3. Typical TOU Grid electricity price in China.
This paper applies the proposed evaluation method to a fragile power grid where the grid’s support capacity is significantly lower than the power supply capabilities of energy storage and photovoltaic systems. Scenarios in different capacity ratios of EVCS, PV, ESS, and distribution network support and purchase capacity are set to research the economic status of different facilities and compare the impact of different types of EVCS loads on the expansion of power facilities, as shown in Table 4. The capacity of the EVCS is a constant 6 MW, while the capacities of PV and ESS have three levels: high (8 MW), medium (6 MW), and low (4 MW). Nine scenarios are combined. In the first nine scenarios, it is assumed that there are multiple additional subnets connected at the bus where the system interfaces with the distribution network. Constrained by the internal power flow of the distribution network, their capacity to purchase electrical energy is only half of the grid’s support capacity. In the 10th scenario, it is presumed that the capacity to purchase electrical energy is equivalent to the support capacity, and the power transmitted in this scenario is influenced only by the transformer capacity and line parameters.
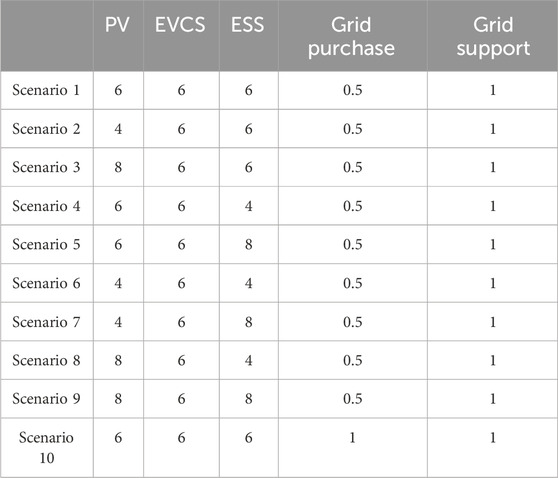
Table 4. Different capacity ratios of units in system (MW).
In the slow charging scenario, the annual revenues of the PV, EVCS, and ESS are shown in Figure 10. Because of the characteristics of slow charging loads, much of the PV output power is directed toward the distribution network and ESS during the day. However, the demand for nighttime charging is difficult to meet, leading to substantial fines and negative revenue for the EVCS. Moreover, the revenue from PV is mainly composed of cheap electricity sold to the distribution network and ESS, as the peak generation period does not align with the peak charging demand period. Meanwhile, the ESS effectively matches the characteristics of slow charging loads. It stores more low-cost electricity during the day and can sell more at higher prices at night. The increase in ESS capacity allows for purchasing more affordable electricity from PV during the day and its sale to the EVCS at night for higher profits. Compared with the ESS, the limited variation of the purchase capacity of the distribution network has a more significant impact on PV. The low-priced electricity sold to ESS in Scenario 1 is sold to the distribution network at a higher price in Scenario 10. This change further highlights the important role of energy storage systems in balancing supply and demand and optimizing the operation of the electricity market. By properly configuring and utilizing energy storage systems effectively enhances the operational efficiency and economic profits of the entire ESS.
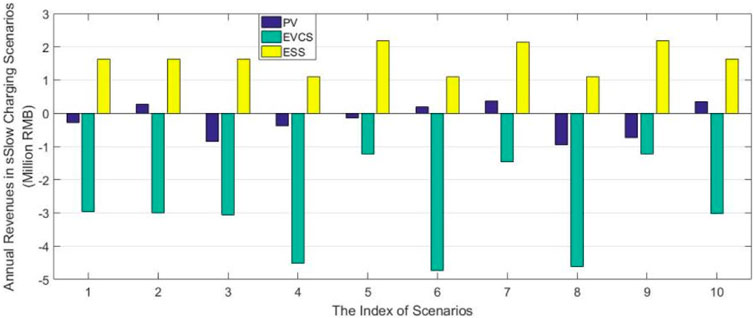
Figure 10. Annual revenue in slow charging scenarios.
Annual revenues of PV, EVCS, and ESS in fast charging scenarios are shown in Figure 11. The fast charging load has a relatively large amplitude during the day, with a curve resembling the PV output power curve. As a result, a significant portion of the electricity generated by PV is sold to the EVCS. The fast charging demand of the EVCS can be met in all scenarios, which allows PV and EVCS to reap high profits. For ESS, the situation is somewhat different. Because of the peak alignment between PV and EVCS, ESS cannot obtain much electricity during the day.
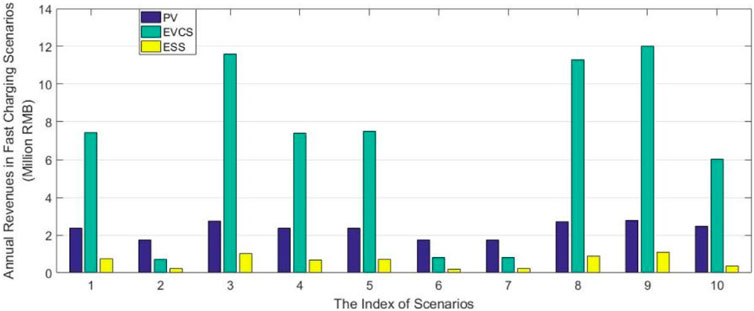
Figure 11. Annual revenue in fast charging scenarios.
Furthermore, the low charging demand from EVs at night is mostly satisfied through the distribution network, leading to a lower utilization rate and reduced storage profits for the ESS. The conditions presented in Scenario 10 should further decrease the revenue of ESS. With the fast charging load, the synergistic relationship between PV and EVCS is beneficial for their respective revenues, as the high daytime demand for electricity aligns well with the peak generation period of PV. This alignment ensures that the electricity produced by PV is efficiently utilized, minimizing losses and maximizing profitability for both sectors. However, the ESS faces challenges in this scenario. The high daytime demand is already being met by the direct sale of PV electricity to EVs, leaving less opportunity for ESS to store excess energy at favorable rates. The reduced nighttime demand, a potential period for ESS to discharge stored energy at a higher profit, is also less pronounced because of the ability of the distribution network to meet the lower demand requirements. This situation, combined with the specific conditions of Scenario 10, places additional financial pressure on ESS, necessitating strategic adjustments and innovative solutions to optimize its operation and revenue generation within the fast charging framework.
In the hybrid charging scenario, as depicted in Figure 12, the revenues of PV, EVCS, and ESS exhibit distinct characteristics compared with scenarios with the above two kinds of charging loads. The reduction in revenue for both PV and EVs is attributed to the variability in the daytime charging load characteristics, which does not align well with the output power of PV. Consequently, in many scenarios, ESS can purchase enough electricity. Additionally, the increased nighttime charging load demand provides a market for ESS to sell its stored electricity, which significantly enhances its revenue potential. The operation of ESS in this scenario is crucial as it acts as a buffer to store excess electricity during periods of high PV generation and supply it during periods of high demand, thus optimizing the overall energy flow and increasing profitability.
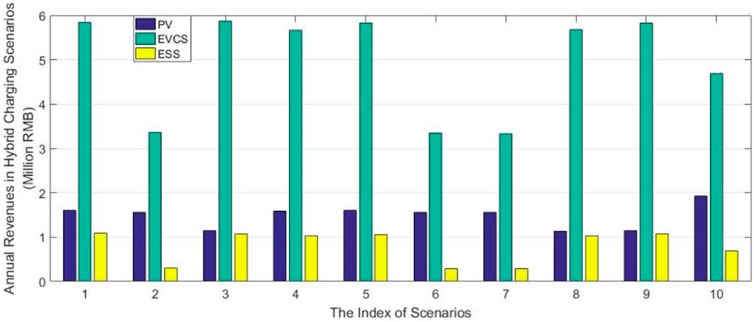
Figure 12. Annual revenue in hybrid charging scenarios.
The hybrid charging scenario presents challenges and opportunities for PV, EVCS, and ESS. While the variability in charging loads brings uncertainty, it also provides a dynamic environment where the ESS can play a pivotal role in balancing supply and demand and enhancing the overall efficiency of the energy system. It is essential for stakeholders to closely monitor market conditions and adapt their strategies accordingly to maximize profits.
The average voltages of bus #3 in different scenarios under three different types of EV charging loads are shown in Table 5. Although different capacities can cause voltage fluctuations, the operating strategy of LVR can adjust the voltage of bus #3 within a range of good power quality. It can be clearly observed that for the most heavily loaded scenarios 2, 6, and 7, the power quality remains relatively good because of errors in the power quality calculated by the DistFlow model. The load power in these three scenarios is difficult for PV systems to meet, necessitating a higher transmission power demand and greater network losses. These network losses are not accounted for in Equation 7, leading to discrepancies in the calculations.
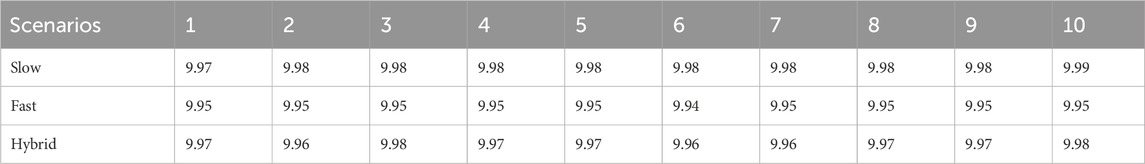
Table 5. Average voltage of 1 year on bus #3 (kV).
5 Discussions
For the PV generation system, comparing Figures 10–12 it can be observed that under fast charging load conditions, the revenue increase in PV with increasing capacity is greater than that under slow charging load conditions. The increase in income from hybrid loads falls between the two, as the uncertainty in charging loads is reduced by the proportion of slow charging loads. When the expansion of PV does not exceed the acceptable range of the EVCS, the expansion profits of PV are very good. When the PV power generation exceeds the acceptable range of the EVCS, the additional capacity will be sold at a low price to the distribution network and ESS, significantly reducing profits and even causing waste. Comparing the profits of PV in Scenarios 1–3 shows that the cost-effectiveness of expanding PV is higher under the last two load conditions.
For EV charging stations, comparing the profits with three types of EV charging loads, it is obvious that fast charging loads are more suitable for connecting to buses with PV generation systems because of their load characteristics, while slow charging loads may have to bear greater risks if they want to connect to buses with PV power generation. Even if a slow charging load has more stability and predictability, it will only increase the pressure of the EVCS in most scenarios. Comparing the profits of Scenarios 3–5 in the three figures shows that the larger the proportion of fast charging load, the more profits PV expansion brings to the EVCS, and the larger the proportion of slow charging load, the more profits ESS expansion brings to EVCS. The economic revenue of the EVCS with a hybrid load is more stable. Whether it is the expansion of PV or ESS, as long as it can meet most charging demands, the negative influence on EVCS profits is negligible.
For energy storage systems, two key factors affecting its profitability are the purchase of additional electricity during PV supply periods and the market for selling electricity during nighttime. As shown in Figure 10, ESS can have higher benefits than other components in the network, while as shown in Figure 11, the opposite is true. Comparing the benefits of ESS in Scenarios 1 and 2 in the three figures shows that under slow charging load conditions, the benefits of ESS are not affected by changes in PV capacity because, under slow charging load, ESS can reach the maximum level of SOC easily, while under fast charging load and hybrid charging load conditions, the reduction of PV capacity will affect the daytime SOC level of ESS. Furthermore, ESS has a higher saturation capacity under slow charging conditions, meaning the upper limit of capacity expansion that can yield positive profits is higher. As seen in Scenario 10 of the three figures, the ability of ESS to purchase electricity is constrained by the distribution network. A decrease in the distribution network’s purchasing capacity can result in more purchasable electrical energy being available for energy storage systems.
Consequently, in scenarios where there is a marked surplus of electricity generation from PV systems, the purchasing capacity of the distribution network can significantly affect the profitability of ESS. This situation occurs because one of the critical factors influencing their profitability is the ability to acquire sufficient electrical energy during daylight hours, partly determined by the distribution network’s purchasing capacity. If the purchasing capacity of the distribution network is enhanced, even when the PV-generated electricity exceeds the demand for EV charging, the distribution network could absorb excess energy. This would, in turn, make it more challenging for ESS to capitalize on its competitive edge.
In summary, the interplay between PV, EVCS, and ESS under various charging load conditions is complex and influenced by multiple factors. Strategic planning and the intelligent operation of these systems are crucial for optimizing their profitability.
6 Conclusion
This study introduced a comprehensive evaluation model for calculating the integration capacity for EVCSs with PV and ESS in the distribution networks. The proposed model was designed to evaluate the economic revenue of these interconnected systems under various operational scenarios while considering the integration capability. The Monte Carlo method is employed with a Gaussian model to generate operation scenarios in an extremely weak grid that considers the inherent uncertainties in EV charging loads and PV power generation outputs. Clustering algorithms are then developed to categorize these scenarios effectively. From the outcomes of the case study examination, the subsequent conclusions have been derived:
1. Fast charging loads are more suitable for connecting PV generation systems in a fragile grid, achieving a win–win situation and earning high profits.
2. Energy storage systems are more suitable for compensating the slow charging stations connected with PV in a fragile grid, while the risk for the profits of the EVCS will be higher.
3. The real-time regulation characteristics and different voltage regulation characteristics of LVRs can greatly improve the voltage quality of different scenarios with uncertainties.
In future research, we suggest that real-time floating electricity prices should be considered in the model. This consideration can improve the accuracy and complexity of the proposed model while considering the dynamic nature of electricity markets. Additionally, developing an energy storage operation strategy that considers the purchase of electricity from the grid with the constraints of charging and discharging times could further optimize the revenue and efficiency of the ESS. Overall, this research provides a robust framework for assessing the revenue potential and operational strategies of distribution networks that incorporate PV, EVCS, and ESS. By considering the uncertainties and modeling the operation characteristics of different components, the model offers a technical framework to evaluate distribution networks’ economic and power quality with EVs and various compensation devices.
Data availability statement
The original contributions presented in the study are included in the article/Supplementary Material. Further inquiries can be directed to the corresponding author.
Author contributions
YL: Writing–review and editing, writing–original draft, supervision, and conceptualization. CL: Writing–review and editing, project administration, and conceptualization. YL: Writing–review and editing and software. MD: Writing–review and editing and methodology. YC: Writing–review and editing, visualization, and investigation. RD: Writing–review and editing and resources.
Funding
The author(s) declare that financial support was received for the research, authorship, and/or publication of this article. This research was funded by science and technology program of State Grid Shanghai Municipal Electric Power Company (grant number 520933230002). The funder was not involved in the study design, collection, analysis, interpretation of data, the writing of this article, or the decision to submit it for publication.
Conflict of interest
Authors YL, CL, YL, MD, YC, and RD were employed by State Grid Shanghai Municipal Electric Power Company.
Publisher’s note
All claims expressed in this article are solely those of the authors and do not necessarily represent those of their affiliated organizations or those of the publisher, the editors, and the reviewers. Any product that may be evaluated in this article, or claim that may be made by its manufacturer, is not guaranteed or endorsed by the publisher.
References
Arya, H., and Das, M. (2023). Fast charging station for electric vehicles based on DC microgrid. IEEE J. Emerg. Sel. Top. Industrial Electron. 4 (4), 1204–1212. doi:10.1109/jestie.2023.3285535
Bhang, B. G., Hyun, J. H., Ahn, S.-H., Choi, J. H., Kim, G.-G., and Ahn, H.-K. (2023). Optimal design of bifacial floating photovoltaic system with different installation azimuths. IEEE Access 11, 1456–1466. doi:10.1109/access.2022.3233100
Bhattacharya, A., Kharoufeh, J. P., and Zeng, B. (2018). Managing energy storage in microgrids: a multistage stochastic programming approach. IEEE Trans. Smart Grid 9 (1), 483–496. doi:10.1109/tsg.2016.2618621
Borland, J., and Singh, A. (2018). “Reducing morning & late afternoon grid-buy demand by engineering box-like rooftop solar-PV generation profiles without the high cost of trackers or bifacial panels,” in 2018 IEEE 7th World Conference on Photovoltaic Energy Conversion (WCPEC) (A Joint Conference of 45th IEEE PVSC, 28th PVSEC & 34th EU PVSEC), Waikoloa, HI, USA, 10-15 June 2018, 1169–1172.
Das, N., Haque, A., Zaman, H., Morsalin, S., and Islam, S. (2023). Domestic load management with coordinated photovoltaics, battery storage and electric vehicle operation. IEEE Access 11, 12075–12087. doi:10.1109/access.2023.3241244
Dyke, K. J., Schofield, N., and Barnes, M. (2010). The impact of transport electrification on electrical networks. IEEE Trans. Industrial Electron. 57 (12), 3917–3926. doi:10.1109/tie.2010.2040563
Farivar, M., and Low, S. H. (2013). Branch flow model: relaxations and convexification—Part II. IEEE Trans. Power Syst. 28 (3), 2565–2572. doi:10.1109/tpwrs.2013.2255318
Fu, R., Remo, T., and Margolis, R. (2018). “Evaluating the cost benefits of U.S. Utility-scale photovoltaics Plus energy storage systems,” in 2018 IEEE 7th World Conference on Photovoltaic Energy Conversion (WCPEC) (A Joint Conference of 45th IEEE PVSC, 28th PVSEC & 34th EU PVSEC), Waikoloa, HI, USA, 10-15 June 2018, 1–4.
Geth, F., Leemput, N., Van Roy, J., Büscher, J., Ponnette, R., and Driesen, J. (2012). “Voltage droop charging of electric vehicles in a residential distribution feeder,” in 2012 3rd IEEE PES Innovative Smart Grid Technologies Europe (ISGT Europe), Berlin, Germany, 14-17 October 2012, 1–8.
Hasan, K. N., Muttaqi, K. M., Borboa, P., Scira, J., Zhang, Z., and Leishman, M. (2019). “Measurement-based electric vehicle load profile and its impact on power system operation,” in 2019 9th International Conference on Power and Energy Systems (ICPES), Perth, WA, Australia, 10-12 December 2019, 1–6.
Hu, Z., Mehrjardi, R. T., and Ehsani, M. (2024). On the lifetime emissions of conventional, hybrid, plug-in hybrid and electric vehicles. IEEE Trans. Industry Appl. 60 (2), 3502–3511. doi:10.1109/tia.2023.3330950
Jokinen, I., and Lehtonen, M. (2023). Modeling of electric vehicle charging demand and coincidence of large-scale charging loads in different charging locations. IEEE Access 11, 114291–114315. doi:10.1109/access.2023.3322278
Kim, G. G., Choi, J. H., Park, S. Y., Bhang, B. G., Nam, W. J., Cha, H. L., et al. (2019). Prediction model for PV performance with correlation analysis of environmental variables. IEEE J. Photovoltaics 9 (3), 832–841. doi:10.1109/jphotov.2019.2898521
Leadbetter, J., and Swan, L. (2012). Battery storage system for residential electricity peak demand shaving. Energy Build. 55, 685–692. doi:10.1016/j.enbuild.2012.09.035
Liu, D., Wang, W., Wang, L., Jia, H., and Shi, M. (2021). Dynamic pricing strategy of electric vehicle aggregators based on DDPG reinforcement learning algorithm. IEEE Access 9, 21556–21566. doi:10.1109/access.2021.3055517
Manoj, N., Vigneshkumar, B., Kumar, A. G., and Sindhu, M. R. (2023). “Optimal sizing and operation of PV based battery swapping station considering EV uncertainties for an Indian residential community,” in 2023 7th International Conference on Computer Applications in Electrical Engineering-Recent Advances (CERA), Roorkee, India, 1–6.
Ortenzi, F., Orchi, S., and Pede, G. (2017). “Technical and economical evalutation of hybrid flash-charging stations for electric public transport,” in 2017 IEEE International Conference on Industrial Technology (ICIT), Toronto, ON, Canada, 22-25 March 2017, 549–554.
Ribeiro, P. F., Johnson, B. K., Crow, M. L., Arsoy, A., and Liu, Y. (2001). Energy storage systems for advanced power applications. Proc. IEEE 89 (12), 1744–1756. doi:10.1109/5.975900
Tu, H., Feng, H., Srdic, S., and Lukic, S. (2019). Extreme fast charging of electric vehicles: a technology overview. IEEE Trans. Transp. Electrification 5 (4), 861–878. doi:10.1109/tte.2019.2958709
Van Roy, J., Leemput, N., Geth, F., Büscher, J., Salenbien, R., and Driesen, J. (2014). Electric vehicle charging in an office building microgrid with distributed energy Resources. IEEE Trans. Sustain. Energy 5 (4), 1389–1396. doi:10.1109/tste.2014.2314754
Wang, F., Zhang, S., Zhao, Y., Ma, Y., Zhang, Y., Hove, A., et al. (2023). Multisectoral drivers of decarbonizing battery electric vehicles in China. PNAS Nexus 2 (5), pgad123. doi:10.1093/pnasnexus/pgad123
Wi, Y.-M., Lee, J.-U., and Joo, S.-K. (2013). Electric vehicle charging method for smart homes/buildings with a photovoltaic system. IEEE Trans. Consumer Electron. 59 (2), 323–328. doi:10.1109/tce.2013.6531113
Xuewei, S., et al. (2020). “Research on energy storage configuration method based on wind and solar volatility,” in 2020 10th International Conference on Power and Energy Systems (ICPES), Chengdu, China, 25-27 December 2020, 464–468.
Yao, W., Zhao, J., Wen, F., Dong, Z., Xue, Y., Xu, Y., et al. (2014). A multi-objective collaborative planning strategy for integrated power distribution and electric vehicle charging systems. IEEE Trans. Power Syst. 29 (4), 1811–1821. doi:10.1109/tpwrs.2013.2296615
Yi, H., Lin, Q., and Chen, M. (2019). “Balancing cost and dissatisfaction in online EV charging under real-time pricing,” in IEEE INFOCOM 2019 - IEEE Conference on Computer Communications, Paris, France, 29 April 2019 - 02 May 2019, 1801–1809.
Zhang, Y., He, C., Zhang, M., and Wang, T. (2022). “Coordinated operation of power system and energy storage in the presence of high penetration of solar generation,” in 2022 4th Asia Energy and Electrical Engineering Symposium (AEEES), Chengdu, China, 25-28 March 2022, 334–339.
Keywords: electric vehicles, integration capacity, Distflow equation, voltage deviation, data analysis
Citation: Yu L, Chao L, Yihua L, Menghua D, Yanjun C and Ruochen D (2024) An economic evaluation model for charging stations of EVs in distribution networks with compensation devices and constraints. Front. Energy Res. 12:1416334. doi: 10.3389/fenrg.2024.1416334
Received: 12 April 2024; Accepted: 30 May 2024;
Published: 11 July 2024.
Edited by:
Tianyang Zhao, Royal Institute of Technology, SwedenReviewed by:
Xin Cui, The University of Hong Kong, Hong Kong, SAR ChinaLin Zeng, Cornell University, United States
Rongpeng Liu, McGill University, Canada
Zhigang Gao, Beijing Institute of Technology, China
Copyright © 2024 Yu, Chao, Yihua, Menghua, Yanjun and Ruochen. This is an open-access article distributed under the terms of the Creative Commons Attribution License (CC BY). The use, distribution or reproduction in other forums is permitted, provided the original author(s) and the copyright owner(s) are credited and that the original publication in this journal is cited, in accordance with accepted academic practice. No use, distribution or reproduction is permitted which does not comply with these terms.
*Correspondence: Lu Yu, bHlfc2NzaEAxNjMuY29t