 Fang He
 Yang Liu
 Qirui Feng
- Ministry of Education Offshore Wind Power Technology Engineering Research Centre (Shanghai University of Electric Power), Shanghai, China
The scale and cluster development of offshore wind power faces the constraints of high construction cost, limited submarine corridor resources, etc. Under the background of offshore wind power parity development, it is urgent to consider the actual constraints of the project and the impact of project income on the owner, and the construction of offshore public station and the optimal selection of transmission method have become an important measure to reduce the cost and increase the efficiency of offshore wind power. A life-cycle cost model for offshore wind farm cluster grid-connection system planning is constructed to consider the project income, and the offshore public station location and capacity, transmission method, and high-voltage cable selection and path are optimized, which are solved by an improved single parent genetic algorithm and a topology repair strategy based on graph theory. The results show that the proposed planning scheme can effectively improve the life-cycle project income of the grid-connection system and provide technical support for the grid-connection planning of large-scale offshore wind farm clusters.
1 Introduction
The offshore wind power market is expanding globally and has significant potential for development. According to statistics from the Global Wind Energy Council (GWEC), the newly installed capacity of global offshore wind power is expected to reach 8.8 GW in 2022, and 25 GW in 2025 (Global Wind Energy Council, 2023). The cumulative installed capacity of global offshore wind power is projected to reach 223 GW in the next 5 years. China’s offshore wind power development has a broad prospect, with developable wind power resources estimated to reach 3 billion kilowatts. China has a broad prospect for offshore wind power development, with the potential to develop wind energy resources amounting to 3 billion kilowatts. Large-scale offshore wind power development is an important measure to achieve the national dual-carbon strategy (National Development and Reform Commission, 2021).
As offshore wind power continues to develop, multiple large-scale offshore wind farms will be constructed or planned in the same sea area (Hardy et al., 2021). Project income has become a crucial factor affecting the construction of wind farms. The construction of offshore wind farm grid-connection system can benefit from cost reduction and efficiency improvement through the concept of offshore public station construction and the availability of multiple transmission methods. But the grid-connection system topology and output characteristics for large-scale offshore wind clusters is more complex than that of individual wind farms. It is urgent to optimize the cluster grid-connection planning method to achieve safe and effective access of large-scale offshore wind power clusters.
In the research on wind farm grid-connection system planning, the technical economics of different transmission methods for sending power are compared using the equal annual value method in (Huang et al., 2019). The dynamic and static costs of the project are considered in the (Li et al., 2023), which then selects the transmission method. The practical constraints of the project are considered in (Tang et al., 2018), which states that the high-voltage transmission line cannot pass through the interior of the wind farm. (Ergun et al., 2012). proposes an optimization algorithm for developing the offshore transmission network using genetic algorithms. It performs an economic and optimal optimization of transmission topology. Liu et al. (2022), Fu et al. (2018) considers the impact of wind farm cluster grid-connection planning on the onshore grid, and constructs a joint sea-land planning model. All of these studies only consider the construction cost of the grid-connection system, without taking into account the gain and loss of wind energy transmission, and do not analyze the costs over the life cycle of the wind farm. This makes it difficult to maximize income. The capacity, transmission mode and transmission path of the wind farm will affect the final project income.
In the construction of the project, it is important to consider additional constraints, operation and maintenance habits to optimize the offshore cable paths and connection methods of the grid-connection scheme (Conseil international des grands réseaux électriques Comité d’études B3, 2011). Previous discussions on topology optimization of grid-connection system for offshore wind farm clusters often treat these clusters as point-like offshore substation locations (Yang et al., 2013; Dahmani et al., 2013; Yang, 2016). These are solved using topology optimization methods for the internal collector systems of offshore wind farms. Xu et al. (2023) optimizes the wind farm collector lines using the PRIM algorithm. This method is not compliant with operation and maintenance requirements and poses significant safety risks. It involves high voltage submarine cables crossing through low and medium voltage submarine cable areas within the wind farm, disregarding the optimization rules for high voltage submarine cables in engineering practice.
The planning of grid-connection system for offshore wind farms is influenced by numerous factors. The methods mentioned above do not take into account all the possible application scenarios for large-scale offshore wind power. The lack of consideration for offshore public station construction ideas and transmission methods has resulted in failure to fully address the engineering requirements and income issues. This has made it difficult to achieve optimization of the offshore wind farm cluster grid-connection system under large-scale development scenarios.
To address the issues mentioned above, considering the actual engineering situation and income problems during the construction of the transmission system, we propose a planning model for a large-scale offshore wind farm cluster grid-connection system. This model takes into account the annual output characteristics of wind farms and the actual engineering requirements of the grid-connection system. We use an improved sing parent genetic algorithm to solve the problem and verify the validity and feasibility of the proposed model through simulation examples. This provides a computational method for the grid-connection system planning of offshore wind farms.
The remainder of this paper is structured as follows: Section 2 analyzes the influencing factors of the planning of offshore wind farm cluster grid-connection system. In Section 3, an offshore wind farm cluster grid-connection system model considering project income is proposed, and an improved single-parent genetic algorithm is used to solve the model. In Section 4, according to the constructed model and actual case data, a wind farm cluster grid-connection scheme is proposed. The model and algorithm are used to optimize the topology of wind farm cluster, and the accuracy and economy of the proposed method are verified, which is of great significance for friendly access of wind farm cluster. Finally, this paper summarizes in Section 5.
2 Analysis of factors influencing the planning of grid-connection system for offshore wind farm cluster
Offshore wind farm cluster grid-connection system is complex in structure and must take into account many factors, including the characteristics of the distribution and output of the offshore wind resource, the economics of the transmission method, the submarine situation and other influences.
2.1 Wind farm cluster output characteristics
The study of offshore wind farm cluster grid-connection planning problems requires an accurate description of the correlation and volatility characteristics of wind farm cluster output.
The most commonly used wind resource statistic is the Weibull distribution, whose distribution function and probability density function are shown in Eqs 1, 2
where
Neighboring wind farms have a correlation in output due to their geographical proximity. The Copula function can combine the distribution functions into a joint distribution function as Eq. 3 (Li et al., 2013):
The probability distribution and probability density of the output of each wind farm are obtained based on the individual outputs of historical wind farms, and the joint probability distribution of wind farms is obtained by constructing the N-dimensional copula function and solving the correlation coefficients. A large number of random scenarios are generated by Monte Carlo sampling, and the obtained data are analyzed by probability distance reduction method and fuzzy clustering algorithm, which can obtain typical scenarios reflecting the correlation and uncertainty of wind farm cluster output.
2.2 Analysis of project income sources
Due to the convergence effect of large wind farm clusters, the total power fluctuation of the wind farm cluster output is flat, and the maximum output power reduction is about 90% of the installed capacity (Clay, 2014). On the other hand, operational data show that the output power of offshore wind farms is less than 20% of the installed capacity in more than 50% of the cases, and the average annual output power is about 33% of the installed capacity (Australian Energy Market Operator and Bureau of Meteorology, 2024).
As shown in Figure 1, taking the output characteristic curve of a wind farm cluster in Jiangsu Province as an example, the convergence effect can be clearly demonstrated. This output characteristic will lead to a long-term low load state of the transmission line, and if the outgoing wind power transmission capacity is planned according to the total installed capacity of the wind farm cluster, it is likely to result in over-allocation of transmission capacity, thus reducing the operational efficiency of the transmission system.
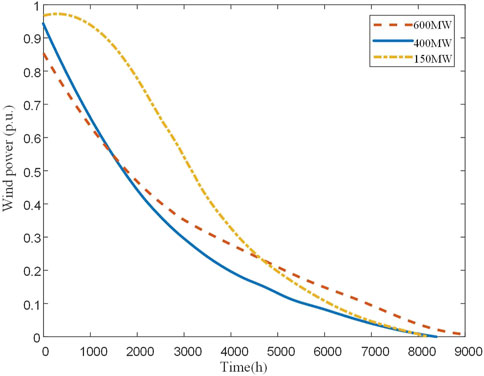
Figure 1. Wind farm cluster output characteristic curve.
The analysis of the income source of the project through optimizing the outgoing transmission capacity of wind power is shown in Figure 2 and Eqs 4–7 below:
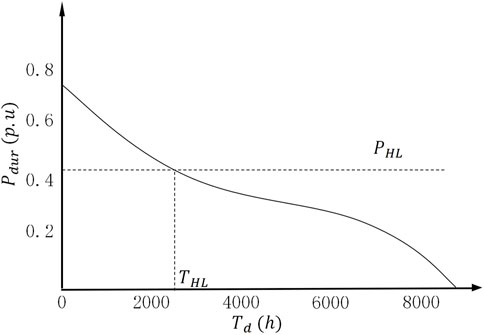
Figure 2. Outgoing capacity optimization schematic diagram.
The cost of investing in submarine cables is influenced by the choice of cables and is directly proportional to the outgoing power. Lowering the transmission capacity for wind power can reduce the cost of system construction, but it also increases the loss of abandoned wind power. Increasing the transmission capacity for wind power can boost income from wind power transmission, but it also raises the cost of system construction.
Where: Ewind is the amount of wind power delivered through the given transmission capacity limit, PHL is the given cable transmission capacity, THL is the duration of the wind farm cluster’s output above PHL, Pdur(t) is the annual sustained output curve of the wind power, and Eloss is the amount of wind power lost under the transmission capacity limit.
Where: f is the whole life project income of the wind farm grid-connection system, Call is the life-cycle cost of the system for a given transmission capacity, Bwind is the income from the sale of electricity, er is the feed-in tariff, and PV. sum is the present value conversion factor.
Through PHL optimization, the optimal cable capacity can be obtained by taking into account the system life-cycle cost and the income from electricity sales.
2.3 Optimization methods for the siting of offshore public station
It is practical and cost-effective to connect multiple offshore wind farms to the grid via a public offshore substation or converter station (Fu et al., 2018), as shown in Figure 3, and to save submarine corridor resources by planning a single offshore transmission cable route.
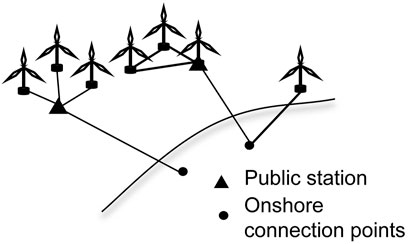
Figure 3. Public station diagram.
In this process, it is necessary to optimize the site selection of the public station, and a reasonable site selection can effectively reduce the construction cost of the grid-connection system. The public station siting capacity problem is coupled with the transmission mode selection problem and the wind farm delivery capacity problem, and the optimization results of the public station can be obtained by iterative solving.
The optimization model of public station siting is shown in Eqs 8, 9:
where: CLS,i is the cost of the transmission line from the wind farm to the public station; CHS is the cost of the transmission line from the public station to the onshore connection point.
The direct connection of the wind farms is considered when the siting result is the same as the location of the central substation of the wind farm.
2.4 Economic analysis of different transmission methods
Currently, the most common transmission methods for offshore wind power are HVAC and VSC-HVDC. The choice of transmission method is influenced by transmission distance and transmission capacity. The applicable transmission method for wind farms can be obtained by constructing a life-cycle cost model for the grid-connection system of offshore wind farms.
When using HVAC transmission, the initial investment cost of the grid-connection system consists of Equation 10
Where: Cinv. ac is the initial investment cost of HVAC transmission system, Csub. ac is the construction of offshore substation investment costs, Ccab. ac is the cable investment, Ccomp is reactive power compensation device investment.
When the use of VSC-HVDC transmission, the initial investment cost of the system by Equation 11
Where: Cinv. dc for VSC-HVDC transmission system initial investment costs, Csub. dc for the construction of offshore substation investment costs, Ccab. ac for cable investment, Cconv for the construction of offshore converter station investment costs.
According to the known offshore distance and transmission capacity of offshore wind farms, we can get the best economic transmission mode selection scheme.
2.5 Impact of submarine pathways and engineering constraints
With the trend of developing wind farms in deep and distant waters, the cost of submarine cables will continue to increase. Considering the actual engineering needs, the simple application of the distance between two points connected to the line to calculate the length of the submarine cable will affect the accuracy of the results and even influence the selection of the design programmed. In the process of laying submarine cables, it is necessary to consider the limitations of operation and maintenance, as well as the actual situation of the seabed, which does not allow submarine cables to cross and traverse the inside of the wind farm, and the sea area of the coastal installation of the prohibited wiring zone.
In this paper, an ant colony algorithm based on raster maps is used to optimize the submarine cable paths, and the actual routing channels and distances of the submarine cables are obtained. A diagram of the method is shown in Figure 4.
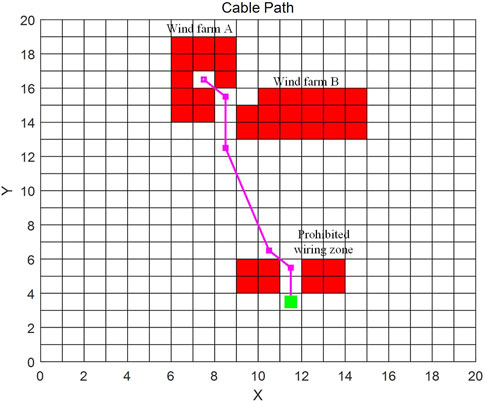
Figure 4. Submarine cable path optimization diagram.
First, according to the known seabed environment, the path planning map based on the raster method is established (Zhou et al., 2014), and in the raster method matrix, the prohibited cabling area and the area within the wind farm field are set to 1, and the permitted cabling sea area is set to 0. The global search in the form of an octree is performed by using the ant colony algorithm.
The search steps are as follows:
1) The starting point is set to wind farm 1 and onshore connection point 1;
2) The ants find the optimal path after N collision-free iterative movements to reach the target onshore connection point;
3) Sequentially calendar all wind farms and onshore connection points;
4) Record the length of each laying channel and the distance, and construct the distance matrix.
On the one hand, compared with the simple use of two-point distance calculation, reduces the appearance of the problem that the design of submarine cable is out of the actual situation. On the other hand, compared with the artificial selection of paths, it can effectively improve the economy of the offshore wind farm grid-connection system.
The generated paths are used to judge whether there is a crossing of the submarine cable using the fast exclusion experiment and the straddle experiment. The fast exclusion experiment is to judge whether there is an overlap of the two rectangles by taking the two line segments Q1Q2 and P1P2 as two rectangles diagonally, i.e., whether there is an overlap of the two line segments in the projection on the x,y-axis, as shown in Figure 5.
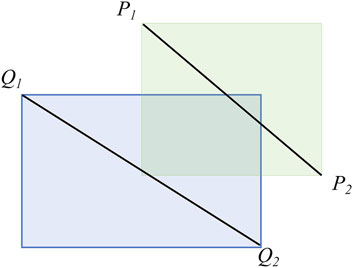
Figure 5. Fast exclusion experiment diagram.
The intersection of two rectangles is filtered by this experiment, and further straddle experiments are performed to show that two line segments intersect if both segments satisfy if both segments satisfy Eq. 12.
3 Construction of offshore wind farm cluster grid-connection system model considering project income
3.1 Wind farm cluster grid-connection system planning model
3.1.1 Objective function
To construct a planning model for the grid-connection system of offshore wind farms cluster considering capacity optimization and transmission mode selection, with the objective function of maximize the income projects of wind farm grid-connection system. As shown in Eq. 13.
Where S is the set of operating scenarios; ξs is the probability of occurrence of scenario s; Call,s is the life-cycle cost of the system under scenario s; Bwind,s is the income from the sale of electricity under scenario s, subtract the two to get the life cycle project income.
The life-cycle cost is used as a theoretical basis and also as part of the evaluation index to assess the adaptability of the evaluation model (Yang et al., 2016). The life-cycle cost of the system includes the initial investment cost, the cost of power losses during operation, the cost of maintenance, the cost of losses due to abandonment and the cost of recovery at the end of the life. As shown in Eq. 14.
Where: CO is the cost of operational losses, CM is the cost of maintenance, CF is the cost of loss due to failure, CDown is the cost of loss due to wind abandonment; CInv is the cost of initial construction investment; CD is the cost of equipment recovery; PV. sum is the factor for calculating the present value as shown in Eq. 15; PV is the discount factor as shown in Eq. 16.
where: r is the cost discount rate, usually 0.08, n is the lifetime of the offshore wind farm, usually 25 years.
The initial investment cost CInv includes the construction of the offshore substation Csub, submarine cables Ccab, reactive power compensation device Ccomp and offshore converter station Cconv. As shown in Eq. 17.
It is calculated as shown in Eqs 18–21:
The cost of the offshore substation includes the construction cost of transformer sets and offshore platforms.
Where: Nsub is the total number of offshore substation; Ssub is the set of optional transformer costs; mi is the number of transformers; Cplat,i is the construction and installation costs of offshore platforms.
The investment cost of submarine cable construction is calculated as Eq. 19:
Where: Ncab is the number of segments of high-voltage transmission cables; Scab is the set of unit costs of optional submarine cables s; li is the transmission distance of high-voltage submarine cables.
If wind farms are sent out by HVAC transmission, a certain amount of reactive power compensation is also needed to reduce transmission losses.
Where: Ncomp is the number of wind farms using AC transmission with reactive power compensation; pR is the cost of reactive power compensation equipment per unit capacity; Scomp,i is the reactive power compensation capacity of the wind farm i.
The cost of the offshore converter station includes the investment cost for the construction of the flexible converter equipment and the offshore platform.
Where: Nconv is the number of offshore converter stations; Sconv,i is the cost of the offshore converter station i.
Maintenance cost CM mainly refers to the labor cost and material cost for the maintenance and overhaul of the equipment, which is different due to the different composition of the infrastructure and marine platforms for the AC system and the DC system and the different cables selected. According to the rich experience of offshore wind power operation and maintenance, the maintenance rate m, is defined and the value is shown in Table 1, and the calculation method is shown in Eq. 22:
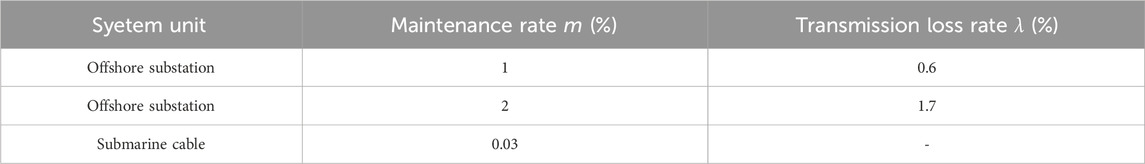
Table 1. Component maintenance rates and transmission loss rates for offshore wind farms.
Operational losses CO mainly include power transmission losses in high-voltage submarine cables, as well as transformer losses, converter station losses. As shown in Eqs 23–25.
Where: Co. cable is the cable transmission loss,
Failure loss CF affected by topology, the annual expectation model is chosen to represent it. As shown in Eq. 26. For a given grid-connection system planning scenario, the sub-topology is analyzed for different fault states to obtain the corresponding fault probability and downtime.
Where: kH is the annual number of high-voltage cable failures, tH is the high-voltage cable fault repair time, nH is the number of wind farms affected by the failure,
Wind abandonment losses CDown and wind energy income are calculated as shown in Eqs 27, 28.
Where: el is the compensation due to wind abandonment losses (calculated on the basis of the unit price of wind power generation).
3.1.2 Model constraints
The model needs to take into account the dynamic and thermal stability of submarine cables, the practicalities of the submarine cable corridor, the upper bound of the construction cost and the lower bound of the wind energy utilization.
The voltage calibration and thermal stabilization of the submarine cable is shown in Eqs 29, 30:
Where:
Where xij. min and xij. max are upper and lower bounds on the number of lines to be constructed between nodes i and j. Constraints on the construction cost and wind energy utilization are shown in Eqs 33, 34.
Where Call,max is the upper bound of the full cycle lifetime cost of the planning scenario; Pw,i,s(t) and
Considering the variability of the seabed, the stability of the cable operation and the compatibility of future maintenance, the cables cannot cross each other, so the fast rejection experiment and the straddle experiment are used to assess whether there is any crossing of the cables with other cables. The design requires that all wind farms in the cluster are connected, either via the aggregation station or directly to land, and if there are wind farms that are not connected to land, the connectivity constraints are not met.
3.2 Model solving methods
According to the specific characteristics of the optimal design of the electrical system, the offshore wind farm grid-connection system planning method based on Single Parent Genetic Algorithm is designed. Single Parent Genetic Algorithm (SPGA for short) is based on the traditional genetic algorithm to cancel the crossover operator, all genetic operations are targeted to only one individual, genetic operation is simple, the computational efficiency is relatively high, the diversity of individuals in the initial population is less demanding, and at the same time the problem of “early convergence” is weakened. At the same time, the problem of “early convergence” is mitigated (Yang et al., 2021).
In the computational process, a penalty function is usually introduced to deal with this constraint, in order to ensure the connectivity of the topology. However, if only the connectivity of the graph is added to the algorithm as a judgement condition, a large number of invalid subgenerations will be generated in the iterative process, reducing the computational speed and convergence of the algorithm. Therefore, an idea based on the graph theory Boruvka algorithm is used to repair the invalid children. The repair strategy is shown in Figure 6 below:
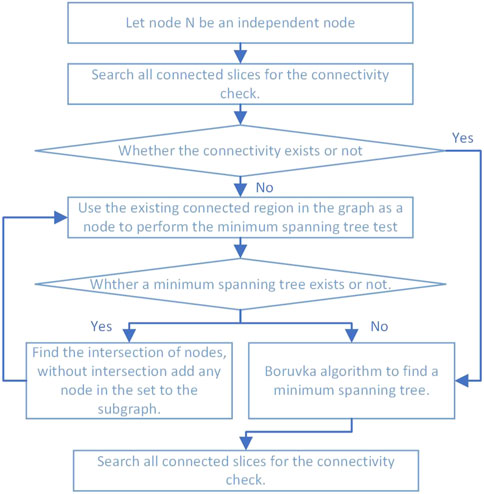
Figure 6. Flow chart of repair strategy.
3.3 Optimizing processes
Based on the model established in the above chapters, an improved single parent genetic algorithm is used to optimize the site selection, topology, transmission method and capacity of the public station of the offshore wind farm grid-connection system. Meanwhile, in the iterative process, the topology repair strategy based on graph theory is used to reduce the generation of invalid sub-generations, accelerate the computation rate and improve the convergence ability, and the flowchart is shown in Figure 7.
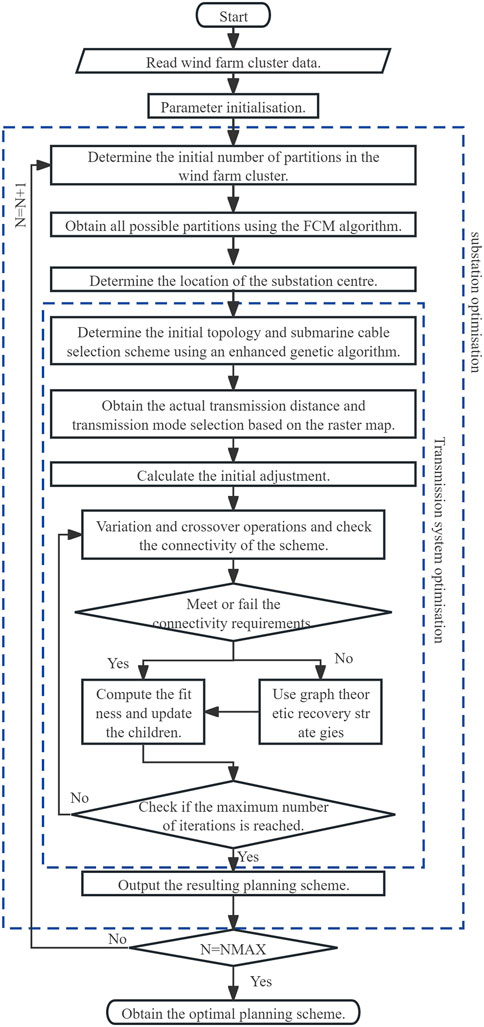
Figure 7. Flow chart of optimizing.
The main steps are as follows:
1) Read offshore wind farm data, including coordinates, capacity, equipment data and wind power;
2) Determine the initial grouping of the wind farm using genetic algorithm, and obtain the actual distance of cable laying based on the raster map.
3) Obtain the site plan of the public station according to the objectives in section 2.3;
4) Preferred transmission mode and transmission capacity, generate initial scheme for adaptation calculation.
5) Output the design scheme, and the output results are fed back to step 2, starting the next iteration of optimization.
4 Example analysis
4.1 Description of example scenarios
The cluster of offshore wind farms selected for the case study consists of 16 offshore wind farms with a distance from shore of 60–100 km and a total capacity of 3700 MW, all belonging to the same planning period for construction, with a high-voltage submarine cable voltage level of 220 kV and a discount rate r of 8%. The lifetime of the offshore wind farm is 25 years el is $0.6/(kW-h); er is $0.06/(kW-h).
The historical wind speed data used to fit the probability distribution function is taken from Jiangsu Province for all years. And the installed capacity of each offshore wind farm is as follows Table 2:
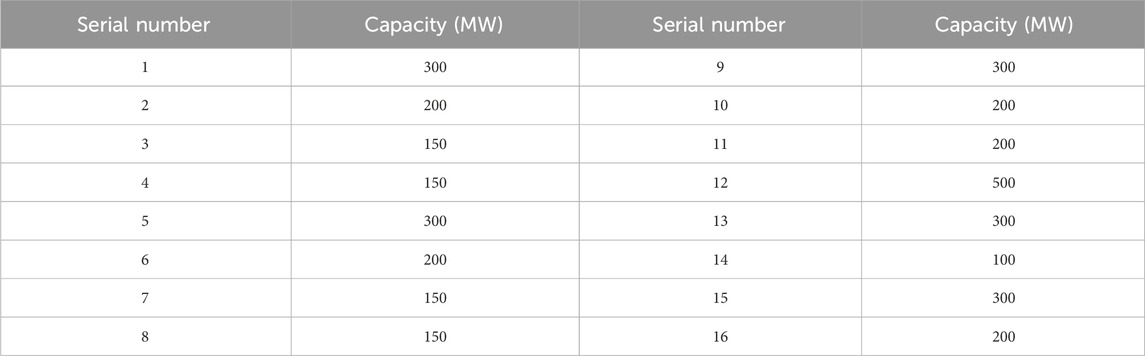
Table 2. Installed capacity of each wind farm.
The distribution of offshore wind farm clusters and the location of onshore connection points for different construction periods are shown in Figure 8:
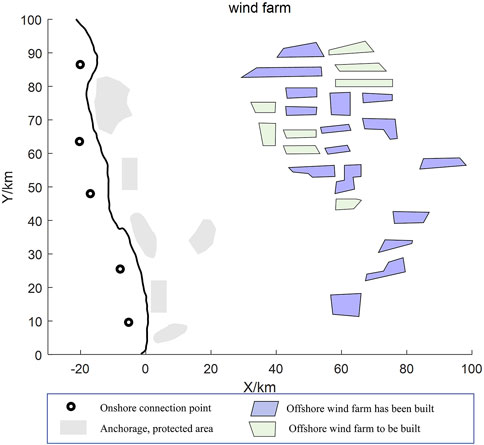
Figure 8. The distribution of offshore wind farm clusters.
4.2 Results of planning scenarios
4.2.1 Conveyance distance optimisation results
The model systematically models the topology of the grid-connection system for large offshore wind farm clusters. The submarine characteristics of the sea area and the engineering practice are fully considered, and an optimization algorithm is used to obtain the accurate transmission distance.
Considering the seabed conditions and operation and maintenance requirements, the raster map of the wind farm cluster transmission system access is constructed, and the actual submarine cable route distance is calculated by using the ACO algorithm, and the results are shown in Table 3 below. (Taking the point-to-point access distance to the nearest onshore connection point as an example).
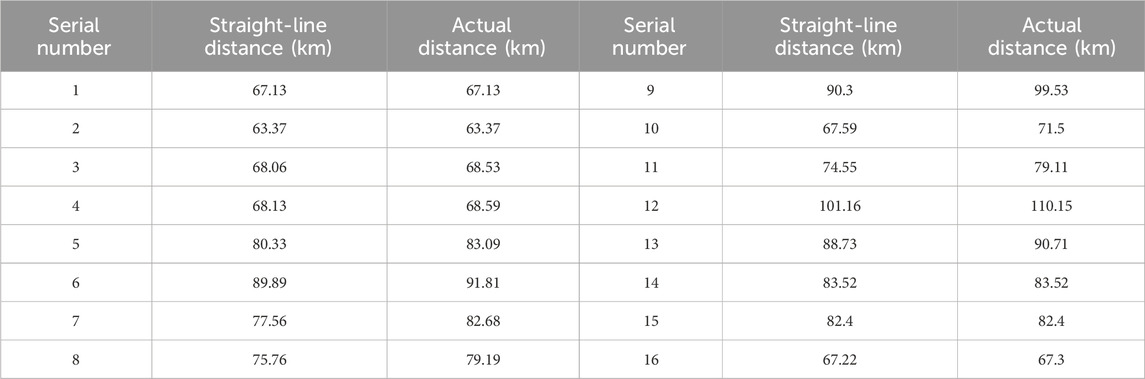
Table 3. Wind farm offshore distance.
As shown in Table 3, affected by the setting of the sea environment, the overall increase in the sea cable laying distance compared to the conventional calculation using a two-point distance is approximately 3.5%. Taking Wind Farm 9 as an example, the actual design distance of the submarine cable is increased by 10.2%. Will greatly affect the choice of transmission methods and cable selection, thus affecting the overall practical calculation of optimization results.
4.2.2 Cluster optimization results considering project income
The offshore wind farm cluster grid-connection system economy as the goal of planning, three different schemes are obtained using the same model and compared.
Using the traditional point-to-point method of wind farm cluster grid-connection system planning for scheme A, using the consideration of public station construction of wind farm cluster grid-connection system planning for scheme B, comprehensive consideration of public station construction and project income of planning for scheme C.
Schemes A and B are the schemes without considering the project income, and the installed capacity of the wind farm is used for the selection of the equipment. Schemes B further considers the design of the offshore public station based on Schemes A, converges the power of the wind farm and builds a unified channel to send out the power. Schemes C optimizes the selection of submarine cables based on Schemes B, so that schemes C achieves greater project income.
The comparison results of the three planning schemes are shown in Table 4.
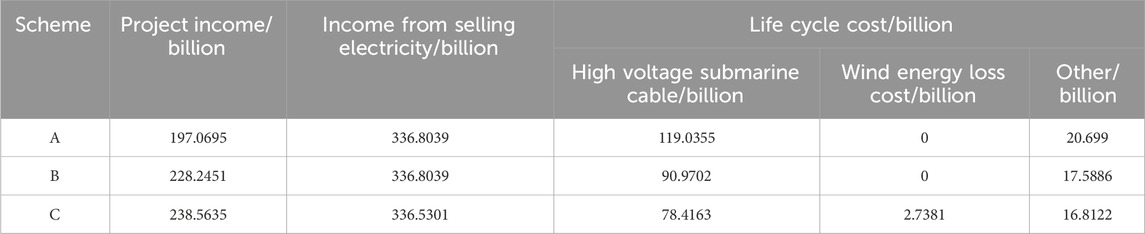
Table 4. Comparative economic statement.
Considering the construction of an offshore public station and optimizing the transmission method and capacity for outgoing transmission, the results are shown in Figure 9:
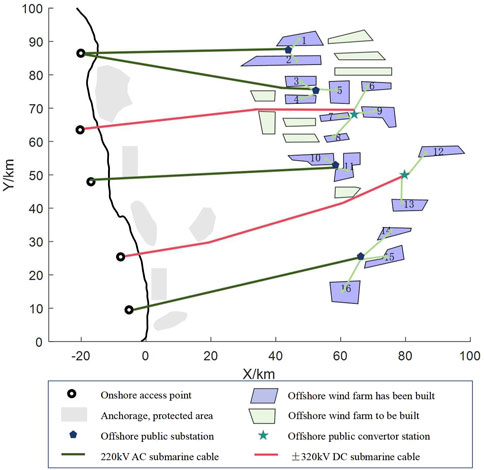
Figure 9. Graph of optimization result.
The red line in the figure indicates the ±320 kV DC submarine cable, the green line indicates the 220 kV AC submarine cable and the light green line indicates the 35 kV collector submarine cable.
The location plan of the public station is (44.29,87.42), (52.134,75.94), (64.29,69.14), (58.81,52.73), (79.76,50.16), (66.90,25.31).
If the wind farms are planned separately, i.e., the line capacity is determined according to the installed capacity, and the individual wind farms are connected directly to the onshore connection point planning method, the life-cycle cost for the cluster of wind farms reaches $13.973 billion, which is an increase of 28.7% compared to scheme B.
In addition, taking wind farms 6, 7, 8 and 9 as an example, under the original point-to-point access mode, four three-wire AC cables are required, occupying 40 m of coastline, while under the public delivery method, only two DC cables are required for delivery, occupying only 20 m of coastline, and the implementation of the design scheme has less impact on the marine ecosystem and the natural coastline.
A careful analysis of Table 4 leads to the following conclusions:
In the submarine cable investment cost section, in traditional studies, the most commonly adopted method for accessing offshore wind farms is to connect individual wind farms directly to the nearest onshore connection point, which would result in an extremely high submarine cable investment cost of $11.903 billion, as mentioned in Scheme A. Scenario B uses a shared submarine cable solution, resulting in a 23.5% reduction in submarine cable cost.
According to the dispatch operation data, the effective output of wind power at 95% confidence level is about 67%, and the transmission system facilities are under low load for a long period of time. Considering the capacity optimization of the submarine cables is conducive to increasing the full cycle life system project income. Based on this data, Scheme C further optimizes the capacity of the submarine cables, resulting in a reduction of the submarine cable cost to $7.841 billion, a reduction of 34.1% compared to Scheme A.
Considering the public station construction and project income, Scheme C is the best Scheme, and the project income of Scheme C are optimal, with an increase of 21.06% and 4.52% compared to Scheme A and Scheme B, respectively.
5 Conclusion
This paper proposes an offshore wind farm cluster grid-connection system design methodology that considers project income, analyses the impact of sea conditions on cable paths and the impact of cable capacity on economic costs, and implements an offshore wind farm cluster grid-connection system optimization that considers life-cycle costs and power sales benefits. Through the analysis of a large offshore wind farm cluster example, the following conclusions are drawn.
(1) The method is able to optimize the overall planning of the offshore wind farm cluster grid-connection system, including the selection of the location of the offshore substation, the topology design of the high-voltage transmission line and the selection of the submarine cable, and the selection of the location of the onshore connection point. Among them, when the wind farm is sent out by public stations, compared with point-to-point access, it reduces the offshore wind farm cluster construction cost by $3.118 billion, and the optimization rate reaches 28.7%.
(2) Considering the sea area situation and the technical operation and maintenance constraints, the results are more in line with the technical reality and have better practical significance.
(3) Compared with the conventional method of designing the transmission capacity according to the total installed capacity of the wind farm cluster, the method in this paper can reduce the transmission capacity and achieve better comprehensive income of the transmission project. It provides an effective means to evaluate the economic scheme for the transmission of 10 million kW offshore wind power cluster.
Data availability statement
The original contributions presented in the study are included in the article/Supplementary material, further inquiries can be directed to the corresponding author.
Author contributions
FH: Writing–original draft. YL: Writing–original draft, FQ: Writing–original draft. SW: Writing–review and editing.
Funding
The author(s) declare that no financial support was received for the research, authorship, and/or publication of this article.
Conflict of interest
The authors declare that the research was conducted in the absence of any commercial or financial relationships that could be construed as a potential conflict of interest.
Publisher’s note
All claims expressed in this article are solely those of the authors and do not necessarily represent those of their affiliated organizations, or those of the publisher, the editors and the reviewers. Any product that may be evaluated in this article, or claim that may be made by its manufacturer, is not guaranteed or endorsed by the publisher.
References
Australian Energy Market Operator, and Bureau of Meteorology (2024). Current Wind Energy Generation. Available at: https://anero.id/energy/wind-energy (Accessed May 22, 2024).
Clay, R. (2014). Sharing lessons learned and good practice in offshore transmission. Available at: https://1library.net/document/q049omvz-sharing-lessons-learned-good-practice-offshore-transmission.html (Accessed May 22, 2024).
Conseil international des grands réseaux électriques Comité d’études B3. (2011). Guidelines for the design and construction of AC offshore substations for wind power plants. Paris: CIGRE.
Dahmani, O., Bourguet, S., Guerin, P., Machmoum, M., Rhein, P., and Josse, L. (2013). “Optimization of the internal grid of an offshore wind farm using Genetic algorithm,” in 2013 IEEE grenoble conference (Grenoble: IEEE), 1–6.
Ergun, H., Van Hertem, D., and Belmans, R. (2012). Transmission system topology optimization for large-scale offshore wind integration. IEEE T Sustain Energ 3, 908–917. doi:10.1109/tste.2012.2199341
Fu, Y., Liu, Y., Huang, L. L., Wei, S. R., and Liu, L. J. (2018). Optimization of the networking of the cluster access system of offshore wind farms. Proc. CSEE 38, 3441–3450+3. doi:10.13334/j.0258-8013.pcsee.171310
Global Wind Energy Council. (2023). Global wind report 2023. Available at: https://gwec.net/globalwindreport2023/(Accessed May 22, 2024).
Hardy, S., Ergun, H., and Van Hertem, D. (2021). A greedy algorithm for optimizing offshore wind transmission topologies. IEEE Trans. Power Syst. 37, 2113–2121. doi:10.1109/tpwrs.2021.3121017
Huang, M. H., Wang, X. L., Liu, S. Q., Wang, X. F., Meng, Y. Q., and Ye, R. (2019). Technical and economic analysis on fractional frequency transmission system for integration of long-distance offshore wind farm. Power Syst. autom. 43, 167–174.
Li, H., Jiang, K., Lu, Z., Hou, J., Xu, S., Qi, W., et al. (2023). Optimization of the offshore wind power grid-connected structure based on an improved genetic algorithm. Front. Energy Res. 11, 1140711. doi:10.3389/fenrg.2023.1140711
Li, J. H., Wen, J. Y., Cheng, S. J., and Wei, H. (2013). A scenario generation method considering the correlation between the output of multiple wind farms. Proc. CSEE 33, 30–36+21. doi:10.13334/j.0258-8013.pcsee.2013.16.012
Liu, Y., Fu, Y., Huang, L., Ren, Z., and Jia, F. (2022). Optimization of offshore grid planning considering onshore network expansions. Renew. Energ 181, 91–104. doi:10.1016/j.renene.2021.08.117
National Development and Reform Commission (2021). 14th five-year. Reform Energy Document No, 1445. Available at: https://www.ndrc.gov.cn/xxgk/zcfb/ghwb/202206/(Accessed May 22, 2024).
Tang, L. L., Ren, H., Qiao, Y. Y., Zhang, Y. Y., and Zhang, G. Z. (2018). Topology optimisation of offshore wind cluster transmission system based on improved ant colony algorithm. Renew. Energy 36, 1826–1832. doi:10.3969/j.issn.1671-5292.2018.12.015
Xu, C., Jiao, Z., Han, X., Huang, Y., Wang, J., Zhang, H., et al. (2023). Comprehensive layout optimization of the transmission system in a deepwater wind farm cluster. Front. Energy Res. 11, 1268291. doi:10.3389/fenrg.2023.1268291
Yang, F., Xu, H. L., and Huang, L. L. (2016). Whole life cycle cost analysis of collector system for offshore wind farms. Power Syst. Autom. 40, 7. doi:10.7500/AEPS20160321015
Yang, F. U., Jing, W. U., and Wei, S. (2013). Topology optimization and planning of power collection system for large-scale offshore wind farm. Power Syst. Technol. 37, 2553–2558. doi:10.13335/j.1000-3673.pst.2013.09.033
Yang, J., Sun, T., Huang, X., Peng, K., Chen, z., Qian, G., et al. (2021). Optimizing painting sequence scheduling based on adaptive partheno-genetic algorithm. Processes 9, 1714. doi:10.3390/pr9101714
Yang, Z. (2016). Optimal design of power collection system for wind farm based on PSO algorithm. Electr. Meas. Instrum. 53, 113–119. doi:10.3969/j.issn.1001-1390.2016.19.021
Keywords: offshore wind farm clusters, optimal planning, life-cycle cost, project income, grid-connection system
Citation: He F, Liu Y, Feng Q and Wei S (2024) Grid-connection transmission system planning of offshore wind farm cluster consider the project income. Front. Energy Res. 12:1416225. doi: 10.3389/fenrg.2024.1416225
Received: 12 April 2024; Accepted: 10 June 2024;
Published: 25 July 2024.
Edited by:
Joshuva Arockia Dhanraj, Dayananda Sagar University, IndiaReviewed by:
Carlos Pérez-Collazo, Defense University Center, University of Vigo, SpainProsun Roy, University of Wisconsin–Platteville, United States
Copyright © 2024 He, Liu, Feng and Wei. This is an open-access article distributed under the terms of the Creative Commons Attribution License (CC BY). The use, distribution or reproduction in other forums is permitted, provided the original author(s) and the copyright owner(s) are credited and that the original publication in this journal is cited, in accordance with accepted academic practice. No use, distribution or reproduction is permitted which does not comply with these terms.
*Correspondence: Shurong Wei, d2Vpc2h1cm9uZ0BzaGllcC5lZHUuY24=