 Pan Lei*
 Jinquan Zhao
- College of Electrical Engineering, Shanghai University of Electric Power, Shanghai, China
The short-circuit ratio index (SCR) can effectively quantify the voltage support strength in traditional DC grid-connected scenarios, yet it cannot reasonably describe the voltage support strength in diverse device grid connection scenarios. This paper introduces a new calculation method of the complex short-circuit ratio index (
1 Introduction
With the integration of new energy generation devices such as wind and photovoltaic power into the grid, a new type of power system dominated by renewable energy has been formed. This shift has led to profound changes in both internal mechanisms and external characteristics governing the stable operation of the AC grid (Zhou et al., 2014; Chen et al., 2017). In order to accurately assess the voltage restoration capability during grid faults, the concept of “voltage support strength” has been proposed. To effectively describe this abstract concept of grid voltage support strength, appropriate index need to be employed. In the context of traditional DC grid-connected systems, the short-circuit ratio index (IEEE Standards Board IEEE Std 1204-1997, 1997) can reasonably indicate the grid’s voltage support strength.
SCR is used in DC planning problems (IEEE Standards Board IEEE Std 1204-1997, 1997) to measure the AC system’s acceptance capacity of the DC system. When multiple DC lines connect to the same point to form a multi-infeed system, the concept of Multi-Infeed Short-Circuit Ratio (MISCR) was derived based on the short-circuit ratio index through power conversion (Lin et al., 2008). As SCR continues to evolve and improve, its application scenarios are expanding, with widespread applications in power system steady-state voltage stability, transient voltage stability, and harmonic resonance. For example, references (Sun et al., 2023a) and utilize SCR to characterize voltage support strength, quantitatively analyzing the impact of voltage support (Sun et al., 2023b) strength in new energy grid-connected systems on post-fault steady-state voltage security issues and quantifying the effect of voltage support strength on transient overvoltage in new energy grid-connected systems. Reference (Yin et al., 2019) analyzes the relationship between reactive power short-circuit ratio and transient overvoltage from the perspective of parallel resonance.
In the current power grid, the dynamic interplay between device-side components and the AC power grid undergoes constant evolution due to the integration of diverse reactive power compensation technologies and new energy grid interfaces. As a result, the mechanisms of mutual influence between the device and the AC grid are continually changing. To accurately assess the voltage support strength of the contemporary power grid, scholars have refined the short-circuit ratio index in response to these developments. Reference (Sun et al., 2021), building upon the physical principles of the short-circuit ratio, introduces the concept of the Multiple Renewable Energy Station Short-Circuit Ratio (MRSCR), considering interactions between sites and substations. This includes the provision of analytical expressions for calculating different impedance ratio ranges based on the relationship between system impedance ratio and short-circuit ratio. Furthermore, Reference (Kim et al., 2022) proposes the Hybrid Multi-Infeed Effective Short-Circuit Ratio (HMESCR) by evaluating the reactive power control capability of VSC-HVDC systems composed of power electronic fully controlled elements, elucidating the relationship between transient overvoltage and HMESCR through comparative studies. Additionally, Reference (Huang et al., 2023) proposes the Multi-Infeed Transient Short-Circuit Ratio (MITSCR) by leveraging the characteristics of stochastic variations in both the amplitude and phase of short-circuit currents from new energy sources and terminal voltages. This is used to quantitatively evaluate the voltage support strength of multi-input HVDC transmission systems accommodating a high proportion of new energy grid connections.
In the new energy power system, the methodology for quantifying grid voltage support strength using the short-circuit ratio index differs significantly from that of traditional power grids. In traditional DC grid-connected systems, the value 2 is commonly regarded as the critical threshold of the short-circuit ratio index. When the index falls below 2, the system is classified as extremely weak and unstable. However, in the case of new energy grid integration systems, ensuring stable operation does not necessarily mandate SCR exceeding 2. Reference (Sun et al., 2021) conducted electromechanical transient simulation analysis on the proposed SCR of new energy substations to ascertain critical instability phenomena within the system. It was observed that when SCR of multiple new energy substations within the network range between 1.7 and 2.1, they can adequately fulfill the operational requirements of the connected new energy generation device. With a prudent engineering margin factored in, it is deemed reasonable for CSCR of new energy substation network nodes to fall within the range of 2.0–2.5. Reference (Kang et al., 2020) derives the transmission limit of static voltage instability and integrates it into SCR to obtain a critical short-circuit ratio value of
Based on the analysis above, it is evident that in assessing the current voltage support strength of the power grid using SCR, a novel index is commonly introduced building upon the existing short-circuit ratio index. Subsequently, the critical threshold of this new index is determined based on the system’s critical conditions to quantitatively evaluate the voltage support strength of the power grid.
The main contributions of this paper are summarized below.
1. This paper illustrates that critical short-circuit ratios vary under different assumed conditions, as deduced from the derivation of threshold values for the short-circuit ratio index. The critical value of 2 is derived under specific hypothesis conditions.
2. The calculation method of the complex short-circuit ratio index which can take into account the equivalent impedance angle and Thevenin equivalent impedance angle of device is proposed. Then, according to the critical condition of static voltage stability of the system, the threshold value of the complex short-circuit ratio is derived to quantitatively evaluate the voltage support strength under grid-connected scenario. The accuracy and rationality of the complex short-circuit ratio index to evaluate the voltage support strength in grid-connected scenario are verified by the example analysis.
2 Analysis of the short-circuit ratio index
Figure 1 shows a simplified model of the grid-connected system for any device:
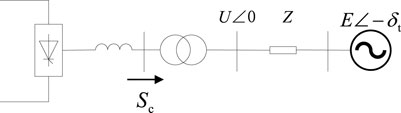
Figure 1. Simplified model of single device grid-connected system.
In Figure 1,
With the assumption that the input power of the device equals the rated DC power, the short-circuit ratio index is defined as the ratio between the short-circuit capacity of the converter station’s AC bus and the rated DC power (Xu, 1997), namely,:
Where,
If the reference voltage of the AC system is set to the rated value of the AC bus voltage, and the reference power is set to the rated DC power, then SCR can be expressed as:
Where,
The critical short-circuit ratio index is derived from the critical stability conditions of the system and serves as a quantitative measure to evaluate the critical threshold of voltage support strength within the power grid. In traditional power systems primarily driven by synchronous machines, a short-circuit ratio value of 2 is employed as the critical threshold for classifying system strength. Systems with the short-circuit ratio index below 2 are categorized as very weak, those with values between 2 and 3 are considered weak, and systems with a short-circuit ratio value exceeding 3 are classified as strong.
If Figure 1 is a DC grid-connected system, it can be equivalent to the equivalent circuit shown in Figure 2.
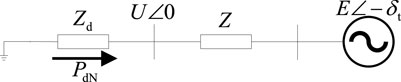
Figure 2. Equivalent circuit of DC grid-connected system.
In Figure 2,
Ignore internal control strategies of the device, the rated DC power can be expressed as:
Where,
In Eq. 4:
Where,
When the system is critically stable, the two equivalent impedance modes in Figure 2 are equal (Liu, 2000):
Assume that when the
Equivalent to:
In Eq. 8, the negative equivalent resistance solution corresponds to the DC power feeding scenario, while the positive equivalent resistance solution corresponds to the load scenario. CSCR can be obtained:
It can be seen that the critical short-circuit ratio is equal to 2 only under certain hypothetical conditions; Similarly, based on different assumptions, the short-circuit ratio threshold can be obtained, as shown in Table 2.
It can be seen from Table 1 that the critical short-circuit ratio is affected by the equivalent impedance and Thevenin equivalent impedance of the AC system. Under different impedance, the critical short-circuit ratio is different. Therefore, the critical short-circuit ratio of 2 is not suitable as the critical value for dividing the strength of any device grid-connected system, and it only applies to specific assumptions. This also reflects the limitations of using short-circuit ratio index to divide the power grid voltage support strength. The critical short-circuit ratio of 2 can only be used to analyze whether the system is stable and cannot determine the strength of the system.
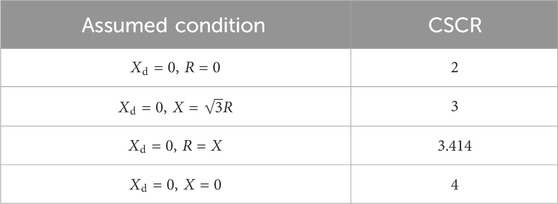
Table 1. Table I CSCR under different assumptions.
3 Complex short-circuit ratio index
The analysis in the second section reveals that a critical short-circuit ratio of 2 is well-suited for evaluating the voltage support strength of DC grid systems. However, for grid-connected systems incorporating reactive compensation devices and integrating modern renewable energy sources, the conventional short-circuit ratio index proves inadequate for accurately quantifying the voltage support strength of these grids. To address this limitation and provide a more comprehensive assessment of voltage support across different grid-connected systems, this chapter introduces the complex short-circuit ratio index. This index takes into account the impedance angle information of both the equivalent impedance angle of the grid-connected devices and the Thevenin equivalent impedance angle of the AC system, thereby offering a more nuanced approach to evaluating voltage support strength.
3.1 Calculation of complex short-circuit ratio index
The single-device grid-connected system depicted in Figure 1 can be effectively represented by the equivalent circuit illustrated in Figure 3.
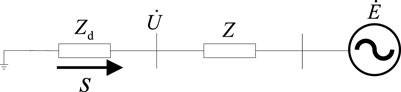
Figure 3. Equivalent circuit of single device grid-connected system.
For the grid-connected system illustrated in Figure 3, it expands beyond the scope of a singular DC grid connection scenario. As a result, the power injected at the grid connection point is represented in complex power terms. In order to accurately quantify the voltage support strength of the AC grid when integrating diverse devices, the ratio between the short-circuit complex power of the AC system and the injected complex power of the device is introduced as the complex short-circuit ratio index for grid-connected systems.
Where,
The complex short-circuit ratio index shares a similar form of expression with the short-circuit ratio index. However, as the complex short-circuit ratio index represents the ratio of two complex powers, it evolves beyond being a one-dimensional variable. It transforms into a two-dimensional variable capable of considering both phase angle and magnitude concurrently. Through this computational approach, the complex short-circuit ratio index is liberated from the constraints that limit the traditional short-circuit ratio index to the singular scenario of DC feed-in to the grid.
3.2 Calculation of
For the grid-connected system shown in Figure 3, assuming that the rated voltage of the AC bus is equal to the equivalent potential of the AC system. Assuming a three-phase fault occurs at the grid connection point, the short-circuit complex power (short-circuit capacity) of the system can be obtained as follows:
The system injection power can be expressed as:
Substituting Eqs 11, 12 into Eq. 10, the complex short-circuit ratio index at the junction can be obtained as follows:
From Formula 13, it can be seen that only the calculation of Z and X is needed to compute the complex short-circuit ratio index. The variables required for calculating Z and X are also needed when calculating the short-circuit ratio index, so there is no need to introduce new variables, and their computation speed and memory consumption are the same as that of the short-circuit ratio index.
Assuming that:
Where,
Suppose that:
It can be seen from Eq. 15 that the complex short-circuit ratio index is a two-dimensional index, which contains two kinds of information, one is amplitude information and the other is phase Angle information. For diverse devices grid-connected scenarios, different complex short-circuit ratio angles can be obtained, and then different complex short-circuit ratio index modulus can be calculated.
4 Threshold value of
The threshold value of the complex short-circuit ratio is utilized to quantitatively assess the stability of the device interconnection system. System stability is achieved only when the system’s complex short-circuit ratio index surpasses its threshold value. This chapter establishes the threshold value of the complex short-circuit ratio index through derivation.
4.1 Calculation of threshold value of the short-circuit ratio
Combining Eqs 15, 16, the following can be obtained.
When the system is critical and stable, the equivalent impedance of the device is equal to the impedance mode of the Thevenin equivalent impedance of the AC system, that is:
Under the condition of Eq. 18, it can be obtained that:
According to Eq. 19, the threshold value of system complex short-circuit ratio can be obtained as follows.
Where,
Eq. 20 demonstrates a strong correlation between the threshold value of the complex short-circuit ratio index and its angle. Since the equivalent impedances of the device and the impedance angle of the AC system’s Thevenin equivalent are not constant, the angle of the complex short-circuit ratio index is a dynamic quantity. Consequently, the numerical value of the threshold value for the complex short-circuit ratio index also fluctuates. By computing different angles of the complex short-circuit ratio within the context of static voltage stability, it becomes possible to derive the threshold value of the complex short-circuit ratio index. This approach facilitates a quantitative evaluation of the power grid’s voltage support strength.
4.2 Threshold value analysis of the complex short circuit ratio
Based on Eq. 20, assuming that the angle values of the complex short-circuit ratio fall within the range of (−π, π), a distribution map depicting the threshold values of the complex short-circuit ratio in the complex plane can be generated for a single-device interconnected system. The critical complex short-circuit ratio map for such a system is illustrated in Figure 4.
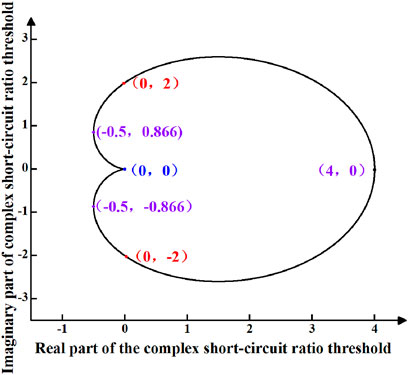
Figure 4. Threshold value distribution of complex short circuit ratio for single device grid-connected system.
From Figure 4, it can be observed that the threshold value of the complex short-circuit ratio form a closed shape on the complex plane, rather than a fixed value. Similar to the short-circuit ratio index, a system can only be classified as strong when its complex short-circuit ratio index exceeds its critical complex short-circuit ratio. Figure 4 delineates the boundaries of the threshold value of the complex short-circuit ratio in the complex plane. A system can be deemed strong only when the numerical value of the complex short-circuit ratio index lies outside the boundary of the threshold value. Additionally, Eq. 20 facilitates the plotting of the magnitude diagram of the threshold value of the complex short-circuit ratio, as illustrated in Figure 5.

Figure 5. The amplitude of the threshold value of the complex short-circuit ratio.
From Figure 5, it is evident that the range of value for the complex short-circuit ratio threshold falls within the interval of 0–4.
The critical value of short-circuit ratio was also derived in references (Yu and Sun, 2022; Yamada et al., 2023). These two papers, similar to this paper, derived the critical value by considering the external characteristics of the device and performed a Thevenin equivalent for the AC system. While the two references approached the device side from a power perspective, this paper took an impedance perspective. Nevertheless, the critical value derived in this paper align numerically with those derived in the two references.
The expression of critical short-circuit ratio given by reference (Yu and Sun, 2022) can be divided into two cases:
When the Thevenin impedance ratio of the AC system approaches 0:
When the Thevenin impedance ratio of the AC system approaches infinity:
Where,
The expression of critical short-circuit ratio given in reference (Yamada et al., 2023) is as follows:
Where,
The CSCR calculated in this paper is found to be numerically consistent with the findings reported in references (Yu and Sun, 2022; Yamada et al., 2023). This validation serves to verify the accuracy of the conclusions drawn in this paper regarding the calculation of the CSCR. In comparison to references (Yu and Sun, 2022; Yamada et al., 2023), which derive the critical values based on assumed input power, this paper takes a different approach by deriving the critical values based on the equivalent impedance angle and Thevenin equivalent impedance angle of the AC system. In contrast to references (Yu and Sun, 2022; Yamada et al., 2023), this paper provides a detailed explanation of the CSCR for different connected equipment and presents a range of values for the CSCR. This analysis allows for a more precise assessment of the voltage support strength of the power grid, presenting a refined study of the CSCR.
In reference (Xu, 2019),
Where,
From Eq. 24, it is evident that the square of the voltage stiffness index represents the ratio between the short-circuit ratio index and the operational short-circuit ratio index. This elucidates the correlation between the short-circuit ratio index and the practical short-circuit ratio during operation.
Several typical points of complex short-circuit ratio thresholds are marked in Figure 4 and Figure 5, which are analyzed as follows:
(1) Point (4, 0) in Figure 4 corresponds to point (0°, 4) in Figure 5. At this juncture, the complex short-circuit ratio threshold is 4, with the angle of the complex short-circuit ratio index being 0°. This implies that the condition is met when the equivalent impedance of the device and the Thevenin impedance of the system share the same phase angle.
(2) Point (0, ±2) in Figure 4 corresponds to point (±90°, 2) in Figure 5. At this juncture, the complex short-circuit ratio threshold is 2. The complex short-circuit ratio index angle can take on two values of ±90°, leading to the existence of the following two special cases:
1) The equivalent impedance of the device is a pure resistance (which can be positive or negative), while the system’s Thevenin impedance is purely reactive. A negative resistance can be understood as the scenario commonly assumed in conventional LCC-DC analysis, whereas a positive resistance corresponds to the typical assumption made in load analysis.
2) The equivalent impedance of the device is a pure reactance (which can be positive or negative), while the system’s Thevenin impedance is purely resistive. A negative reactance can be understood as the scenario commonly assumed in parallel capacitor or SVC analysis, whereas a positive reactance corresponds to the typical assumption made in parallel reactance compensation.
Assuming that the Thevenin equivalent impedance angle of the AC system is 70° and the equivalent impedance angle of the device is −20° (indicating some reactive compensation), the threshold value is 2. If reactive compensation on the device side is increased at this point, with the assumed equivalent impedance angle becoming −50°, the critical complex short-circuit ratio will be less than 2. This scenario can be likened to the integration of new energy sources through VSC grid connection.
(3) Point (−0.5, ±0.866) in Figure 4 corresponds to point (±120°, 1) in Figure 5. At this juncture, the threshold value of the complex short-circuit ratio is 1, with an angle index of 120°. This criterion is met when there is a 120° difference between the angles of the system’s Thevenin equivalent impedance and the equivalent impedance of the device.
(4) Point (4, 0) in Figure 4 corresponds to point (±180°, 0) in Figure 5. At this juncture, the threshold value of the complex short-circuit ratio is 0, with two scenarios for the angle index of ±180°. In this unique case, where only reactance is considered for both the device’s equivalent impedance and the system’s Thevenin equivalent impedance, one exhibiting positive reactance while the other negative reactance, it signifies an extreme scenario within the power grid.
In the actual power grid, the Thevenin equivalent impedance of the system is R ≥ 0 and X ≥ 0, so it is more reasonable to set the Thevenin equivalent impedance Angle of the AC system at (0, 90°).
Assuming Condition 1: In scenarios involving conventional DC or new energy grid integration on the device side, when the device injects positive active power into the system, the angle of the device’s equivalent impedance ranges from (−180°, −90°) to (90°, 180°). Consequently, the angle range for the complex short-circuit ratio is (−180°, 0) and (90°, 180°). Following Eq. 20, one can generate the magnitude plot of the threshold value of the complex short-circuit ratio as illustrated in Figure 6.
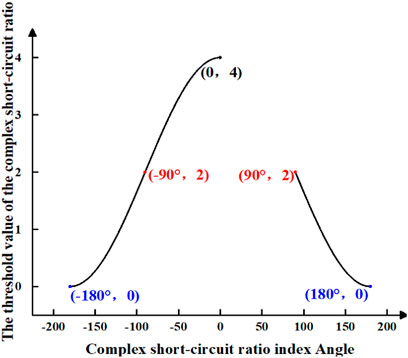
Figure 6. The threshold value amplitude of complex short circuit ratio is assumed under condition 1.
Assuming Condition 2: When the device injects positive reactive power into the system, such as in the case of phase reversal failure during the operation of the LCC, there will be significant changes in the reactive power consumption by the LCC (Yin and Li, 2021). It will cease to consume excess reactive power and instead feed the surplus reactive power into the AC system. At this juncture, the impedance angle of the device ranges from (−180°, −90°), allowing for the calculation of the angle of the complex short-circuit ratio within the ranges of (90°, 180°) and (−180°, −90°). Subsequently, the threshold value of the complex short-circuit ratio becomes (0, 2), leading to the generation of the magnitude plot illustrating the threshold value of the complex short-circuit ratio, as depicted in Figure 7A.
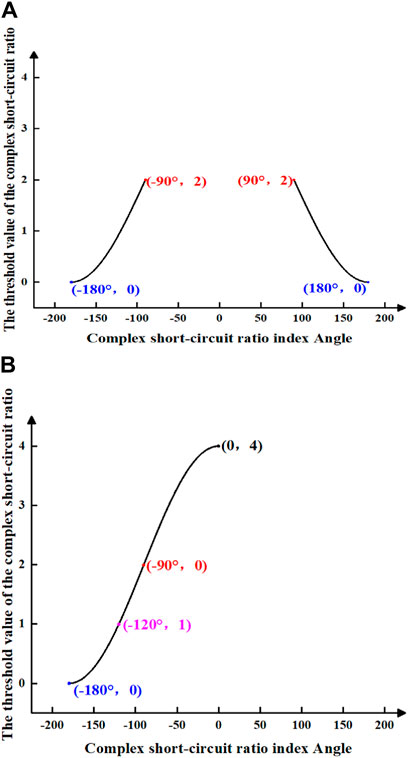
Figure 7. The threshold value amplitude of complex short circuit ratio is assumed under condition 2. (A) shows the threshold value amplitude of the complex short-circuit ratio when the index Angle of the complex short-circuit ratio is from −180° to −90° and when the index Angle of complex short-circuit ratio is from 90° to 180°. (B) shows the threshold value amplitude of the complex short-circuit ratio when the index Angle of the complex short-circuit ratio is from −180° to 0°.
When the device injects negative reactive power into the system, thereby absorbing excess reactive power from the system. For example, a generator can decrease excitation current to operate at a leading power factor, thereby absorbing excess reactive power from the system (He and Wen, 2016). At this juncture, the impedance angle of the device ranges from (90°, 180°), facilitating the computation of the angle of the complex short-circuit ratio as (−180°, 0). The threshold value of the complex short-circuit ratio at this stage is (0, 4), leading to the graphical representation of the threshold value of the complex short-circuit ratio, as illustrated in Figure 7B.
Figures 7A,B both share a common element of (−90°, 0), which is associated with the magnitude of the equivalent impedance angle under the assumed conditions and the impedance angle of the equivalent device.
Assumption 3. In the scenario where the device operates under load conditions and injects negative active power into the system, the impedance angle of the equivalent device ranges from −90° to 90°. Consequently, the complex short-circuit ratio angle falls within the range of −90°–180°, and a graphical representation of the threshold value of the complex short-circuit ratio can be constructed using Eq. 20 as depicted in Figure 8.
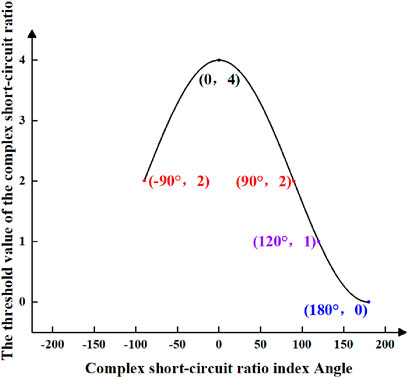
Figure 8. The threshold value amplitude of complex short circuit ratio is assumed under condition 3.
Assumption 4. When the device introduces negative reactive power into the system, the impedance angle of the device spans from 0° to 90°, resulting in a complex short-circuit ratio angle of −90°–90°. In this case, the threshold value of the complex short-circuit ratio ranges from 2 to 4, leading to the magnitude plot shown in Figure 9A. On the other hand, if the device injects positive reactive power, the impedance angle of the device ranges from 0 to −90°, yielding a complex short-circuit ratio angle of 0°–180°. The corresponding The corresponding the threshold value of the complex short-circuit ratio is between 0 and 4 is between 0 and 4, resulting in the magnitude plot shown in Figure 9B.
Both Figures 9A,B exhibit a common element of (0, 90°), which is related to the magnitude of the Thevenin equivalent impedance angle and the device equivalent impedance angle under the assumed conditions.
This section presents the derivation of the threshold value of the complex short-circuit ratio in diverse scenarios, taking into account the complex short-circuit ratio angle. As a result, the critical value of the complex short-circuit ratio are not simply specific values under certain assumed conditions, as is the case with the short-circuit ratio index. Consequently, the use of the complex short-circuit ratio index to analyze voltage support issues in power grids is no longer confined to the traditional scenario of DC injection into an AC grid, as with the short-circuit ratio index.
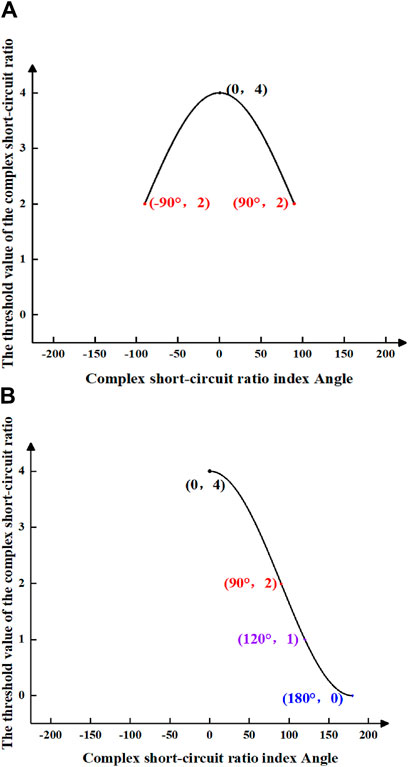
Figure 9. The threshold value amplitude of complex short circuit ratio is assumed under condition 4. (A) shows the threshold value amplitude of the complex short-circuit ratio when the index Angle of the complex short-circuit ratio is from −90° to 90°. (B) shows the threshold value amplitude of the complex short-circuit ratio when the index Angle of the complex short-circuit ratio is from 0° to 180°.
5 Example analysis
The Matlab model was employed to calculate the system’s maximum power transmission using the continuous load flow method. The equivalent impedance model of the AC system, which considers different reactive power injections, was devised, accounting for both reactance and impedance. Through simulating a single-feed system when a three-phase fault occurs at the grid connection point, the correlation between the threshold value of the complex short-circuit ratio and the critical short-circuit ratio is validated.
Table 2 presents the equivalent impedance of the AC system for the single-device grid system depicted in Figure 3. Furthermore, Figure 10 demonstrates the P-V curve of the single-device grid system under different reactive power injections.

Table 2. Parameters of the single device grid-connected system.
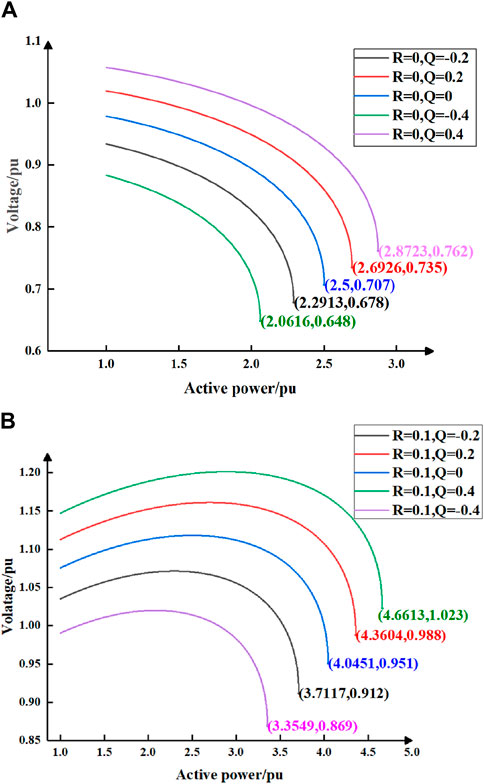
Figure 10. P-V curve of single device grid-connected system. (A) shows the P-V curve of the single device grid-connected system when R = 0. (B) shows the P-V curve of the single device grid-connected system when R = 0.1.
Based on Figure 10, the critical short-circuit ratios for the single-device grid system depicted in Figure 3 under different reactive power injections can be computed and are presented in detail in Table 3.
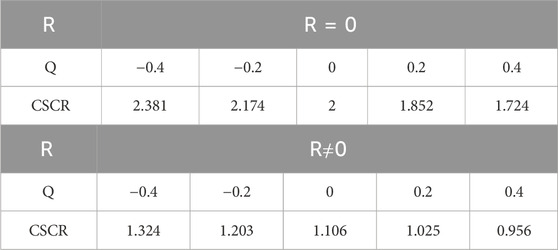
Table 3. CSCR of single device grid-connected system.
By calculating the angle of the complex short-circuit ratio index and combining it with Eq. 20, we can obtain the threshold value of the complex short-circuit ratio for the single-feed-in system depicted in Figure 3 under different reactive power injections, as presented in Table 4.
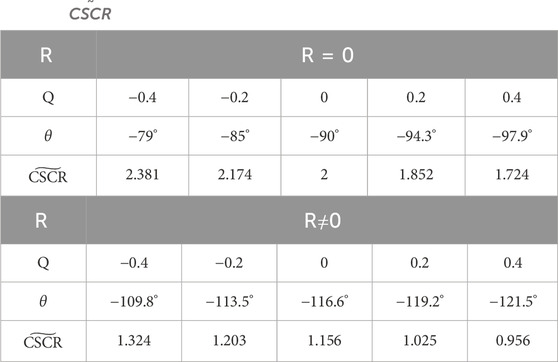
Table 4.
For grid-connected systems with varying reactive power injections, their P-V curves exhibit differences, resulting in distinct critical stability points and, consequently, varying critical short-circuit ratio index. The angles of the complex short-circuit ratio index, vary under different reactive power injections, leading to unique numerical values for the calculated the threshold value of the complex short-circuit ratio. By integrating data from Tables 3, 4, it becomes apparent that the threshold value of the complex short-circuit ratio in Table 4 correspond to the numerical values of the critical short-circuit ratio in Table 3. This correspondence illustrates that the complex short-circuit ratio index can effectively quantify and evaluate the voltage support strength of the power grid in a systematic manner.
Analysis of Table 4 reveals that when both active and reactive powers are injected positively, the angle of the complex short-circuit ratio falls exactly within the range of Figure 7A. Conversely, when injecting positive active power alongside negative reactive power, the angle of the complex short-circuit ratio falls within the range shown in Figure 7B.
From Tables 3, 4, it can be observed that the threshold value of the complex short-circuit ratio equals 2 only when active power is injected at the equipment side and the system side considers only reactance. Additionally, these tables highlight a considerable disparity in the threshold value of the complex short-circuit ratio when factoring in the influence of resistance compared to disregarding it at the same level of reactive power injection. Therefore, when quantitatively assessing voltage support strength, the influence of resistance cannot be ignored.
6 Conclusion
This paper mainly conducts relevant research on the influencing factors of the critical short-circuit ratio, the construction method of the complex short-circuit ratio index, and the calculation analysis method of the threshold value of the complex short-circuit ratio under the static voltage stability. The following conclusions can be drawn:
(1) Through the derivation of the critical short-circuit ratio, it can be proved that the threshold value of 2 is obtained under specific assumptions, and can only be applied to the traditional DC grid-connected scenario.
(2) The proposed the complex short-circuit ratio index integrates considerations both the magnitude and phase angle of the equivalent impedance of the device and the Thevenin equivalent impedance of the AC system. This makes the complex short-circuit ratio index a two-dimensional metric, facilitating a quantitative assessment of voltage support strength in the grid-connected scenario of diverse devices.
(3) By considering the angle of the complex short-circuit ratio index, this paper establishes a linkage between the device side and the AC power grid side of the grid-connected system. Leveraging the criteria of static voltage stability, the paper derives the threshold value of the complex short-circuit ratio. Notably, variations in the threshold value of the complex short-circuit ratio across diverse devices grid-connected configurations are evident from the analysis.
Data availability statement
The original contributions presented in the study are included in the article/Supplementary Material, further inquiries can be directed to the corresponding author.
Author contributions
PL: Writing–original draft, Writing–review and editing. JZ: Conceptualization, Formal analysis, Methodology, Resources, Writing–original draft, Writing–review and editing.
Funding
The author(s) declare that no financial support was received for the research, authorship, and/or publication of this article.
Conflict of interest
The author declares that the research was conducted in the absence of any commercial or financial relationships that could be construed as a potential conflict of interest.
Publisher’s note
All claims expressed in this article are solely those of the authors and do not necessarily represent those of their affiliated organizations, or those of the publisher, the editors and the reviewers. Any product that may be evaluated in this article, or claim that may be made by its manufacturer, is not guaranteed or endorsed by the publisher.
Abbreviations
SCR, Short Circuit Ratio; CSCR, Critical Short Circuit Ratio;
References
Chen, G., Li, M., Xu, T., Zhang, J., and Wang, C. (2017). Practice and challenge of Chinese power grid supporting the development of renewable energy. Power Grid Technol. 41 (10), 3095–3103. doi:10.13335/j.1000-3673.pst.2017.1780
He, Y., and Wen, Z. (2016). Power system analysis. Wuhan: Huazhong University of Science and Technology Press.
Huang, Q., Cao, S., Wu, Y., Lin, X., Wei, F., Yang, D., et al. (2023). New multi-feed short-circuit ratio index taking into account new energy amplitude-phase characteristics. Proc. CSEE. Available at: http://kns.cnki.net/kcms/detail/11.2107.TM.20230711.0838.002.html.
IEEE Standards Board IEEE Std 1204-1997 (1997). IEEE guide for planning DC links terminating at AC locations having low short-circuit capacities. New York: IEEE.
Kang, Y., Lin, X., Zheng, Y., Quan, X., Hu, J., Yuan, X., et al. (2020). Static stability limit and static stability working area of new energy grid-connected converter single-machine infinite bus system. Proc. CSEE 40 (14), 4506–4515+4730. doi:10.13334/j.0258-8013.pcsee.190906
Kim, Y.-K., Lee, G. S., Kim, C. K., and Moon, S. I. (2022). An improved AC system strength measure for evaluation of power stability and temporary overvoltage in Hybrid multi-infeed HVDC systems. IEEE Trans. Power Deliv. 37 (1), 638–649. doi:10.1109/tpwrd.2021.3068153
Lin, W., Tang, Y., and Bu, G.-Q. (2008). Definition and application of Short-circuit ratio in multi-feed AC-DC system. Proc. CSEE 28 (31), 1–8. doi:10.13334/j.0258-8013.pcsee.2008.31.001
Liu, Z. (2000). Impedance analysis of heavy load node in voltage stability problem. Proc. CSEE 20 (4), 36–40. doi:10.13334/j.0258-8013.pcsee.2000.04.008
Sun, H., Xu, S., and Xu, T. (2021). Definition and index of Short-circuit ratio of new energy multi-station. Proc. CSEE 41 (02), 497–506. doi:10.13334/j.0258-8013.pcsee.202112
Sun, H., Lin, Y., and Zhao, B. (2023a). Quantitative Analysis Method of voltage support Strength for new energy grid-connected Systems based on steady-state voltage safety constraints after faults. Proc. CSEE 43 (09), 3322–3332. doi:10.13334/j.0258-8013.pcsee.220466
Sun, H., Yu, L., and Zhao, B. (2023b). Quantitative Analysis Method of voltage support Strength for new energy grid-connected Systems based on transient overvoltage constraints. Proc. CSEE 43 (11), 4207–4218. doi:10.13334/j.0258-8013.pcsee.220468
Wu, D., Milad, J., Malyscheff, A. M., Hong, M., and Jiang, J. N. (2018). Assessing impact of renewable energy integration on system strength using site-dependent short circuit ratio. IEEE Trans. Sustain. Energy 9 (3), 1072–1080. doi:10.1109/tste.2017.2764871
Xu, Z. (1997). Study on DC transmission Characteristics of weak AC System: transmission power of DC transmission. Power Grid Technol. 21 (1), 12–16. doi:10.13335/j.1000-3673.pst.1997.01.004
Xu, Z. (2019). Reasonable definition and calculation method of power grid strength under the background of new power system. High. Volt. Technol. 48 (10), 3805–3819. doi:10.13336/j.1003-6520.hve.20221327
Yamada, Y., Tsusaka, A., Nanahara, T., and Yukita, K. (2023). A study on short-circuit-ratio for an inverter-based resource with power-voltage curves. IEEE Trans. Power Syst., 1–10. doi:10.1109/tpwrs.2023.3347574
Yin, C., Li, F., and Zhou, S. (2019). Dc lock-in transient Overvoltage calculation method based on reactive Power Short-circuit Ratio. Automation Electr. Power Syst. 43 (10), 150–154. doi:10.7500/AEPS20181114006
Yin, C., and Li, F. (2021). Analytical expression on transient overvoltage peak value of converter bus caused by DC faults. IEEE Trans. Power Syst. 36 (3), 2741–2744. doi:10.1109/tpwrs.2021.3062218
Yu, L., and Sun, H. (2022). A critical system strength evaluation of a power system with high penetration of renewable energy generations. CSEE J. Power Energy Syst. 8 (3), 710–720. doi:10.17775/CSEEJPES.2021.03020
Keywords: power grid strength, short-circuit ratio index, critical short-circuit ratio, complex short-circuit ratio index, the threshold value of the complex short-circuit ratio
Citation: Lei P and Zhao J (2024) The analysis of the threshold value of the complex short-circuit ratio index and its significance in the context of static voltage stability. Front. Energy Res. 12:1413910. doi: 10.3389/fenrg.2024.1413910
Received: 08 April 2024; Accepted: 03 June 2024;
Published: 09 August 2024.
Edited by:
Yushuai Li, Aalborg University, DenmarkReviewed by:
Yibin Zhang, Eaton, United StatesBingyu Wang, North China Electric Power University, China
Copyright © 2024 Lei and Zhao. This is an open-access article distributed under the terms of the Creative Commons Attribution License (CC BY). The use, distribution or reproduction in other forums is permitted, provided the original author(s) and the copyright owner(s) are credited and that the original publication in this journal is cited, in accordance with accepted academic practice. No use, distribution or reproduction is permitted which does not comply with these terms.
*Correspondence: Pan Lei, cGFubGVpMTk5OTA1QDE2My5jb20=