 Xu Wen
 Quan Zhou
- Southwest Subsection of State Grid, Chengdu, China
Insufficient flexibility is a major barrier to the development of new power systems. Leveraging the resource allocation function of the electricity market is a promising way to enhance the flexibility of power systems and promote the consumption of renewables. The reasonable allocation of ancillary service costs plays a pivotal role in this function. Towards the target of “who causes, who shares,” various research related to cost allocation has been conducted. However, there is a lack of quantitative analysis of the impact of different cost allocation mechanisms on the market participants’ revenues. Whether various cost allocation mechanisms can alleviate the insufficient flexibility problem of power systems needs to be validated. With this in mind, taking operating reserve ancillary services as an example, a long-term market operation simulation model with energy-reserve joint clearing is established in this paper based on the time series production simulation. According to this, the revenues of market participants under different reserve cost allocation mechanisms are quantified. Besides, a self-dispatch model for the energy storage (ES) equipped by renewables is established, based on which the impact of ES on the revenues of renewables under different cost allocation mechanisms is analyzed. Case studies based on practical data from a provincial power grid in China demonstrate that with the well-designed reserve cost allocation mechanism, the revenues of flexible resources can be ensured. Meanwhile, renewables are incentivized to reduce their fluctuations and uncertainties by equipping the ES. Hence, the insufficient flexibility problem of power systems can be alleviated from both supply and requirements perspectives.
1 Introduction
In recent years, the large-scale integration of renewables has brought significant challenges to the safe and stable operation of power systems due to their inherent fluctuations and uncertainties. Regarding this, leveraging the resource allocation function of the electricity market plays a crucial role in enhancing the operational flexibility of power systems and promoting the consumption of renewables. The resource allocation function of the electricity market is twofold: it provides reasonable compensation to flexible resources that offer ancillary services, and thus, they are incentivized to provide ancillary services to handle the variability of renewables (Fang et al., 2019); and it reasonably allocates the ancillary services costs to market participants that cause the requirements for services, and thus, they are incentivized to reduce their variability. The aforementioned resource allocation function can alleviate the impact of renewables from both the supply and requirements of ancillary services (Chen et al., 2015; Ela and Hytowitz et al., 2019; Yu et al., 2019).
The reasonable allocation of ancillary service costs is the key part of the resource allocation function (Gazafroudi et al., 2015; Buchholz et al., 2019), which affects the revenues of flexible resources and the penalties for market participants that cause the requirements for services. This issue has drawn global attention. In industrial practice, China mainly allocates the ancillary service costs in proportion to the generated or consumed energy of market participants. This method is easy to implement. However, the variability of market participants cannot be considered (Prica and Ilic, 2006). Australia allocates the ancillary service costs according to the deviation responsibility, for instance, the frequency regulation costs are allocated based on the deviation between the planned and actual energy of market participants (AEMO et al., 2018). This method can reflect the variability of market participants to some extent. However, the providers of ancillary services need to undertake service costs, which affects their market revenues (Morales-Espana et al., 2016). California allocates the ancillary service costs in proportion to the declared ancillary service requirements of market participants (Yu et al., 2019). The actual variability of market participants cannot be considered. Regarding the drawbacks of the methods used in industrial practices, researchers have proposed various cost allocation methods to achieve that target of “who causes, who shares.” These methods include the method based on the Vickrey-Clarke-Groves (VCG) theory (Xiang et al., 2023), forecast accuracy (He et al., 2019), risk contribution theory (Liang et al., 2007), the Shapley value (Haring et al., 2014), and price components of ancillary services (Wang et al., 2020), etc. Among them, based on the contribution of renewables and load to the reserve requirement, reference Wang et al. (2020) derivates the reserve price component to achieve the natural allocation of reserve costs. If the contribution of renewables and load to the reserve requirement is accurate, this method can achieve the target of “who causes, who shares”. In the following part of this paper, this method will be regarded as the ideal cost allocation mechanism and compared with other traditional cost allocation mechanisms.
In summary, toward the target of “who causes, who shares,” various cost allocation methods have been proposed. Nevertheless, the impact of different cost allocation mechanisms on the market participants’ revenues has not been quantitatively analyzed. How could different cost allocation mechanisms alleviate the insufficient flexibility problem of power systems is not clear. The necessity of a reasonable cost allocation mechanism needs to be further validated.
With this in mind, taking the operating reserve as the research object, the market participants’ revenues under different cost allocation mechanisms are quantitatively analyzed in this paper based on the long-term market operation simulation. The effect of ensuring flexible resources’ revenues and incentivizing renewables to reduce their variability of different cost allocation mechanisms is explored, which can give references for the design of the cost allocation mechanism. In this paper, the market participants include renewables, load, and thermal power units. The energy storage devices mentioned in this paper are equipped with renewables. Hence, they belong to renewable entities. The contributions of this paper are listed as follows:
1) Based on the time series production simulation, a long-term market operation simulation model with energy-reserve joint clearing is established in this paper. In the established model, the contributions of renewables and load to the reserve requirement are described according to their historical forecast errors. A self-dispatch model for energy storage (ES) equipped by renewables is established. The forecast errors of renewables can be reduced by the equipped ES, and thus, their contributions to the reserve requirement can be reduced. According to the market clearing prices and different cost allocation mechanisms, the market participants’ revenue calculation model considering the equipped ES is constructed, which lays a foundation for analyzing how could different cost allocation mechanisms alleviate the insufficient flexibility problem of power systems.
2) Based on the practical data from a provincial power grid in China, a quantitative analysis of market participants’ revenues is conducted under different cost allocation mechanisms, variability of renewables, and capacities of the equipped ES. Case studies demonstrate that compared with the method based on energy generation/consumption used in Chinese industry, the method based on “who causes, who shares” can ensure the revenues of flexible resources better (revenues are improved by 3.34%). Besides, under the method based on “who causes, who shares,” the revenues of renewables can be greatly improved by equipping the ES (reflected in the 28.64% improvement in energy revenues and the 49.61% reduction of allocated reserve costs). While under the method based on energy generation/consumption, the allocated reserve costs of renewables will instead increase by 61.11% after the configuration of the ES, which affects the total revenues of renewables. Therefore, the reasonable cost allocation mechanism can alleviate the insufficient flexibility problem of power systems by ensuring the flexible resources’ revenues and incentivizing renewables to reduce their variability.
2 Long-term market operation simulation model with energy-reserve joint clearing
To quantitatively assess the revenues of market participants under various reserve cost allocation strategies, a simulation of the power spot market’s daily operations is required, utilizing extensive load and renewables data via time-series production simulation theory. This section outlines the energy-reserve market joint clearing model employed in this study, enabling the determination of market participants’ operational modes through model resolution. Subsequently, Section 3 will evaluate the impacts of different reserve cost allocation mechanisms on market participants’ revenues. The energy-reserve joint clearing model utilized in this study is detailed further below.
2.1 Energy-reserve joint market clearing model considering contributions of market participants to reserve requirement
2.1.1 Objective function
The market clearing model’s objective function aims to minimize the system’s operating costs:
When
2.1.2 Operating constraints
2.1.2.1 Line power flow constraints
2.1.2.2 Power balance constraints
2.1.2.3 Reserve constraints
The aggregated frequency regulation capacity across all units must satisfy the system’s overall frequency regulation requirements.
where the ratio πdi/vi is determined by the maximum ratio between the historical forecast errors of market members and their corresponding predicted power generation capacity/load demand (the system reserves capacity to address the maximum forecast error of market members). It is noted that the focus of this paper is not to accurately quantify the operating reserve requirement of the power system. Instead, this paper aims to quantitatively analyze the impact of different cost allocation mechanisms on the market participants’ revenues, thus, demonstrating the effectiveness of the cost allocation mechanism that obeys the principle of “who causes, who shares.” Therefore, the offset of prediction errors of renewables and load is ignored and the ratio πdi/vi is assumed to be accurate, based on which the reserve cost allocation that obeys the principle of “who causes, who shares” can be achieved. Besides, so far, there still lacks a cost allocation mechanism that can achieve the target of “who causes, who shares” considering the impact of conventional generators, renewables, and load. Therefore, to achieve a reasonable cost allocation that obeys the principle of “who causes, who shares” and simplify the analysis, this paper does not consider the impact of conventional generators on the reserve requirement. The reasonable cost allocation mechanism that considers conventional generators is worthy of future research but out of the scope of this paper.
Except for the constraints illustrated above, constraints related to the upper/lower output limits of thermal power units, the upward/downward ramping limits of thermal power units, and the operating status of the last period on day k being the same as the first period on day (k + 1) are common constraints for thermal power unit operation. Additionally, the constraints related to the curtailment of renewable energy units and load are also considered. Due to space limitations, these constraints are not illustrated in detail.
The market clearing model outlined in this section enables the daily determination of scheduling and operation plans for various market participants. This forms the basis for calculating subsequent earnings for market participants.
2.2 Self-dispatch model for energy storage equipped by renewables
An effective alternative cost allocation mechanism should incentivize renewable sources to reduce their forecast errors through the deployment of ES systems. This requires that the market revenues of renewable sources, post-storage deployment, exceed their pre-storage revenues, with a growth rate higher than that of renewable sources without storage deployment. To analyze whether different cost allocation mechanisms can motivate renewable sources to voluntarily deploy storage, this section develops a self-dispatch model for renewables with integrated storage. This model can reflect, through historical operation data of renewable sources, the extent to which proper storage operation planning can reduce the daily maximum forecast error. As discussed in Section 2.1, the reduction in the maximum forecast error reduces the reserve impact of renewable sources, thereby decreasing the overall system reserve requirements and total reserve costs.
2.2.1 Objective function
The objective function for the self-dispatch model of renewables with integrated ES, as developed in this study, aims to minimize the maximum prediction error across all operational periods for renewable sources as detailed in the Eqs 11, 12.
2.2.2 Operating constraints
In the self-dispatch model for renewables with integrated ES, the operational constraints of ES systems include the following:
(1) ES state mutually exclusive constraint
An ES unit can either be in a charging or discharging state at any given time, as detailed in Eq. 13.
(2) Charge/discharge power constraints for ES devices as detailed in the Eqs 14, 15.
(3) ES constraints
The energy levels within the storage system must remain within its permissible limits, as specified in Eq. 16:
The initial energy level for each day is set based on the final energy level from the preceding day, as outlined in Eq. 17.
The constraint governing changes in ES is detailed in Eq. 18.
2.2.3 Objective function linearization
The objective function depicted in Eq. 11 is non-linear, hindering the model’s solvability. To address this issue, the study linearizes the objective function by introducing an ancillary variable z, thereby transforming it into a linear form devoid of absolute values and the max function. Consequently, the objective function now aims to minimize the value of z, with two additional constraints, as specified in Eq. 19, incorporated into the model.
The constraints in Eq. 19 necessitate that the ancillary variable z must be at least as large as the absolute value of the prediction error for renewables in each historical period, ensuring
By implementing the self-dispatch model for renewables integrated with ES, renewables operators can optimally utilize ES systems. This optimization allows for the adjustment of discrepancies between actual and forecasted outputs through strategic charging or discharging of the storage system. Consequently, this reduces the maximum prediction error associated with renewable sources, diminishing their impact on system reserve requirements and enhancing their competitive position in the market. With ES in place, the reserve requirements attributed to the variance in renewables production decrease. As a result, the overall bidding cost of the energy unit is reduced, improving its likelihood of success in market clearing.
3 Total revenues calculation of market participants under different reserve cost allocation mechanisms
3.1 Energy revenues calculation of market participants
Regarding power revenue, the market clearing prices discussed here mainly consist of energy and start-stop prices. Thermal power units earn revenue from both energy and start-stop operations, while renewables sources (considered units with minimal start-stop costs) generate income similarly. On the other hand, the load incurs both energy and start-stop expenses. As explained in Section 2.1, the model for energy-reserve joint clearing introduces a binary variable to indicate the start-stop status of units, which introduces non-convexity into the model. To accurately formulate energy and start-stop prices, this study uses the approach outlined in the reference Wang et al. (2023), converting the original non-convex model into a convex one through the application of artificial constraints.
The clearing model delineated in Section 2.1 is designated as m1. Building upon the solution outcomes of m1, the price-assisted optimization model m2 is developed. In m2, the integer variable and
where:
In conclusion, Eqs 1–10, and Eqs 19–21 form the m2 pricing auxiliary optimization model within the framework of linear programming. The inclusion of Constraint (21) ensures that, even when the integer variable
The energy price for thermal power units is detailed in Eq. 22.
The start-stop price for thermal power units is detailed in Eq. 23.
The income from electricity for thermal power units is presented in Eq. 24.
For load d, the electricity price, comprising both energy and start-stop components, is indicated in Eq. 25.
The cost incurred by load d for electrical energy is depicted in Eq. 26.
Similarly, the electricity price for renewables units v, which includes the energy and start-stop components, is specified in Eq. 27.
The income from electricity for renewables units v is documented in Eq. 28.
3.2 Reserve revenues calculation of market participants under different reserve cost allocation mechanisms
The energy-reserve joint clearing model, as delineated in Section 2.1, quantifies the influence of renewables and load on reserve requirements. This study posits that this influence is precisely characterized and, on this premise, computes the reserve revenue for market participants across various reserve cost allocation mechanisms. Subsequently, it evaluates the efficacy of these mechanisms. It is noted that the focus of this paper is not to propose an ideal reserve cost allocation. This paper aims to demonstrate the necessity of reasonable cost allocation mechanisms that obey the principle of “who causes, who shares” by comparing market revenues under different cost allocation mechanisms.
3.2.1 Mechanism based on “who causes, who shares”
As outlined in Section 2.1, this study excludes the influence of thermal power unit outages on system reserve requirements. Consequently, under the “who cause, who share” allocation mechanism, thermal power units are exempt from reserve costs, while the revenue generated from providing reserve services is distributed between renewable sources and load entities. Thus, thermal power units accrue reserve revenue, whereas renewable sources and load entities incur the reserve costs.
As highlighted in the introduction, accurately characterizing the impact of renewables and load on requirements for reserve services enables the application of the method from reference (Wang et al., 2020) to fulfill the market allocation principle of “who cause, who share.” Building on the premise that the impact of renewables and load on reserve requirements, as described in Section 2.1, is precisely articulated, this study employs the approach detailed in reference (Wang et al., 2020) to calculate the reserve price components for thermal power units, as well as renewables sources and load. This approach facilitates the natural redirection of reserve costs via price signals, thereby achieving the “who cause, who share” objective. The pricing and earnings related to reserves for each market participant are presented below [the detailed derivation process is elaborated in reference (Wang et al., 2020)].
The reserve revenue for thermal power units is detailed in Eq. 29.
By integrating this with the electricity revenue, the total revenue for thermal power units is computed as presented in Eq. 30.
The reserve price components for renewables unit v are outlined in Eq. 31, encompassing both the upper and lower reserve price components.
The reserve costs attributed to renewables unit v are specified in Eq. 32, consisting of the reserve price components for renewables and their output power.
The overall revenue of renewables is determined by aggregating the electricity revenue and the reserve costs for renewables units, as indicated in Eq. 33.
The reserve price component for load d, detailed in Eq. 34, comprises both the upper and lower reserve price components.
The reserve cost incurred by load d, specified in Eq. 35, includes the reserve price component associated with renewables and the load requirements.
By holistically assessing the electrical energy cost and reserve cost for load d, the aggregate cost payable by the load is computed, as presented in Eq. 36.
3.2.2 Mechanisms based on the proportion of energy generation/consumption
The allocation method, predicated on the ratio of power generation to consumption, distributes the total reserve cost among market participants based on their respective shares of total power generation and consumption within the network. This approach is detailed in Eqs 37, 38, exemplified by the reserve cost allocation for day k, and represents a prevalent method within the Chinese industry.
Within this distribution mechanism, thermal power units, renewable sources, and loads are all required to contribute towards the reserve costs. Consequently, the aggregate revenue of thermal power units is derived from their electricity sales revenue, reserve revenue, and the reserve costs they incur, as illustrated in Eq. 39.
The total revenue calculations for renewables sources and loads, akin to those presented in Eqs 33, 36, respectively, will not be reiterated here.
3.2.3 Mechanism based on types of market participants
The apportionment method, which accounts for the type of market entity, initially allocates the total reserve cost among different types of market entities in predetermined proportions. Subsequently, it distributes the reserve cost to individual market participants based on their share of electricity generation/consumption. This approach is a prevalent method of cost distribution within the Chinese industry.
The total reserve cost allocated to various market entities by this method is detailed in Eq. 40.
In the Chinese industrial sector, the allocation ratio for thermal power units αd/v/g is set at 10%, while the ratios for renewable energy and load are both set at 45%.
Taking thermal power units as an example, the reserve cost allocated to thermal power units will be further allocated to each thermal power unit according to the ratio of power generation between thermal power units, as shown in Eq. 41. The apportionment of the reserve cost between the load subject and the renewables subject is similar to that of the thermal power unit, which will not be described here.
Under this apportionment mechanism, the total revenue of thermal power is similar to Eq. 39, and the total revenue of renewables and the total revenue of load are similar to Eqs 33, 36, which will not be repeated here.
3.3 Total revenues calculation of renewables with equipped energy storage
Section 3.1 determines the electricity revenue generated by renewable sources, while Section 3.2 assesses the reserve costs allocated to renewables under various distribution mechanisms. The overall revenue of renewables is derived from combining electricity revenue and reserve costs. Additionally, for renewables entities equipped with supporting ES systems, it is imperative to account for the investment and operational costs of these storage solutions to precisely evaluate the revenue implications for renewables entities following the implementation of ES under diverse cost allocation mechanisms.
The costs associated with ES discussed in this paper encompass investment costs, maintenance costs, and life loss costs, as detailed in references (Li and Xu et al., 2018; Ahmadi et al., 2018; Li et al., 2021). These costs are distributed across each moment and day within the sequential production simulation.
The life loss cost, allocated per period, is detailed in Eq. 42.
The parameter εes can be obtained by fitting the energy storage life cycle curve.
The investment cost allocated per period is outlined in Eq. 43.
The maintenance cost for each period of ES is detailed in Eq. 44.
Upon accounting for ES costs, the total revenue of renewables entities, inclusive of supporting ES, comprises electricity revenue, reserve costs, and ES costs. This is exemplified in Eq. 45, utilizing the “who cause, who share” principle for reserve cost allocation.
Since the energy storage is equipped with renewables, the costs of the energy storage are added to the costs of corresponding renewables.
4 Case studies
4.1 Case description
The operational data from a provincial power grid in China, spanning January 2020 to December 2020, serves as the basis of the load and renewables data utilized in case studies. Meanwhile, to improve the penetration of renewables, the renewables data are proportionally expanded to achieve a 30% penetration rate. In addition, the prediction errors of renewables and load are generated according to the assumption that the prediction errors follow a normal distribution with a mean of zero (Holttinen et al., 2008). By amalgamating the prediction error data with the practical data, the predicted renewables and load are obtained. The predicted data are used as input for the market clearing model, while the prediction error data are used to form the operating reserve requirement of the power system.
The IEEE 30-node system serves as the basis of the power system’s topology in case studies. In addition, two wind turbines are added in nodes 5 and 50, and two thermal power units are added in nodes 8 and 19. The practical renewables and load data are scaled to fit the parameters of the IEEE 30-node system. This paper focuses on the evaluation of market participants’ revenues under various reserve cost allocation mechanisms and explores the mechanisms’ effectiveness. For the sake of simplicity, this paper denotes the three cost allocation methods introduced in Section 3.2 as M1, M2, and M3, respectively. The scheduling interval used in the dispatch model introduced in Section 2 is 1 h. The operating parameters of the thermal power units in the modified IEEE 30-node system are detailed in Table 1.
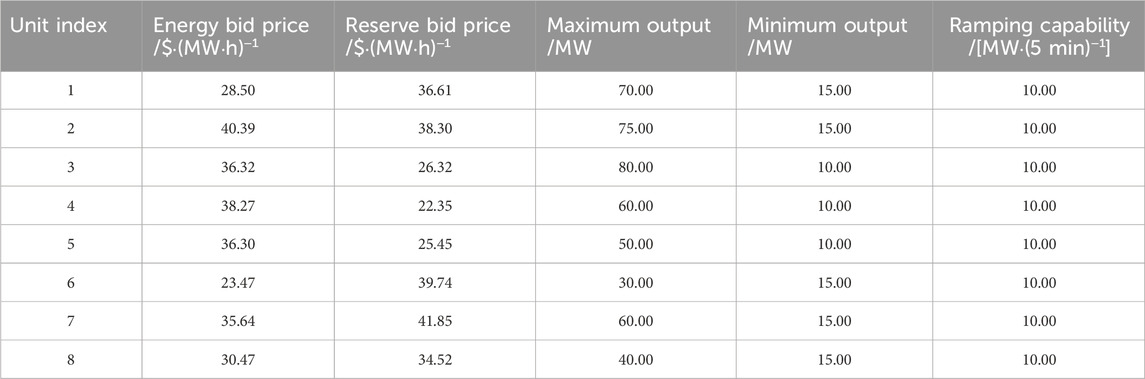
Table 1. Operation parameters of thermal power units.
4.2 Analysis of simulation results
4.2.1 Analysis of market participants’ revenues under different reserve cost allocation mechanisms
To effectively analyze the impact of the reserve cost allocation mechanism on market participants’ revenue, this section assumes that the two introduced typhoon motor groups, labeled W1 and W2, have identical installed capacities and forecasted outputs. However, the standard deviation of the forecast error for W1 is 30% of its actual output, while for W2, it is 20%. Neither wind turbine incorporates ES. Table 2 presents the revenue of each market entity under various standby cost allocation mechanisms, with “G” representing all thermal power units.
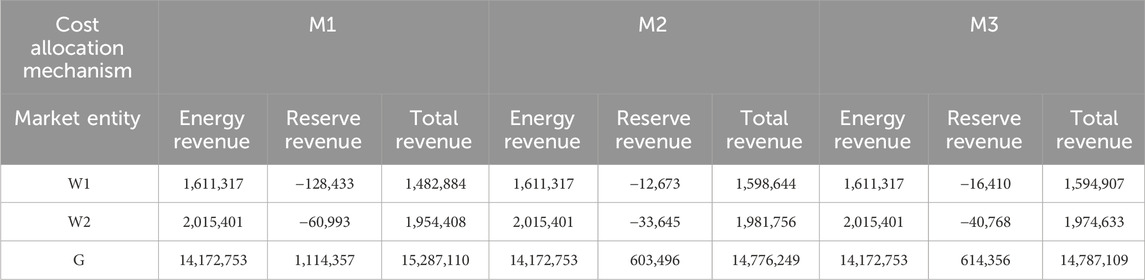
Table 2. Earnings of market players under different reserve cost allocation mechanisms.
Data from Table 2 indicates that, under the allocation mechanism M1, thermal power units enjoy the highest total revenue. This outcome is attributed to the fact that in mechanism M1, thermal power units do not induce additional reserve requirements (as the model does not consider shutdowns of thermal units), thus exempting them from bearing the costs associated with reserve capacity. Conversely, under mechanisms M2 and M3, thermal units incur higher reserve costs, diminishing their reserve revenue in comparison to M1, which in turn affects their overall profitability. Consequently, compared to mechanisms M2 and M3, thermal units’ total revenue under M1 increased by 3.46% and 3.38%, respectively. Therefore, mechanism M1 more effectively ensures the profitability of thermal power units, encouraging them to offer reserve services. In contrast, under mechanisms M2 and M3, despite providing reserve services, the associated costs dampen their enthusiasm for offering ancillary services.
A comparison of the energy revenue between wind power units reveals that W2’s energy revenue is 25.07% higher than that of W1. This is because W2 exhibits less variability, leading to lower system reserve requirements per unit of output (i.e., a lesser impact on reserve requirements), thereby reducing the operational costs associated with its output. Hence, compared to W1, which has more significant fluctuations, the market prefers to accommodate W2, as evidenced by its substantially higher accepted bid volume (an increase of 66.21%, as shown in Figure 1), ultimately resulting in higher energy revenue for W2.
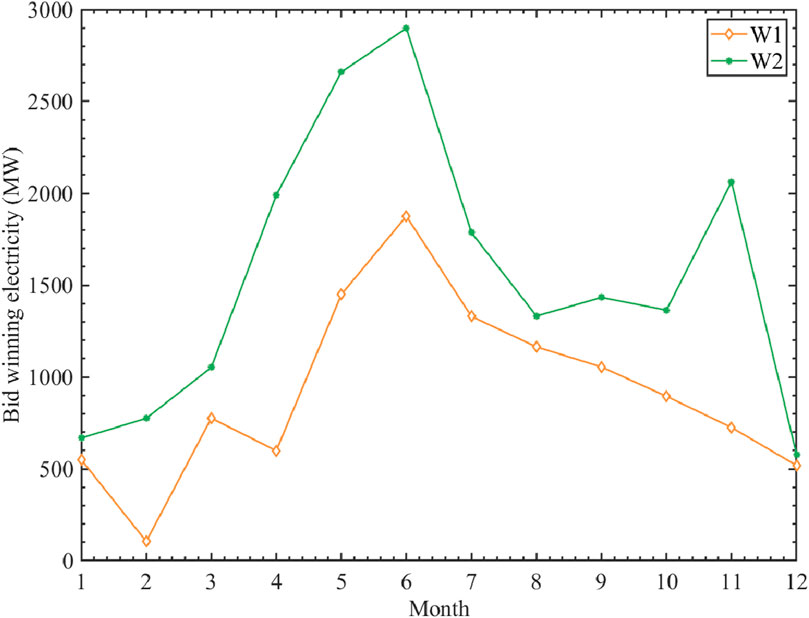
Figure 1. Comparison of scalars in fans with different bearing coefficients.
An analysis of the reserve costs associated with wind turbines reveals that under the M1 allocation mechanism, W2 incurs a lower reserve cost, constituting only 47.44% of W1’s reserve cost, attributed to its minimal impact on reserve requirements. Conversely, traditional cost allocation mechanisms M2 and M3 allocate reserve costs based on bid quantities, resulting in W2 incurring higher reserve costs, 165.45% and 148.43% greater than W1, respectively. Besides, under traditional cost allocation mechanisms M2 and M3, W2 with fewer uncertainties undertakes more reserve costs than that allocated to W1. Hence, these mechanisms do not obey the principle of “who causes, who shares” and are regarded as unfair (Gazafroudi et al., 2017; Xiang et al., 2023). By contrast, the M1 mechanism is more favorable for renewable sources with smaller fluctuations and uncertainties, as it imposes lower reserve costs on them, thereby incentivizing the reduction of their fluctuations and uncertainties characteristics.
Regarding the total revenue of wind turbines, under allocation mechanism M1, W2 achieves not only a higher energy revenue than W1 but also incurs a lower reserve cost, resulting in a total revenue increase of 31.79% compared to W1. In contrast, under mechanisms M2 and M3, the elevated reserve costs borne by W2 lead to a relative decrease in its total revenue increase to only 23.96% and 23.81%, respectively, when compared to W1. Analysis of the total revenue across both turbines under all three mechanisms reveals that W1 and W2 secure higher revenues under M2 and M3. This outcome is attributable to the distribution of reserve costs among thermal power units in M2 and M3, thereby reducing the wind turbines’ reserve costs and enhancing their total revenue.
In conclusion, the M1 allocation mechanism is more effective in ensuring the revenue stability of power supply regulation while also enabling renewable sources with lower fluctuations and uncertainties to gain a competitive edge in the market (relative to the revenue increase of newer, high-fluctuation energy sources). This approach incentivizes renewable entities to minimize their fluctuations and uncertainties characteristics.
4.2.2 Incentive effect of different reserve cost allocation mechanisms on configuring energy storage by renewables
To further assess the validity of various reserve cost allocation mechanisms, this section will evaluate the impact of ES configurations with differing capacities and maximum charge/discharge rates in wind turbine W1. It will also examine the revenue variations of two wind turbines to understand the motivational effects of these mechanisms on the integration of ES into renewable sources. It is posited that both wind turbines, W1 and W2, have identical installed capacities, predicted outputs, and actual outputs, with the forecast error’s standard deviation being 20% of the actual output.
Table 3 illustrates the revenue shifts for new energy entities given an energy storage configuration of 30 MW charging/discharging power and 200 MWh capacity.
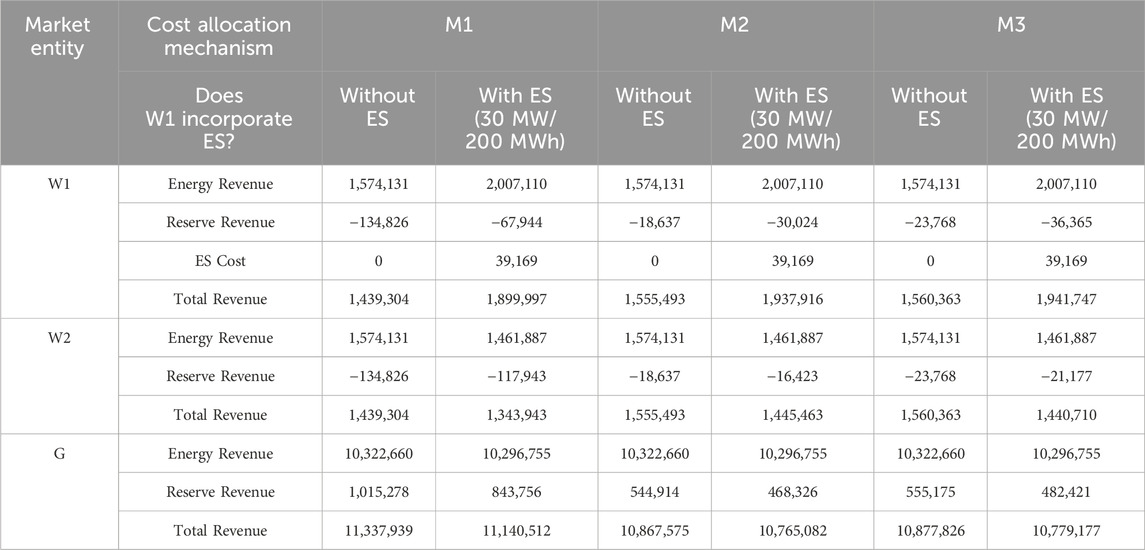
Table 3. Revenues of each market entity under different reserve cost allocation mechanisms after new ES is configured.
Table 3 demonstrates that equipping wind turbine W1 with ES significantly mitigates its fluctuations and uncertainties characteristics and enhances its market competitiveness, leading to an increase in its bid-winning capacity. Conversely, this results in a reduction in both the bid-winning capacity and capacity income of thermal power units. Furthermore, analyzing the revenue of thermal power units after integrating ES into W1 under the three allocation mechanisms reveals an increase in reserve revenue for the thermal motor group under M1 by 44.49% and 42.82% compared to M2 and M3, respectively, with total revenue seeing an uptick of 3.36% and 3.24%. This indicates that in scenarios involving renewables configurations with ES, M1 more effectively safeguards the market revenue of thermal power units compared to the conventional mechanisms M2 and M3.
An analysis of W1’s market revenue reveals that integrating ES leads to a significant improvement in energy revenue, with a 27.51% increase in bid power compared to configurations without ES. Regarding reserve costs, the M1 allocation mechanism sees a reduction in W1’s fluctuations and uncertainties characteristics due to ES installation, thereby decreasing its impact on reserve requirements and reducing its reserve costs by 49.61%. Despite the higher investment cost for ES, W1’s overall revenue post-integration increases by 32.01%. Conversely, under the M2 and M3 mechanisms, W1 incurs higher reserve costs (61.09% and 53.00% increases, respectively) due to enhanced bid-winning power, resulting in overall revenue growth rates of only 24.58% and 24.44%, respectively, which are lower than those observed under M1. In summary, the M1 mechanism more effectively promotes the enhancement of overall revenue for renewable sources equipped with ES by encouraging a reduction in fluctuations and uncertainties through strategic ES allocation, in comparison to M2 and M3.
Analysis of W2’s market revenue indicates that in scenarios lacking ES support, W1, and W2 exhibit identical market revenues across all three reserve cost allocation mechanisms due to their matching operating parameters. However, upon integrating ES, W1 enhances its market competitiveness and bid capacity, inversely affecting W2’s bid capacity. Consequently, W2’s energy revenue decreases by 9.46% in comparison to scenarios where W1 is not equipped with ES. Regarding reserve costs, under the M1 mechanism, W2 incurs higher reserve costs owing to its pronounced fluctuations and uncertain characteristics. Nevertheless, W1’s adoption of ES leads to a system-wide reduction in reserve costs, thereby diminishing W2’s reserve expenses by 12.52% relative to scenarios excluding ES. Ultimately, W2’s total revenue declines by 7.38%; under M2 and M3 mechanisms, due to its lesser bid capacity, W2’s reserve costs are lower than W1’s and are further reduced by 11.88% and 13.10%, respectively, compared to scenarios without W1’s ES, culminating in a total revenue reduction of 7.07% and 7.66%. This comparison underlines that traditional mechanisms M2 and M3, where W1 incurs higher reserve costs post-ES integration, may deter renewable sources from adopting ES solutions.
This study aims to examine the impact of the M1 allocation mechanism on incentivizing renewable sources to actively integrate ES. Figure 2 presents a comparative analysis of the overall revenue across various renewables units under M1, focusing on configurations of W1 with diverse ES capacities and maximum powers.
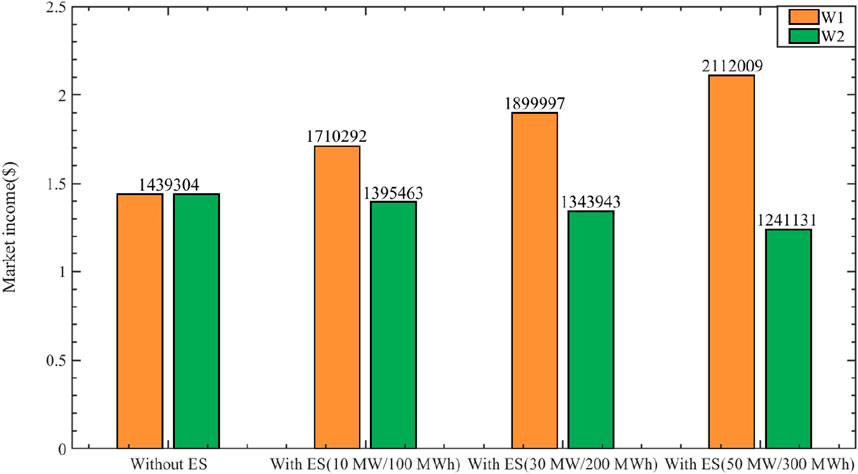
Figure 2. Overall revenues of renewables under the M1 allocation mechanism when supporting ES parameters change.
Figure 2 illustrates that, under the M1 allocation mechanism, as ES capacity and maximum power enhance, W1’s total revenue progressively increases. In contrast, W2’s total revenue exhibits a corresponding decline. Notably, when the ES parameters reach 50 MW/300 MWh, W1’s total revenue surges by 46.73% relative to scenarios lacking ES, whereas W2’s total revenue diminishes by 15.97%. This pattern underscores that, within the M1 framework, renewable sources equipped with storage markedly boost their revenue, whereas those without storage experience a revenue downturn. Hence, the M1 mechanism effectively motivates the strategic integration of ES among renewable sources.
In conclusion, the M1 allocation mechanism outperforms traditional mechanisms M2 and M3 by more effectively securing power supply revenue adjustments and incentivizing renewable sources to integrate ES. Consequently, there is a compelling need to develop a market-driven allocation mechanism aligned with the principle of “who causes, who shares.” This study presupposes that renewable sources and loads can precisely forecast the system’s reserve requirements, thereby achieving the cost allocation principle. However, this assumption may not hold in real-market operations, necessitating further investigation by market operators. Such research is crucial for enhancing the power system’s flexibility through a well-designed cost-allocation mechanism for auxiliary services.
5 Conclusion
This study addresses the challenge of enhancing power network flexibility, which is compromised by the high influx of renewable sources. We explore a viable reserve cost allocation mechanism to tackle this challenge. We develop a comprehensive simulation model that combines long-period market operations with energy-reserve joint clearing. This model encapsulates the impact of renewable source prediction errors on system reserve requirements. Furthermore, we formulate a self-dispatch model for the equipped ES to accurately reflect changes in prediction error post-storage implementation. By incorporating market clearing mechanisms, we establish a model for calculating the total revenue of market entities under various reserve cost allocation schemes. This sets the stage for an in-depth analysis of how different mechanisms can alleviate the system’s flexibility shortfall. Using real data from a provincial power grid in China, we conduct a comparative analysis of the revenues to market participants under diverse reserve cost allocation frameworks. This analysis helps to illustrate the potential of these mechanisms to enhance system flexibility. The key findings are as follows:
(1) In contrast to the traditional allocation mechanisms that are widely used in the Chinese industry, under the mechanism that obeys the principle of “who causes, who shares,” the regulating resources that do not cause the need for the reserve need not undertake reserve costs. As a result, the market revenues of regulating resources can be ensured.
(2) Besides, under the mechanism that obeys the principle of “who causes, who shares,” the reserve costs allocated to renewables can be greatly reduced by equipping ESs. As a result, their market revenues can be significantly improved (including the costs of ESs). By contrast, the market revenues of renewables without equipped ESs are decreased.
In summary, this research demonstrates that the “who causes, who shares” allocation mechanism not only effectively ensures and stabilizes the revenue of power suppliers but also motivates renewable entities to diminish their fluctuations and uncertainties traits through the adoption of ES. This approach holds significant potential for enhancing the power system’s flexibility and addressing its current limitations.
Data availability statement
The original contributions presented in the study are included in the article/Supplementary Material, further inquiries can be directed to the corresponding author.
Author contributions
XW: Formal Analysis, Methodology, Writing–original draft, Writing–review and editing. QZ: Writing–original draft. BL: Writing–original draft. YY: Writing–review and editing. RM: Writing–original draft. DF: Writing–review and editing.
Funding
The authors declare that financial support was received for the research, authorship, and/or publication of this article. This work is supported by the Science and Technology Project of the Southwest Subsection of State Grid. Project Name: Research on the Multi-dimensional Value Evaluation and Benefit Sharing Mechanism of Clean Energy in Southwest Power Grid toward the Target of “Carbon Peaking and Carbon Neutrality” (SGSW0000JYJS2310064).
Conflict of interest
Authors XW, QZ, BL, YY, RM, and DF were employed by Southwest Subsection of State Grid.
The authors declare that this study received funding from Southwest Subsection of State Grid. The funder had the following involvement in the study: Data Collection and Data Analysis.
Publisher’s note
All claims expressed in this article are solely those of the authors and do not necessarily represent those of their affiliated organizations, or those of the publisher, the editors and the reviewers. Any product that may be evaluated in this article, or claim that may be made by its manufacturer, is not guaranteed or endorsed by the publisher.
References
AEMO RegulationFCAS contribution factor procedure[EB/OL]. Available at: http://www.aemo.com.au/Stakeholder-Consultation/Consultations/Causer-Pays-Procedure-Consultation.
Ahmadi, A., Nezhad, A. E., and Hredzak, B. (2018). Security-constrained unit commitment in presence of lithium-ion battery storage units using information-gap decision theory. IEEE Trans. Ind. Inf. 15, 148–157. doi:10.1109/tii.2018.2812765
Buchholz, W., Dippl, L., and Eichenseer, M. (2019). Subsidizing renewables as part of taking leadership in international climate policy: the German Case. Energy Policy 129, 765–773. doi:10.1016/j.enpol.2019.02.044
Chen, Y., Leonard, R., Keyser, M., and Gardner, J. (2015). Development of performance-based two-part regulating reserve compensation on MISO energy and ancillary service market. IEEE Trans. Power Syst. 30 (1), 142–155. doi:10.1109/tpwrs.2014.2320519
Ela, E., and Hytowitz, R. B. (2019). Ancillary services in the United States: technical requirements, market Designs and price trends. Palo Alto,CA, USA: EPRI.
Fang, X., Hodge, B. M., Du, E. S., Kang, C., and Li, F. (2019). Introducing uncertainty components in locational marginal prices for pricing wind power and load uncertainties. IEEE Trans. Power Syst. 34 (3), 2013–2024. doi:10.1109/tpwrs.2018.2881131
Gazafroudi, A. S., Afshar, K., and Bigdeli, N. (2015). Assessing the operating reserves and costs with considering customer choice and wind power uncertainty in pool-based power market. Int. J. Elect. PowerEnergy Syst. 67, 202–215. doi:10.1016/j.ijepes.2014.11.007
Gazafroudi, A. S., Shafie-khah, M., Abedi, M., Hosseinian, S. H., Dehkordi, G. H. R., Goel, L., et al. (2017). A novel stochastic reserve cost allocation approach of electricity market agents in the restructured power systems. Electr. Power Syst. Res. 152, 223–236. doi:10.1016/j.epsr.2017.07.012
Haring, T., and Andersson, G. (2014). “Cost allocation in ancillary service markets,” in 2014 47th Hawaii international conference on system sciences, 06-09 January 2014, Waikoloa, HI, USA.
He, Y., Zhou, L., and Pang, Y., (2019). Design of frequency modulation auxiliary service cost allocation mechanism based on triggered liability under new power reform [J].Automation Electr. power Syst., 43(18): 88–94+144. doi:10.1109/ICGEA.2017.7925458
Holttinen, H., Milligan, M., Kirby, B., Acker, T., Neimane, V., and Molinski, T. (2008). Using standard deviation as a measure of increased operational reserve requirement for wind power. Wind Eng. 32 (4), 355–377. doi:10.1260/0309-524x.32.4.355
Li, Z., Wu, L., and Xu, Y. (2021). Risk-averse coordinated operation of a multi-energy microgrid considering voltage/var control and thermal flow: an adaptive stochastic approach. IEEE Trans. smart grid 2021 (12-5), 3914–3927. doi:10.1109/TSG.2021.3080312
Li, Z., and Xu, Y. (2018). Optimal coordinated energy dispatch of a multi-energy microgrid in grid-connected and islanded modes. Appl. Energy 210, 974–986. doi:10.1016/j.apenergy.2017.08.197
Liang, J. (2007). Improvement of CPS performance index and frequency control strategy of guangdong power grid. Guangdong Power Transm. Transformation Technol. 2007 (1), 12–15. doi:10.1109/POWERCON.2018.8601873
Morales-España, G., Baldick, R., García-González, J., and Ramos, A. (2016). Power-capacity and ramp-capability reserves for wind integration in power-basedUC. IEEETrans. Sustain. Energy 7 (2), 614–624. doi:10.1109/tste.2015.2498399
Prica, M., and Ilic, M. (2006). “Peak-load pricing based planning for distribution networks under change,” in Power Engineering Society General Meeting, 2006. IEEE. doi:10.1109/PES.2006.1709296
Wang, Y., Yang, Z., Yu, J., et al. (2020). Revisit the electricity price formulation: a formal definition, proofs, and examples. Energy 200, 117542.
Wang, Y., Yang, Z., Yu, J., and Liu, S. (2023). Pricing in non-convex electricity markets with flexible trade-off of pricing properties. Energy 274, 127382. doi:10.1016/j.energy.2023.127382
Xiang, M., Yang, Z., Yu, J., and Wang, G. (2023). Determination and cost allocation for regulation reserve with renewables: a data-driven assisted approach. IEEE Trans. Sustain. Energy. 14(2), 813–825. doi:10.1109/tste.2022.3226255
Yu, J., Liu, Y., Yang, J., et al. (2019). Analysis of development of California ancillary service market and its enlightenment to China’s power market. Power Sys. Technol. 43(008), 2711–2717. doi:10.13335/j.1000.3673.pst.2019.0254
Nomenclature
Keywords: cost allocation mechanisms, electricity market, market operation simulation, market revenue calculation, self-dispatch of energy storage (ES)
Citation: Wen X, Zhou Q, Luo B, Yang Y, Mao R and Fan D (2024) Impact of different reserve cost allocation mechanisms on market participants’ revenues: a quantitative analysis. Front. Energy Res. 12:1413297. doi: 10.3389/fenrg.2024.1413297
Received: 08 April 2024; Accepted: 01 July 2024;
Published: 06 September 2024.
Edited by:
Yushuai Li, Aalborg University, DenmarkReviewed by:
Jay Zarnikau, The University of Texas at Austin, United StatesYunting Yao, Nanjing Normal University, China
Copyright © 2024 Wen, Zhou, Luo, Yang, Mao and Fan. This is an open-access article distributed under the terms of the Creative Commons Attribution License (CC BY). The use, distribution or reproduction in other forums is permitted, provided the original author(s) and the copyright owner(s) are credited and that the original publication in this journal is cited, in accordance with accepted academic practice. No use, distribution or reproduction is permitted which does not comply with these terms.
*Correspondence: Xu Wen, MjUzNjY5MjEwMkBxcS5jb20=