- 1State Grid Liaoning Electric Power Co., Ltd. Skills Training Center, Jinzhou, China
- 2School of Electrical Engineering, Shenyang University of Technology, Shenyang, China
Under the guidance of energy-saving and emission reduction goals, a low-carbon economic operation method for integrated energy systems (IES) has been proposed. This strategy aims to enhance energy utilization efficiency, bolster equipment operational flexibility, and significantly cut down on carbon emissions from the IES. Firstly, a thorough exploration of the two-stage operational framework of Power-to-Gas (P2G) technology is conducted. Electrolyzers, methane reactors, and hydrogen fuel cells (HFCs) are introduced as replacements for traditional P2G equipment, with the objective of harnessing the multiple benefits of hydrogen energy. Secondly, a cogeneration and HFC operational strategy with adjustable heat-to-electricity ratio is introduced to further enhance the IES’s low-carbon and economic performance. Finally, a step-by-step carbon trading mechanism is introduced to effectively steer the IES towards carbon emission control.
1 Introduction
IES serves as a crucial platform for realizing energy diversification, optimizing energy structures, and enhancing energy utilization efficiency. Consequently, conducting optimal scheduling research on IES holds significant importance in enhancing the overall performance of energy systems and reducing operational costs. Integrating the stepped carbon trading mechanism with electric hydrogen production technology in optimal scheduling research for integrated energy systems not only facilitates the healthy development of the carbon market but also strongly supports the sustainable growth of the hydrogen energy industry. Recognizing its potential, scholars both domestically and internationally have embarked on related research efforts (Song et al., 2021).
In the study of optimizing the operation of integrated energy systems, scholars focus on maximizing economic efficiency. Yin et al. (2021) proposed a risk constrained stochastic scheduling model to effectively manage the uncertainty of renewable energy, promote stable system operation, and optimize costs. Wang et al. (2020) refined unit scheduling and reduced system operating costs through the moth flame optimization algorithm. Zhang et al. (2023) proposes a multi product optimization scheduling algorithm that considers the complementarity of hydrogen products, optimizing the scheduling of energy hub systems to achieve maximum profit. In the study of the optimal scheduling strategy for the integrated energy system of electricity and hydrogen production under the stepped carbon trading mechanism, this paper combines the stepped carbon trading mechanism to explore the optimal scheduling strategy for the integrated energy system of electricity and hydrogen production. The aim is to minimize carbon emissions and maximize economic benefits, providing new ideas for the sustainable development of the energy system.
At the same time, with the rapid development of renewable energy technology, hydrogen production from electricity, as a clean and efficient energy conversion method, is gradually becoming a research hotspot in the energy field (Yang et al., 2022). Electrochemical hydrogen production technology can use renewable energy or low-carbon electricity to produce hydrogen, providing a sustainable source of raw materials for the hydrogen energy industry, thereby promoting the wide application of hydrogen energy in transportation, industry and other fields (Zhou et al., 2022).
In the context of global climate change, reducing greenhouse gas emissions and promoting low-carbon economic development have become the consensus of all countries in the world. As an important means to promote the effective allocation of carbon emission rights and promote low-carbon development, the carbon trading mechanism has been widely promoted and applied globally in recent years (Zhou et al., 2019). The step-by-step carbon trading mechanism, as an innovative carbon trading model, not only helps to encourage enterprises to reduce emissions independently, but also guides the healthy development of the carbon market through differentiated pricing (Tan et al., 2018). Compared to traditional carbon trading, tiered carbon trading presents a more refined and dynamic management strategy. Traditional carbon trading is mainly based on fixed quota allocation and trading mechanisms, determining carbon prices through market supply and demand relationships. The tiered carbon trading introduces a multi-level carbon quota and pricing structure, allowing for the adoption of different carbon pricing or quota allocation strategies at different stages or targets of carbon reduction. This stepped design can better reflect the marginal cost and benefits of carbon reduction, motivate enterprises to achieve emission reduction goals in stages and steps, and promote sustainable economic development while ensuring environmental benefits.
In the realm of carbon trading mechanisms, the current research on optimizing integrated energy systems primarily centers on two key areas: the establishment and refinement of carbon trading models, as well as the practical application of carbon trading in diverse scenarios. Researchers strive to devise more rational and efficient carbon trading systems from various perspectives. Wang et al. (2022) introduces an IES model that incorporates carbon capture technology and utilizes carbon emission coefficients and a hierarchical carbon trading mechanism to precisely calculate trading costs. Lu et al. (2021) focuses on community-based integrated energy service systems, enhancing the carbon trading mechanism through a two-layer optimization model and introducing reward and punishment mechanisms for both supply and demand, along with user satisfaction considerations. Li et al. (2019) explores an IES model that specifically accounts for ladder carbon pricing, deeply analyzing the impact of supply and demand flexibility on the system, thereby supporting the application of carbon trading in energy systems. Additionally, Olsen et al. (2018) investigate the impact of carbon prices on power system emissions, establishing a three-stage optimal ladder carbon price model to inform low-carbon development decisions. Notably, step-by-step carbon trading, an innovative approach to encourage emission reductions, has garnered significant research attention. By establishing graduated carbon trading price structures, this approach effectively enhances emission reduction incentives, encouraging various stakeholders to actively engage in carbon emission reduction efforts.
In summary, most of the literature in the construction of carbon emissions model, its complexity is obviously insufficient, failed to fully reflect the core role of carbon trading market (Liu et al., 2021). In the process of exploring the use of P2G technology to promote wind power consumption, most studies have failed to fully consider the economic benefits contained in the two-stage operation process of P2G. Similarly, in the study of optimal operation of Combined Heat and Power (CHP), there is also a lack of sufficient attention to the potential advantages brought by the adjustable heat-to-electric ratio (Liu et al., 2015). Regrettably, there is a dearth of literature comprehensively exploring the significance of the synergistic effect among the graduated carbon trading mechanism, the intricate details of the two-stage P2G operation, and the CHP unit featuring adjustable heat-to-electricity ratio in IES scheduling (Liu et al., 2020). Given the anticipated diverse transformations and transitions in the future energy system, particularly the widespread adoption of low-carbon and clean technologies, these advancements do not occur in isolation but are interconnected and evolve in tandem. Consequently, a profound investigation into the influence of the concerted operation of these three components on IES optimal scheduling is paramount (Liu et al., 2022). In summary, existing literature lacks complexity in constructing carbon emission models and fails to fully reflect the core role of carbon trading markets. In the research on promoting wind power consumption through P2G technology, insufficient consideration has been given to the economic benefits of two-stage operation. Meanwhile, the potential advantage of adjustable thermoelectric ratio has been overlooked in the research of cogeneration. The importance of hydrogen production technology as a key bridge and its synergistic effect with carbon trading and cogeneration have been overlooked. Therefore, it is crucial to conduct in-depth research on the collaborative operation of these components in the optimal scheduling of IES, in order to promote the low-carbon transformation and sustainable development of the energy system.
The main innovations of this paper can be summarized as follows:
1.1 The combination of a tiered carbon trading mechanism and energy system scheduling
For the first time, the paper introduces a tiered carbon trading mechanism into the optimal scheduling strategy of an integrated energy system for electricity and hydrogen production. This innovation lies in incentivizing the energy system to reduce carbon emissions through a tiered carbon price, setting different carbon trading prices based on carbon emissions to more accurately reflect the social cost of carbon emissions, and incentivizing system operators to optimize energy use and reduce carbon emissions.
1.2 Optimization of the integrated energy system model for electric hydrogen production
The paper proposes a new optimization model for the integrated energy system of electric hydrogen production. This model not only considers the traditional energy supply and demand balance and economic benefits, but also incorporates factors such as carbon emission costs and the volatility of renewable energy. Through this model, it is possible to more accurately evaluate the impact of different scheduling strategies on the economic and environmental aspects of the system.
1.3 Innovative design of optimal scheduling strategy
The paper proposes a novel optimal scheduling strategy under a tiered carbon trading mechanism. This strategy not only considers economic factors such as energy purchase cost, carbon emission cost, and wind abandonment cost of the system, but also fully considers the operational safety and stability of the system. By optimizing algorithms, the optimal balance between economic and environmental aspects of the energy system has been achieved.
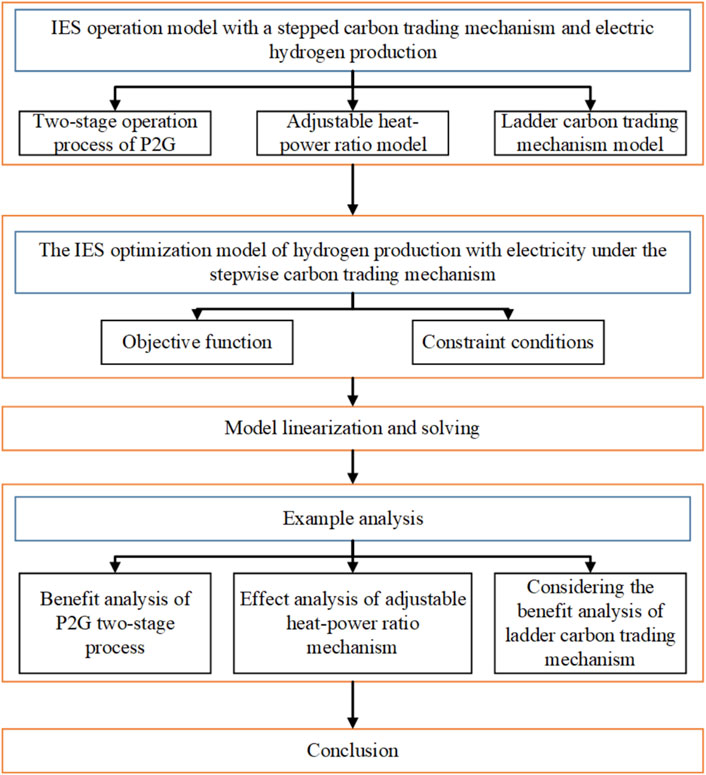
The research process of this article is shown in Figure 1.
The remaining chapters of this paper are arranged as follows: In Section 2, an integrated energy system operation optimization model with stepped carbon trading mechanism and electricity hydrogen production is established. In Section 3, the IES optimization model of hydrogen production with electricity under the stepped carbon trading mechanism is constructed. In Section 4, the above model is linearized and solved; in Sections 5, 6, the corresponding conclusions are obtained through simulation analysis, which proves the effectiveness of the proposed strategy.
2 Operation model of integrated energy system
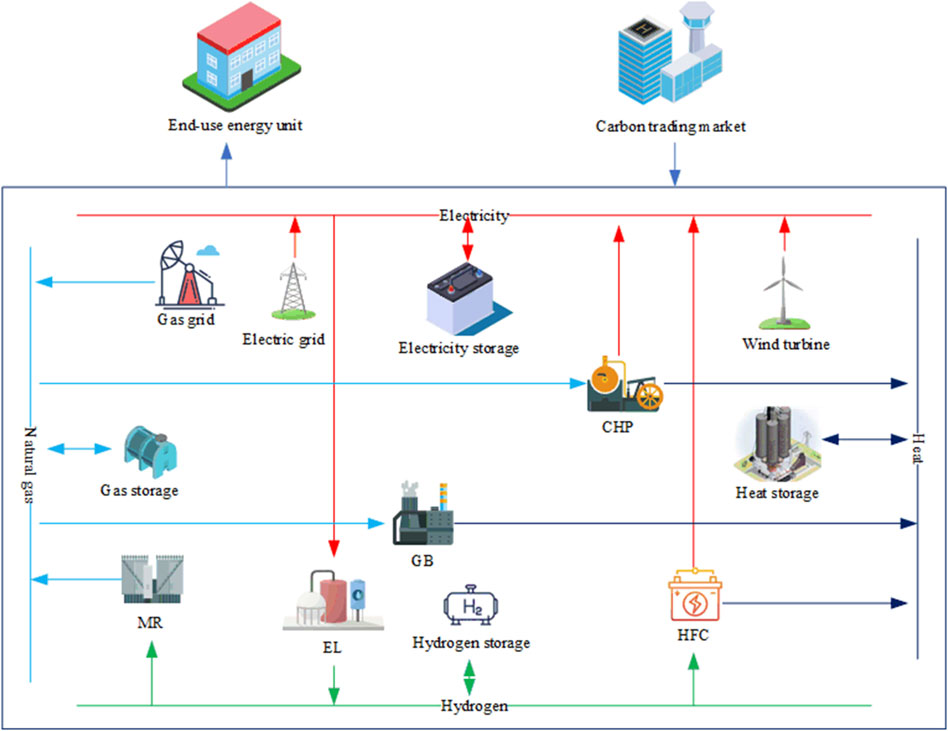
The IES, an entity that amalgamates diverse energy forms, fulfills internal energy requirements through an extensive range of energy and supply equipment. A comprehensive schematic of this structure is depicted in Figure 2.
The electrolytic cell (EL) converts electrical energy into hydrogen gas, which then enters the methane reactor (MR) for conversion, generating natural gas. It is worth noting that hydrogen can also be directly used for thermoelectric production, which not only reduces energy loss but also improves the effective utilization of energy. Gas boilers (GB) generate thermal energy by burning natural gas to meet the demand for thermal energy. At the same time, cogeneration (CHP) units are also burning natural gas, not only providing support for electricity supply, but also meeting the demand for heat load. The synergistic operation of natural gas pipeline network and methane reactor (MR) is excellent, which can efficiently meet the demand of natural gas load. In addition, the IES system also includes devices for storing electricity, gas, heat, and hydrogen energy, providing strong guarantees for the sustainable utilization of energy. Finally, regarding the issue of carbon emissions, the carbon dioxide emissions or absorption generated by the operation of each device will be traded through the carbon trading market to achieve a win-win situation of environmental protection and economic benefits.
2.1 Two-stage operation process of P2G
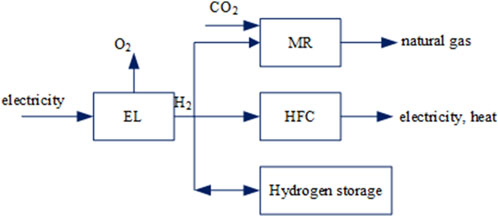
Hydrogen energy is an efficient clean energy source that has shown enormous potential in applications. Figure 3 provides a comprehensive description of the two-stage operation process of P2G.
EL first completes the conversion process from electrical energy to hydrogen energy. Subsequently, a portion of hydrogen gas, along with carbon dioxide, is sent into the MR and undergoes a synthesis reaction to generate natural gas. These generated natural gas are then allocated to the natural gas load, GB, and CHP to meet different energy needs. At the same time, some hydrogen energy is directly transported to HFC for generating electrical and thermal energy, achieving direct energy utilization. The remaining hydrogen energy is stored in hydrogen storage tanks for future use. It is worth mentioning that hydrogen energy does not need to be converted into natural gas through intermediate conversion before use in GB or CHP, but can be directly converted into electrical and thermal energy through HFC. This direct energy conversion method not only reduces energy loss, but also avoids the production of carbon dioxide, achieving the dual goals of environmental protection and efficiency. The aforementioned energy conversion model can be summarized as follows:
2.1.1 HFC equipment
The conversion efficiency of HFC between thermal and electrical energy is considered a constant value, which means that its efficiency remains consistent regardless of whether it is converted into electrical or thermal energy. Given this characteristic, this article has developed an HFC model with adjustable thermoelectric ratio. This model aims to adapt to different energy demands and application scenarios by flexibly adjusting the output ratio of thermal energy and electric energy. In short, this model can optimize the conversion efficiency between thermal and electrical energy based on actual situations, achieving efficient energy utilization, which can be expressed as Equation 1:
where,
2.1.2 EL equipment
In Equation 2,
2.1.3 MR equipment
In Equation 3,
2.2 Adjustable heat-power ratio model
CHP utilizes the combustion process of natural gas to generate electricity, while effectively utilizing the waste heat generated during this process to meet the demand for heat load. Its unique advantage lies in having an adjustable heat-power ratio, which means that the system can flexibly adjust the output ratio of electrical and thermal energy based on actual operating conditions and real-time needs. Through this dynamic adjustment, CHP can maximize operational efficiency and achieve efficient energy utilization. The mathematical model is represented as Equation 4:
where,
2.3 Ladder carbon trading mechanism model
The core of carbon trading mechanism is to establish legal carbon emission rights and promote the exchange of these rights among producers in the market, in order to effectively control carbon emissions. Under this mechanism, regulatory authorities will first allocate corresponding carbon emission quotas based on the actual situation of each emission source. In this way, manufacturers can carry out production and emission activities within this quota range. If a producer’s actual carbon emissions are lower than their quota, they can sell the remaining quota on the carbon trading market to gain economic benefits. On the contrary, if a manufacturer’s emissions exceed their quota, they must purchase additional quotas in the market to make up for this difference. The tiered carbon trading mechanism model mainly consists of three parts:
2.3.1 Actual carbon emission model
In MR, the process of converting hydrogen into natural gas will absorb a certain amount of carbon dioxide, which is an important link that cannot be ignored. Therefore, when constructing actual carbon emission models, this factor must be fully considered. Specifically, the model can be expressed as Equation 5:
where,
2.3.2 Stepped carbon emissions trading model
Given the carbon emission quota and actual carbon emissions of the IES, it is possible to determine the volume of carbon emissions that are eligible for trading in the carbon market.
In Equation 6,
In contrast to the traditional carbon trading pricing mechanism, this paper employs a stepped pricing mechanism aimed at further reducing carbon emissions. This mechanism divides the pricing into multiple intervals, with the purchase price increasing as the number of carbon emission quotas purchased rises. The resulting step-by step carbon transaction cost is calculated as Equation 7:
where,
2.3.3 Carbon emission quotas
IES is mainly composed of three carbon emission sources: high-quality electricity, GB, and CHP. In the current quota allocation system, the free quota method dominates. For the sake of analysis, this article makes the following assumption: high-quality electricity purchases mainly come from coal-fired power generation units. Given that coal-fired power generation generates certain carbon emissions, this assumption requires a more precise consideration of the impact of high-quality electricity purchases on overall carbon emissions when constructing IES carbon emission models.
In Equation 8,
3 The IES optimization model of hydrogen production with electricity under the stepwise carbon trading mechanism
3.1 Objective function
Taking into account the IES’s energy purchase cost, step-by-step carbon transaction cost, and wind curtailment cost, this paper establishes a low-carbon economic dispatch objective aimed at minimizing the overall operating cost. This objective is formulated as Equation 9:
where,
The energy purchase cost can be expressed as Equation 10.
where,
The cost of wind curtailment can be expressed as Equation 11.
where,
3.2 Constraint conditions
3.2.1 Equipment operation constraints
The wind power output constraint is expressed as Equation 12.
where,
The GB operation constraint is expressed as Equation 13.
where,
The modeling approach adopted in this paper for energy storage equipment, encompassing electricity, heat, and gas, is similar in nature. Therefore, a unified modeling framework is employed to represent the characteristics of these energy storage systems, which can be expressed as Equation 14:
where,
3.2.2 Power balance constraint
Taking into account the inherent randomness and volatility of wind power, this paper refrains from considering scenarios where the IES sells electricity to the higher-level power grid in order to mitigate the burden on the main grid and uphold its reliability. Consequently, the power balance constraint is formulated as Equation 16:
where,
The thermal power balance constraint is expressed as Equation 17.
where,
The balance power of natural gas is expressed as Equations 18, 19.
where,
The hydrogen equilibrium constraint is expressed as Equation 20
where,
4 Model linearization and solving
The IES low-carbon economic dispatch model developed in this paper, incorporating electricity hydrogen production and adjustable heat-to-electricity ratio, is a complex mixed nonlinear model. To facilitate its solution, it is imperative to transform this model into a mixed positive linear form. This transformation enables the utilization of the Yalmip toolbox, which can call the CPLEX solver to efficiently solve the problem. Notably, the actual carbon emission model involves a square term, necessitating piecewise linearization. The steps involved in this process are as follows:
Step 1. According to the required accuracy, take Q + 1 segmentation point
Step 2. Add Q+1 continuous auxiliary variable
Step 3. Replace the non-linear function with Equation 22.
Since the step price is a piecewise function, the linear transformation can be completed by omitting Step 1 and combining Step 2 and Step 3.
5 Example analysis
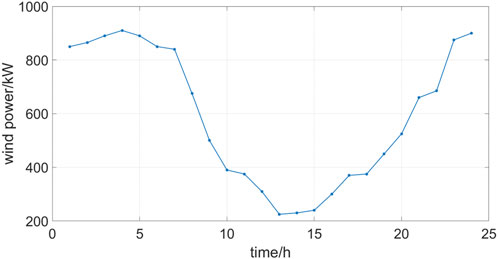
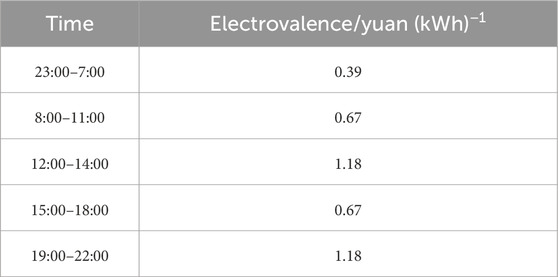
All simulation data in this article are from fund projects. To verify the effectiveness of the proposed low-carbon economic dispatch strategy, numerical examples are set up for verification. The optimization scheduling is carried out on a 24-h cycle, and the actual output results of the internal wind turbines in this IES are shown in Figure 4.The operating parameters within the integrated energy system are shown in Tables 1–4.
The cost of natural gas stands at 0.35 yuan/kWh. For coal-fired and natural gas-fired units, the carbon emission quotas per unit of power consumption are 0.8 kg/kWh and 0.39 kg/kWh, respectively. Additionally, the penalty cost associated with each unit of wind energy abandonment is set at 0.2 yuan/kWh.
5.1 Benefit analysis of P2G two-stage process
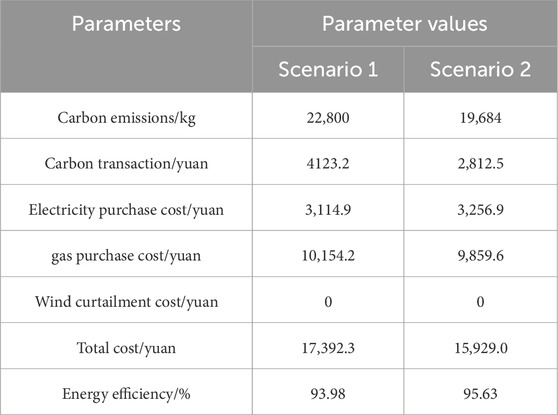
To highlight the scheduling benefits of the two-stage operational process involving the refinement of P2G to EL, MR, and HFC combination, two operational scenarios are established for comparison. Scenario 1 represents the traditional setup with P2G equipment within the IES, while Scenario 2 incorporates the two-stage operational equipment that replaces P2G with a combination of EL, MR, and HFC. The scheduling outcomes under these distinct operating scenarios are summarized in Table 5. Upon inspection, it becomes evident that Scenario 2 exhibits a relatively lower total operating cost and reduced carbon emissions. This underscores the advantage of refining the P2G two-stage process, which not only decreases operating expenses but also contributes to lower carbon emissions, thereby offering notable multifaceted benefits.
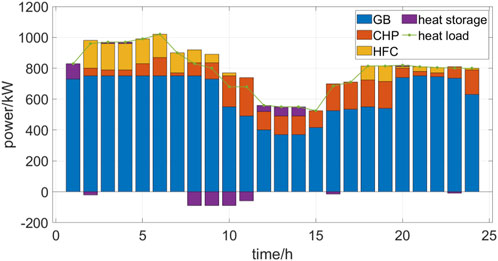
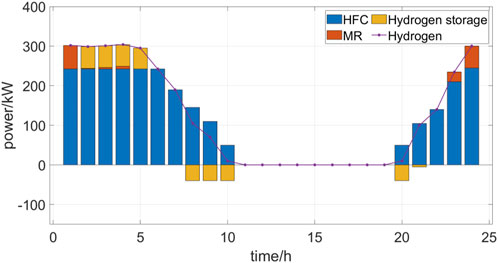
Figures 5–7 show the internal electrical power balance, thermal power balance, hydrogen energy balance, and scheduling plan of IES in Scenario 2, respectively.
From Figure 5, it can be seen that in Scenario 2, IES first inputs abundant wind power into EL equipment for hydrogen production, consuming all wind power. From Figure 7, it can be seen that a portion of hydrogen energy is stored inside the hydrogen storage system, playing a role in low storage and high generation arbitrage. A portion is transported to HFC for thermoelectric production, and another portion is transported to MR for natural gas synthesis. Due to the fact that hydrogen energy is synthesized into natural gas through MR and then transported to GB and CHP for energy supply, it undergoes energy loss in multiple stages. In HFC, the thermal and electrical production of hydrogen energy has high energy consumption, while reducing an intermediate energy conversion link. Therefore, hydrogen energy is limited and can be transported to HFC for thermal and electrical production. Therefore, HFC is in a full capacity state, and the remaining hydrogen energy is then converted into natural gas through MR.
According to Table 5, the energy utilization rate of Scenario 2 is relatively high, mainly due to the following reasons: firstly, hydrogen energy prioritizes the high-efficiency HFC for thermoelectric production, reducing energy cascade consumption; The second constraint is the cost of carbon emissions, which increases the purchase of electricity from superiors in Scenario 2, reduces the electricity load supplied through CHP, and thus reduces some energy loss.
At the same time, although MR can convert hydrogen energy into natural gas and absorb some carbon dioxide, burning natural gas will release carbon dioxide again. At this time, the natural gas combustion of GB and CHP is already in a high carbon emission state, and the carbon dioxide produced by this part of natural gas combustion will be higher than the absorbed carbon dioxide. However, hydrogen can be directly produced through HFC for thermoelectric production without generating carbon emissions, and can share a portion of the burden of GB and CHP carbon emissions, resulting in less carbon emissions compared to Scenario 1.
5.2 Effect analysis of adjustable heat-power ratio mechanism
The process of adjusting the thermoelectric ratio is as follows: 1) Determine the target thermoelectric ratio: Determine the expected thermoelectric ratio based on user needs or system optimization goals. 2) Adjusting flue gas flow: By using a flue gas control device, the flow path and flow rate of high-temperature flue gas in the system are changed, thereby adjusting the distribution of heat between power generation and heating. 3) Adjusting heat conversion: Based on the heat distribution after flue gas regulation, adjust the working parameters of heat conversion devices (such as absorption heat pumps) to ensure that the heat supply meets the requirements of the target thermoelectric ratio. 4) Monitoring and feedback: Real time monitoring of the thermal electric ratio and operating status of the system, adjusting the working parameters of the flue gas control device and heat conversion device based on the feedback results until the target thermal electric ratio is achieved.
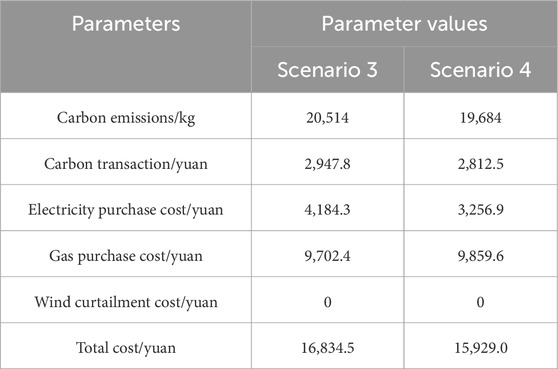
To capture the variable heat-power ratio characteristics of both CHP and HFC, two scenarios are established for comparative analysis. In Scenario 3, the heat-power ratio of CHP and HFC remains fixed, whereas in Scenario 4, this ratio is adjustable. The scheduling outcomes for both scenarios are presented in Table 6.
From the comparison of the data in the table, it is evident that Scenario 4 has achieved significant reductions in carbon emissions, carbon trading costs, and total costs compared to Scenario 3. Specifically, Scenario 4 reduced carbon emissions by 830 kg compared to Scenario 3. This achievement not only helps to promote the goal of low-carbon emissions reduction, but also reflects the optimization effect of Scenario 4 in energy utilization and emission control. At the same time, the carbon trading cost of the system has been reduced by 135.3 yuan, which directly reduces the operating costs of the enterprise and improves economic benefits. It is worth mentioning that the total cost has also decreased by 905.5 yuan, which further proves the advantage of Scenario 4 in reducing operating costs.
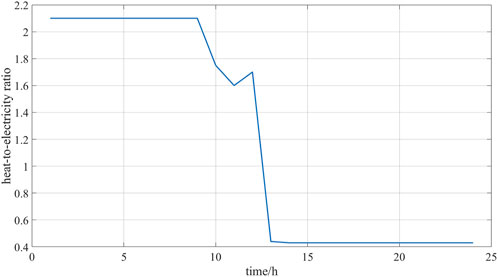
Taking CHP as an example for specific analysis, the thermoelectricity of each period of CHP is shown in Figure 8.
As Figure 8 illustrates, during nighttime, the heat load peaks, resulting in the majority of this demand being met by GB due to its superior power generation efficiency. CHP supplements the remaining heat load. Early in the morning, when wind power output peaks and the electric load is at its lowest, wind power suffices to meet the electric load demand. However, CHP is required to supply a portion of the heat load, leading to its operation at maximum heat-to-electricity ratio. Conversely, during daytime, when the heat load is low and the electric load peaks, the system opts for CHP to power the electric load due to higher electricity prices and lower gas prices. This results in CHP operating at its minimum heat-to-power ratio.
5.3 Considering the benefit analysis of ladder carbon trading mechanism
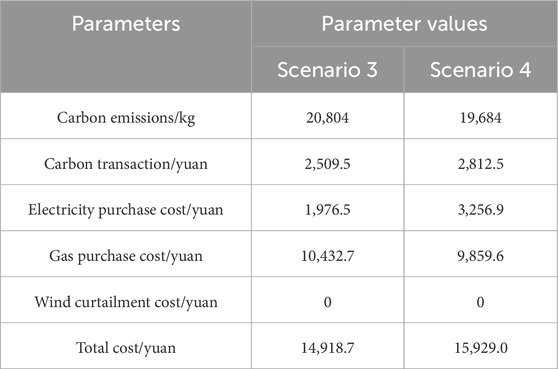
In order to comprehensively evaluate the effectiveness of the gradual carbon trading mechanism introduced in this article in practical applications, specific parameter conditions were set for simulation analysis. Specifically, this article sets a 25 percent price growth rate to simulate the growth trend of carbon trading prices over a period of time; Meanwhile, a basic carbon trading price of 250 yuan per ton is set as the benchmark for analysis. During the simulation process, two scenarios were established for comparative analysis to highlight the advantages of a gradual carbon trading mechanism. Scenario 5 represents the low-carbon economic dispatch mode under the traditional carbon trading mechanism, while Scenario 6 represents the low-carbon economic dispatch mode under the tiered carbon trading mechanism. It also considers energy purchase costs, carbon trading costs, and wind abandonment costs, but its operating mechanism is more complex and refined. The simulation results are shown in Table 7.
The data in the table provides strong evidence on the effectiveness of implementing a tiered carbon trading mechanism. Compared to Scenario 5, Scenario 6 reduced carbon emissions by 1,120 kg, a reduction of 5.38 percent. This significant reduction fully demonstrates the effectiveness of the tiered carbon trading mechanism in curbing carbon emissions and achieving emission reduction goals. Further analysis of the data reveals that Scenario 5 was indeed affected by carbon trading costs during the optimization process. Although natural gas is cheaper than electricity in terms of price, in Scenario 5, the system burns natural gas in a high emission state, resulting in an increase in carbon emissions and the need to purchase more carbon emission quotas from the carbon trading market, thereby increasing additional costs. This cost increase makes the cost savings of choosing natural gas over electricity negligible, unable to offset the negative impact of high carbon emissions. In scenario 6, the implementation of a tiered carbon trading mechanism gradually increases the price of carbon emission quotas, effectively limiting the system’s carbon emissions. This mechanism promotes the system to reduce the purchase of natural gas and increase the purchase of electricity during the optimization process, achieving a new energy balance. This balance not only helps to reduce carbon emissions, but also improves energy efficiency and further reduces operating costs. Although the total cost of Scenario 6 is 1,010.3 yuan higher than Scenario 5, considering that it achieved 1,120 kg of carbon reduction, this cost increase is completely acceptable. This indicates that under the tiered carbon trading mechanism, the system can significantly reduce carbon emissions while maintaining relatively low operating costs, achieving a win-win situation for both economic and environmental benefits.
6 Discussion
In the study of the optimal scheduling strategy for the integrated energy system of electricity and hydrogen production under the stepped carbon trading mechanism, some limitations are inevitably encountered. Firstly, the simplification of model assumptions makes problem solving more efficient, but ignores the dynamic changes in external factors such as energy prices and carbon emission prices in the real world, which may lead to biases in the model when simulating real situations, affecting its accuracy and practicality.
Secondly, the limitations of data availability pose a challenge to research. Despite efforts to collect relevant data, it is difficult to obtain carbon emission data for certain regions or specific time periods, which may result in inaccurate calculation of carbon emission costs and affect the comprehensiveness and accuracy of evaluating energy system optimization scheduling strategies.
In addition, the uncertainty of technological development has also brought challenges. Electric hydrogen production technology and energy system technology continue to evolve, and the emergence of new technologies may have a significant impact on existing systems. However, due to the unpredictability of technological development, research may not be able to fully consider the impact of these new technologies, resulting in biased research results in the context of future technological developments.
In response to these limitations, the following suggestions are proposed for future research. Firstly, external factors such as energy prices, carbon emission prices, policy changes, etc., should be more comprehensively considered in the model to improve its accuracy and practicality. Secondly, strengthen data collection and processing to ensure the comprehensiveness and accuracy of data, in order to overcome limitations in data availability. At the same time, pay attention to technological development trends, adjust and optimize model parameters and strategies in a timely manner to adapt to changes in future technological development.
Finally, emphasize the importance of interdisciplinary cooperation. Due to the involvement of multiple disciplines in this study, such as energy engineering, environmental science, economics, etc., strengthening interdisciplinary cooperation will help to jointly solve the problems encountered in research, improve the level and quality of research. Through communication and cooperation among different disciplines, we can gain a more comprehensive understanding of the application effect of the tiered carbon trading mechanism in energy system optimization and scheduling, providing strong support for future energy transformation and sustainable development.
7 Conclusion
This paper centers on the IES’s engagement in the step-by-step carbon trading market, meticulously examining the intricate operational process of the P2G two-stage. It takes into account the adjustable attributes of the CHP and HFC heat-to-electric ratio, thereby establishing a comprehensive optimal scheduling model for IES low-carbon economy. Through rigorous research and thorough analysis, the following conclusions are derived:
(1) By substituting P2G with EL, MR, and HFC combined operational equipment, we can maximize the utilization of hydrogen’s high energy efficiency, thus minimizing energy losses in the cascade process while simultaneously boosting wind power consumption. Furthermore, HFC’s ability to share the energy supply demands of CHP and GB results in a reduction of carbon emissions from these sources, thereby contributing to an overall decrease in carbon emissions.
(2) By factoring in the adjustable heat-power ratio of CHP and HFC, their output levels can be dynamically adjusted to align with real-time energy demands. This flexibility not only enhances the efficiency of energy supply but also enables intelligent heat-to-electricity ratio adjustments based on fluctuations in time-of-use electricity and gas prices. This approach effectively lowers operational costs while also contributing to carbon emission reduction, thus achieving a harmonious balance between environmental protection and economic benefits.
(3) By engaging in the carbon trading market, IES can achieve significant carbon emission reductions while maintaining low operational expenses. When compared to the traditional carbon trading pricing model, the stepwise carbon trading mechanism exhibits a stronger binding force on carbon emissions, thereby more effectively guiding the reduction of carbon emissions.
(4) The optimization and scheduling strategy for the integrated energy system of electric hydrogen production under the tiered carbon trading mechanism incentivizes the system to reduce carbon emissions and optimize energy use by setting trading prices for different carbon emission tiers in practical operation. This strategy can effectively improve energy utilization efficiency, reduce environmental pollution, and promote the consumption of renewable energy. In addition, by refining the P2G process and introducing equipment such as electrolytic cells and methane reactors, the flexibility and economy of the system have been further enhanced. Overall, this strategy provides strong support for achieving a low-carbon economy and sustainable development.
Data availability statement
The original contributions presented in the study are included in the article/supplementary material, further inquiries can be directed to the corresponding author.
Author contributions
MX: Methodology, Writing–original draft. DZ: Data curation, Writing–original draft. CY: Formal Analysis, Writing–original draft. SZ: Methodology, Writing–original draft. JW: Software, Writing–review and editing. WL: Resources, Writing–original draft. HL: Formal Analysis, Writing–review and editing.
Funding
The authors declare that financial support was received for the research, authorship, and/or publication of this article. The authors declare that this study received funding from the State Grid Liaoning Electric Power Co., Ltd. Science and Technology Project (2023YF-159). The funder was not involved in the study design, collection, analysis, interpretation of data, the writing of this article, or the decision to submit it for publication.
Conflict of interest
Authors MX, DZ, CY, SZ, JW, and WL were employed by State Grid Liaoning Electric Power Co., Ltd. Skills Training Center.
The remaining author declares that the research was conducted in the absence of any commercial or financial relationships that could be construed as a potential conflict of interest.
Publisher’s note
All claims expressed in this article are solely those of the authors and do not necessarily represent those of their affiliated organizations, or those of the publisher, the editors and the reviewers. Any product that may be evaluated in this article, or claim that may be made by its manufacturer, is not guaranteed or endorsed by the publisher.
References
Li, Y., Tang, W., and Wu, Q. (2019). “Modified carbon trading based low-carbon economic dispatch strategy for integrated energy system with CCHP,” in IEEE Milan PowerTech, June 23–27, 2019, Milan, Italy (IEEE).
Liu, D., Wei, Q., and Yan, P. (2015). Generalized policy iteration adaptive dynamic programming for discrete-time non-linear systems. IEEE Trans. Syst. Man, Cybern. Syst. 45 (12), 1577–1591. doi:10.1109/tsmc.2015.2417510
Liu, Y., Chen, H., and Li, L (2022). Applications and challenges of porous carbon with different dimensions in supercapacitors-a mini review. Front. Energy Res. 10. doi:10.3389/fenrg.2022.951701
Liu, Y., Jiang, Z., Lichao, H., Xing, Z., Chen, M., and Zhang, P. (2021). Data-driven robust value iteration control with application to wind turbine pitch control. Optim. Control Appl. Methods 44 (2), 637–646. doi:10.1002/oca.2834
Liu, Y., Zhang, H., Yu, R., and Xing, Z. (2020). H tracking control of discrete-time system with delays via data-based adaptive dynamic programming. IEEE Trans. Syst. Man, Cybern. Syst. 50 (11), 4078–4085. doi:10.1109/tsmc.2019.2946397
Lu, Q., Guo, Q., and Zeng, W. (2021). Optimization scheduling of an integrated energy service system in community under the carbon trading mechanism: a model with reward-penalty and user satisfaction. J. Clean. Prod. 323, 129171. doi:10.1016/j.jclepro.2021.129171
Olsen, D., Dvorkin, Y., Fernanrdez-Blanco, R., and Ortega-Vazquez, M. A. (2018). Optimal carbon taxes for emissions targets in the electricity sector. IEEE Trans. Power Syst. 33 (6), 5892–5901. doi:10.1109/tpwrs.2018.2827333
Song, J., Huang, L.-Y., Karimi, H. R., Niu, Y., and Zhou, J. (2021). ADP-based security decentralized sliding mode control for partially unknown large-scale systems under injection attacks. IEEE Trans. Circuits Syst. I: Regul. Pap. 67 (12), 5290–5301. doi:10.1109/tcsi.2020.3014253
Tan, Z., Zhang, X., Xie, B., Wang, D., Liu, B., and Yu, T. (2018). Fast learning optimiser for real-time optimal energy management of a grid-connected microgrid. IET Gener. Transm. Distrib. 12 (12), 2977–2987. doi:10.1049/iet-gtd.2017.1983
Wang, R., Wen, X., Wang, X., Fu, Y., and Zhang, Yu (2022). Low carbon optimal operation of integrated energy system based on carbon capture technology, LCA carbon emissions and ladder-type carbon trading. Appli Energy 311, 118664. doi:10.1016/j.apenergy.2022.118664
Wang, Y., Fang, Li, Yu, H., Wang, Y., Qi, C., Yang, J., et al. (2020). Optimal operation of microgrid with multi-energy complementary based on moth flame optimization algorithm. Energy Sources A: Recovery Util. Environ. Eff. 42 (7), 785–806. doi:10.1080/15567036.2019.1587067
Yang, X., Zhang, L., Wu, L., Leng, Z., Liu, K., and Xu, Z. (2022). Economic optimal dispatch of active distribution network with combined cooling, heating and power microgrid considering IDR. Power Syst. Prot. Control 50 (03), 19–28. doi:10.19783/j.cnki.pspc.210425
Yin, Y., Liu, T., Wu, L., and Liu, Y. (2021). Day-ahead risk-constrained stochastic scheduling of multi-energy system. J. Mod. Power Syst. Clean Energy 9 (4), 720–733. doi:10.35833/mpce.2020.000375
Zhang, J., Sun, K., Li, C., Liu, H., Huang, W., Zhou, B., et al. (2023). Economic scheduling of gaseous-liquid hydrogen generation and storage plants considering complementarity of multiple products. J. Mod. Power Syst. Clean Energy 11 (1), 223–233. doi:10.35833/mpce.2021.000260
Zhou, Q., Shahidehpour, M., Li, Z., Che, L., Alabdulwahab, A., and Abusorrah, A. (2019). Compartmentalization strategy for the optimal economic operation of a hybrid AC/DC microgrid. IEEE Trans. Power Syst. 35 (2), 1294–1304. doi:10.1109/tpwrs.2019.2942273
Keywords: integrated energy system, electric hydrogen production, stepped carbon trading mechanism, energy efficiency, optimize scheduling
Citation: Xu M, Zhao D, Yu C, Zhang S, Wan J, Li W and Liu H (2024) Research on the optimal scheduling strategy of the integrated energy system of electricity to hydrogen under the stepped carbon trading mechanism. Front. Energy Res. 12:1410120. doi: 10.3389/fenrg.2024.1410120
Received: 31 March 2024; Accepted: 30 July 2024;
Published: 12 September 2024.
Edited by:
Yuanxing Xia, Hohai University, ChinaReviewed by:
Pengfei Duan, Taiyuan University of Technology, ChinaHaipeng Chen, Northeast Electric Power University, China
Copyright © 2024 Xu, Zhao, Yu, Zhang, Wan, Li and Liu. This is an open-access article distributed under the terms of the Creative Commons Attribution License (CC BY). The use, distribution or reproduction in other forums is permitted, provided the original author(s) and the copyright owner(s) are credited and that the original publication in this journal is cited, in accordance with accepted academic practice. No use, distribution or reproduction is permitted which does not comply with these terms.
*Correspondence: Minghu Xu, eHVtaW5naHVva0AxNjMuY29t
 Minghu Xu
 Deren Zhao1