 Huang Yonghao
 Dan Shuheng
94% of researchers rate our articles as excellent or good
Learn more about the work of our research integrity team to safeguard the quality of each article we publish.
Find out more
ORIGINAL RESEARCH article
Front. Energy Res., 20 June 2024
Sec. Smart Grids
Volume 12 - 2024 | https://doi.org/10.3389/fenrg.2024.1408924
This article is part of the Research TopicLearning-assisted Diagnosis and Control of Electric Distribution NetworkView all 12 articles
Introduction: Due to the need for safety and aesthetics, 10 kV urban power grids are gradually dominated by all-cable lines. However, this trend also brings new challenges. Cables, which are equivalent to capacitors at industrial frequency, are prone to resonate with the voltage transformers (PTs) in the system, causing drastic changes in current and voltage and posing a threat to the stable operation of the system. In addition, the intrusion of lightning waves into the substation will lead to different residual magnetization in the PT core, which further changes the core inductance value and affects the ferromagnetic resonance of the system to a certain extent.
Methods: In order to deeply investigate the influence of remanent magnetism on the ferromagnetic resonance of the system, this paper establishes a simulation model of a 10 kV all-cable line based on the PSCAD software, and adopts a UMEC transformer capable of simulating the saturation characteristics to construct the PT, and simulates the intrusion currents by using a DC current source in order to generate remanent magnetism. By this method, the effect of remanent magnetization on the ferromagnetic resonance of the system is explored at different magnitudes and directions.
Results: The results of the study show that the residual magnetization has a significant effect on the ferromagnetic resonant inrush current of the voltage transformer. When the remanent magnetization value is positive and less than 0.6 pu, the ferromagnetic resonance inrush current of PT can be effectively suppressed, and the smaller the remanent magnetization value is, the better the suppression effect is. However, negative remanent magnetization cannot suppress the ferromagnetic resonance of the PT, but may exacerbate the inrush current, leading to more serious consequences.
Conclusion: This study helps to improve the stability of the power grid and also provides a valuable reference for future grid design and maintenance.
Cable lines have the advantages of long service life, large communication capacity, stable transmission quality, small external interference, good confidentiality, etc., Nowadays, with the continuous development of cities, more and more overhead lines are replaced by cables (Liu, 2024; Zheng et al., 2024). In the 10 kV system, the proportion of all-cable lines is increasing, which will lead to an increase in the capacitance to ground in the system, providing the necessary conditions for the occurrence of ferromagnetic resonance. Ferromagnetic resonance is a common resonance phenomenon in power systems, which is mainly caused by the saturation of nonlinear iron cores (Cao et al., 2023). Ferromagnetic resonance will lead to continuous oscillation of system voltage, resulting in voltage instability and power quality degradation; the current increase caused by resonance will lead to an increase in the copper loss and iron loss of the power equipment, thus causing overheating of the equipment, and the appearance of these situations is extremely destructive both for the power system and the electrical equipment (Chen et al., 2024).
For the core of a PT, saturation is one of its inherent properties (Kulkarni and Khaparde, 2004; Dasgupta, 2005; Vecchio and Poulin, 2010). The cable line is capacitive to ground, while the excitation impedance of the PT is large and the core is inductive. When the system is in normal operation, the inductive impedance is larger than the capacitive impedance exhibited in the circuit, and the neutral voltage offset is small; when certain non-simultaneous operations occur in the power system, for example, asymmetrical closing operation of a certain phase of the circuit breaker in the cable line (Chen, 2022), and abnormal switching of the circuit breaker of the shunt capacitor bank (Wang et al., 2022), etc., the inconsistency in the volt-ampere characteristic of the PT will lead to the saturation of the iron core, and it will cause a serious ferro-magnetic resonance phenomenon (Andrei et al., 1989; Zhong et al., 2021); in the actual power system, when lightning weather occurs so that the overhead lines on the adjacent system is struck by lightning, although the lightning arrester will be a strong inrush current into the earth, but in a short time there will still be a part of the continuation of the current along the transmission line propagation and ultimately invade the power system, which will lead to changes in the magnetic field around the core within the PT, the residual remanence of magnetic field will, to a certain extent, affect the ferromagnetic resonance of the system. Ferromagnetic resonance of the system.
In the existing literature to analyze the influence factors of PT ferromagnetic resonance characteristics mainly focus on the internal parameter factors, such as the different values of the distribution line parameters (Chen et al., 2021), the different parameters of the PT body (hysteresis loss, leakage magnetism, etc.) (Ping and Wang, 2004), the different types of faults occurring (whether or not the neutral point is grounded) (Wang, 2021), etc., and very few studies have taken into account the effect of the remanent magnetism that exists in the PT iron core on the ferromagnetic resonance generated by the system. In this paper, the 3/5 core UMEC (unified magnetic equivalent circuit) transformer in PSCAD software is used to simulate the PT (Zhang and Wen, 2009), and a DC current source is used to simulate the remanent magnetism, taking phase A as an example, connecting the DC current source to phase A of the PT and withdrawing the excitation after 1 s, and then changing the magnitude and direction of the current to change the magnitude and direction of the remanent magnetism. The size and direction of the residual magnetism is changed by changing the size and direction of the current, and the waveform of the line current of phase A of the voltage transformer is observed to analyze whether ferromagnetic resonance occurs in the PT under this operation, and to propose the effective suppression measures of the residual magnetism on the ferromagnetic resonance of the PT according to the simulation results.
PT is a special transformer used to convert high voltage to low voltage for use by measurement or protection equipment, and its main functions include the following three points (Liu et al., 2024): 1. Reducing the high voltage in the power system to a standard value (e.g., 110 V or 100 V), so that the voltage can be monitored and recorded using a standard measuring instrument without direct contact with the high-voltage line; 2. PT provides voltage signals for the protection relay to identify abnormal conditions such as overvoltage or undervoltage and trigger the corresponding protection action. 3. Provides voltage signals for identifying abnormal conditions such as overvoltage or undervoltage and triggering the appropriate protective action; 3. Voltage transformers provide electrical isolation, protecting downstream measuring equipment, personnel and systems from the direct effects of high voltage. When ferromagnetic resonance occurs, the basic schematic is shown in Figure 1 (Zhao, 2018; Yaohua et al., 2019).
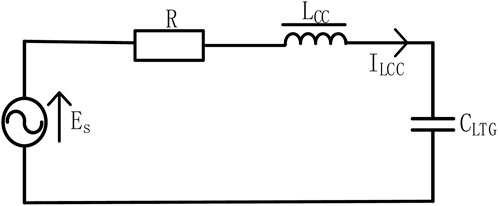
Figure 1. Basic principle of ferromagnetic resonance.
The relationship between the electric potential
The ground capacitive reactance
Therefore, through the above expression we can find that the ferromagnetic resonance does not have a uniform intrinsic frequency, which is related to the saturation depth of the nonlinear core, which further indicates that it is closely related to the magnitude of the current, so that the existence of ferromagnetic resonance phenomenon can be intuitively found through the current in the system.
To determine whether ferromagnetic resonance occurs in a real system, the current in the primary winding is the most suitable monitoring quantity: the current of the PT in normal operation is about zero milliamps to a few milliamps, while it will increase to tens of milliamps or even several amps when ferromagnetic resonance occurs (Fen-Yan and Bao, 2017; Yuan et al., 2022).
The simulation model of PSCAD is shown in Figure 2.
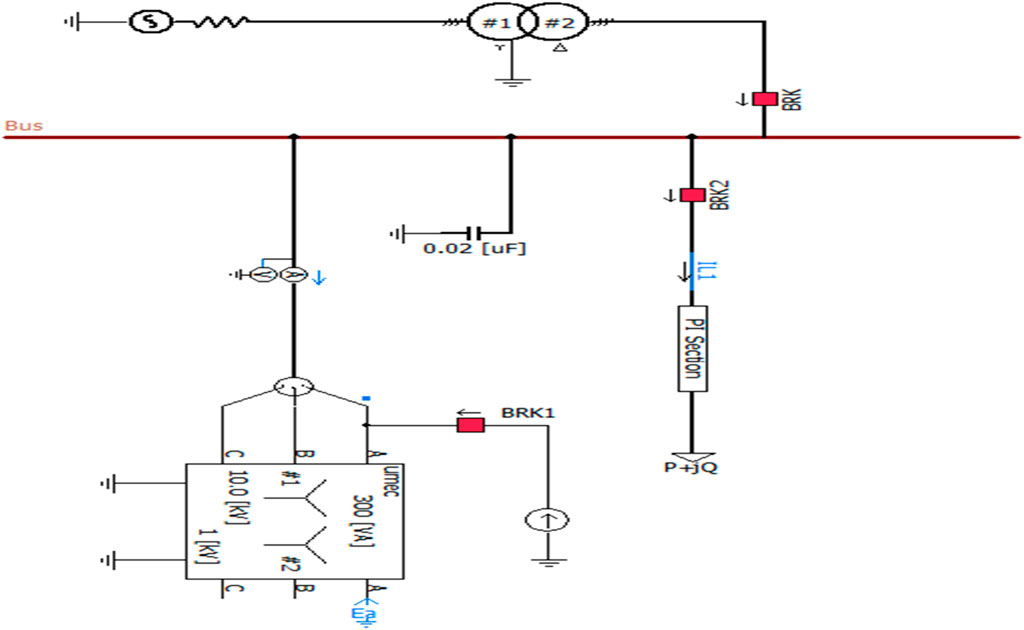
Figure 2. Simulation of all-cable line simulation on 10 kV side.
This study focuses on simulating fully cabled lines on the 10 kV side in a substation. In a power system, the electrical energy generated by a power plant is transmitted to the end-users through transformers and transmission lines, and these key electrical devices form the infrastructure of the power system. The simulation model used in this paper reproduces this process in detail and is modeled as in Figure 2. The generator is connected to a three-phase double-winding step-down transformer and connected to the incoming side of the busbar, and the bus-side circuit breaker is used to control the system casting and switching, which serves as the generating and transmitting part of the system. The terminal voltage of the generator is 110 kV, the frequency is 50 Hz, the amplitude angle is 10°, and the value of the internal resistance of the power supply is 10; in PSCAD V4.6, the transformer has been added with the option of the J-A model, which can take into account the hysteresis; the J-A model was proposed by two scholars D.C. Jiles and D.L. Atherton in 1986, based on the theory of magnetic domains, and takes into account the effect of hysteresis. The J-A model is special in that it can consider the saturation and hysteresis characteristics of the core at the same time, and it can also simulate the magnetization and demagnetization process, and it also takes into account the magnetic domain change and energy loss, so that the results of the simulation of the transformer are more close to the actual situation (Tian et al., 2024), so in this paper, we choose the J-A model of transformer to reflect the hysteresis characteristics, in which the hollow core resistance is the same as the hysteresis characteristics, and the hysteresis characteristics are the same as the hysteresis characteristics, in which the hollow core resistance is the same as the hysteresis characteristics. Hysteresis characteristics, in which the hollow-core impedance is set to 0.2 pu, and the maximum value of magnetic flux density is generally set to 1.7 T (Xuyang et al., 2011). The component parameters of the transformer are shown in Table 1, and the nominal values of copper loss and positive sequence leakage reactance are given in reference (Yang et al., 2022).

Table 1. Transformer element parameter.
At the same time in the bus outlet side of the configuration of a 3/5 core column UMEC transformer, with this component to simulate the PT, the internal structure of the model is shown in Figure 3. PT 3/5 core column arrangement is also known as the three-phase five-pillar type, which means that the core of the PT has five columns, in which three columns on the head of the assembly of the magnet coils, which is often referred to as “three-phase”; the two columns on the side as its closed circuit. This is often referred to as the “three-phase”; the two posts on the side as its closed circuit. The core arrangement is a key design factor that determines the performance and suitability of the transformer. The link group of the core is Y0/Y0/D with a capacity of 300 VA.
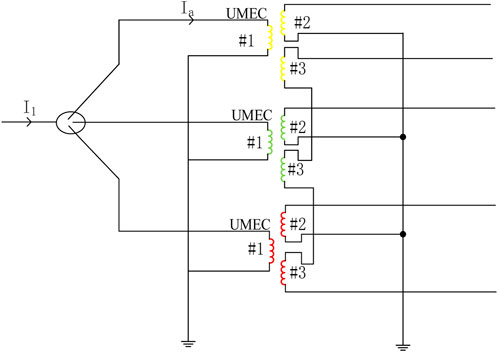
Figure 3. PT internal structure.
The excitation characteristic is a key parameter of the PT, which describes the relationship between the magnetic flux density of the core and the excitation current. When the magnetic flux density in the core grows to a certain critical value, even if the excitation current continues to increase, the rate of increase of the magnetic flux density still slows down, and the core enters a saturated state, which will affect the accuracy of the transformer. In engineering practice, by applying a voltage to the low-voltage end of the PT and make the high-voltage end of the method of open-circuit, to test the relationship between the applied voltage and the current flowing through the end of the PT is the excitation characteristics of the PT. According to this principle and method, the voltage and current parameters of each saturation point in Table 2 are obtained, and the excitation characteristic curve is drawn in the origin software as Figure 4. The knee point of the curve is point k, which represents the saturation voltage point of the iron core. Before the k point, the curve is first in the linear region, the voltage and current of the curve in this region is linear growth, and then with the increase of current, the voltage undergoes a nonlinear change to reach the knee point k. After the k point, the iron core is saturated, and even if the excitation current continues to increase, the enhancement of flux density is still slowed down.
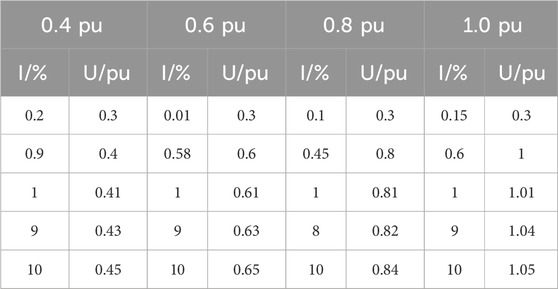
Table 2. I-U data at different saturation voltages.
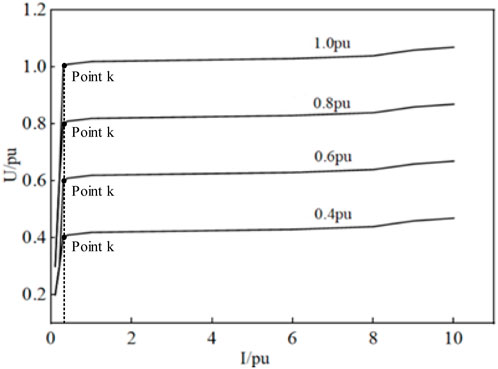
Figure 4. Different excitation characteristic curves of PT.
In PSCAD software, the core saturation of PT can be simulated by setting the values of 10 segmentation points on the internal I-V curve. According to the literature (Chen et al., 2023), it is known that when the saturation depth is 1.0 pu, the core of PT will not be saturated; when the saturation depth is 0.6 pu, the PT will be saturated, and the system will appear ferromagnetic resonance phenomenon. Therefore, this paper focuses on the PT saturation point voltage at 0.6 pu, and the curve data at 0.6 pu is selected for simulation.
The cable is capacitive at industrial frequency, the inductance and resistance parameters are very small and negligible, and the equivalence diagram is shown in Figure 5 below.
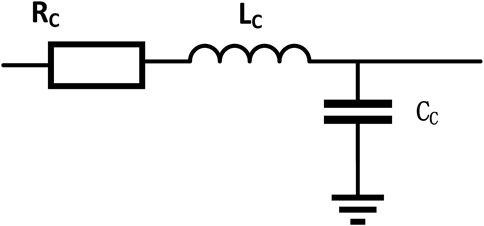
Figure 5. Cable equivalent line diagram.
In the document “Shanghai medium and low voltage distribution network technical guidelines” in the cable line distribution requirements (GBT, 2015): 10 kV cable line using XLPE cross-linked polyethylene insulated copper core cable, out of the line is generally 6 back, the cross-sectional area selected 3 * 400 mm2; for the power supply distance is also the same requirements: for the 10 kV line, the cable length of the central urban area per response 1.5 km, the cable length of urbanized areas per response 2 km, so the simulation of this paper cable length selected as 1 km per response. The cable length in urbanized areas is 2 km per response, so the cable length of the simulation in this paper is selected as 1 km per return, and the cable line is replaced by the total set of parameters, i.e., the total length of 6 km. The parameter values are based on the actual data in the distribution network of Shanghai (Chaolong et al., 2020), to ensure that the simulation results are accurate and reliable, and the values of various parameters of the cable under the length of the unit are shown in Table 3, and the values of the parameters of the cable line with 6 returns of 1 km are calculated and added to the model. The parameter values of six 1 km cable lines are calculated and added to the model.

Table 3. Parameter value per unit length of cable.
Residual magnetism is the state in which a portion of the core of a PT remains magnetized even after the magnetization process is removed by an external voltage. This phenomenon usually occurs when a system is subjected to a transient overvoltage, such as under circuit breaker operation, which may cause the core to magnetize to a point close to the saturation point, where the core retains a certain level of magnetic flux even after the overvoltage has disappeared.
The amount of residual magnetism in the core after power failure depends on the magnitude of the current during energization and the test time. Literature (Jin et al., 2009) proposed a formula for the derivation of the size of the residual magnetism: take the power supply
The residual magnetism
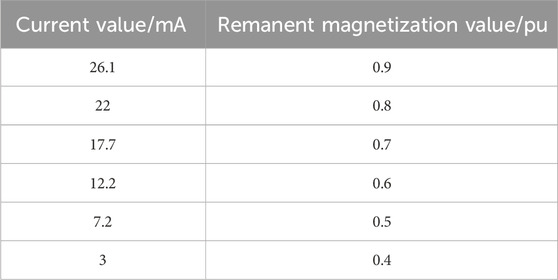
Table 4. Relationship between DC current and magnitude of remanent magnetization.
Figure 6. Residual magnetization versus current.
Firstly, the accuracy of the constructed model should be checked to distinguish whether the PT is in ferromagnetic resonance when the core is saturated by observing and comparing the current waveform graphs. In the literature (Zhao, 2020), the author Li Xuyang considered that the PT may be affected by the saturated over-excitation inrush current and cause errors in the detection results, and thus proposed a method for the detection of ferromagnetic resonance in power transformers, that is, the waveform symmetry method is used to distinguish the ferromagnetic resonance inrush current: for the normal operation of current, the current is sinusoidal, with the same period of oscillation; and for the resonance of the inrush current, the waveform is For the resonant inrush current, the waveform is spiky and alternates between positive and negative spikes. This accuracy analysis is simulated based on this study.
When the PT core is not saturated, the circuit breaker operates normally, measure the A-phase line current
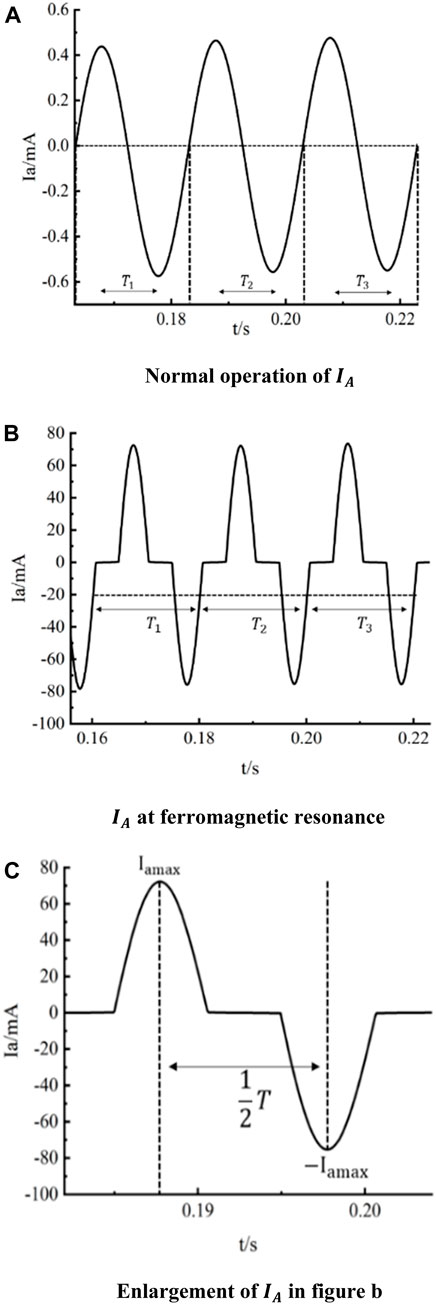
Figure 7. (A) Normal operation of
Change the positive and negative connections of the current source in order to change the positive and negative direction of the residual magnetism, the current source side circuit breaker BRK1 is disconnected after the system is stabilized, and at this time there is residual magnetism in the iron core.
When the current source side is disconnected and not working, the PT initially has no remanent magnetization, and the waveform of the A-phase current wave is shown in Figure 8. From the figure, it can be seen that when the PT ferromagnetic resonance occurs, the positive and negative pulses of the A-phase current wave are in the form of spikes symmetrical about the time axis and last for a long time, with a peak value of up to 90–100 mA, and the sustained high level of current is extremely easy to cause damage to the PT.
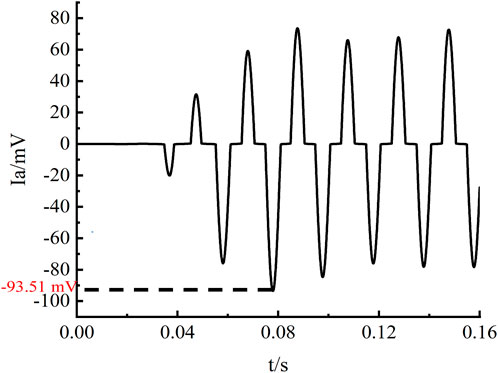
Figure 8. Waveform with no remanent magnetization.
When remanent magnetization is added to the PT, a remanent magnetization value of 0.4–0.9 pu is applied to the PT with a forward interval of 0.4–0.9 pu and a current interval of [3,26.1] mA, respectively, and the comparative changes of the current waveforms are shown in Figure 9. From Figure 9A, it can be seen that when the positive remanent magnetization is applied to the PT in the interval of 0.7 pu–0.9 pu, the current waveform is similar to that of a lightning wave, generating a huge instantaneous value of current in the first 0.1 s. The current is approximately linear with respect to time before reaching the peak value, and then decreases rapidly and tends to be flat after reaching the peak value. The larger the size of the applied remanent magnetization, the larger the instantaneous peak value of the current, and none of them is smaller than the ferromagnetic resonance inrush current when there is no remanent magnetization, and the final stabilized saturation current is between 20 and 30 mA; when the range of the positive remanent magnetization is applied to the PT is between 0.4 pu–0.7 pu, as shown in Figure 9B: 0.6 pu remanent magnetization is applied, and the current appears as an instantaneous value in the first 0.1 s, but at this time the instantaneous peak value is smaller than that when 0.7 pu remanent magnetization is applied. Peak value is smaller than the instantaneous peak value of the current when 0.7 pu remanence is applied, and it is also smaller than the inrush current of the ferromagnetic resonance when no remanence is applied, and the aberration occurs after 0.2 s instead of leveling off; when 0.4–0.5 pu remanence is applied, the instantaneous peak value of the current in the first 0.1 s disappears, and the whole tends to be leveled off, and the current magnitude is between 0 and 10 mA.
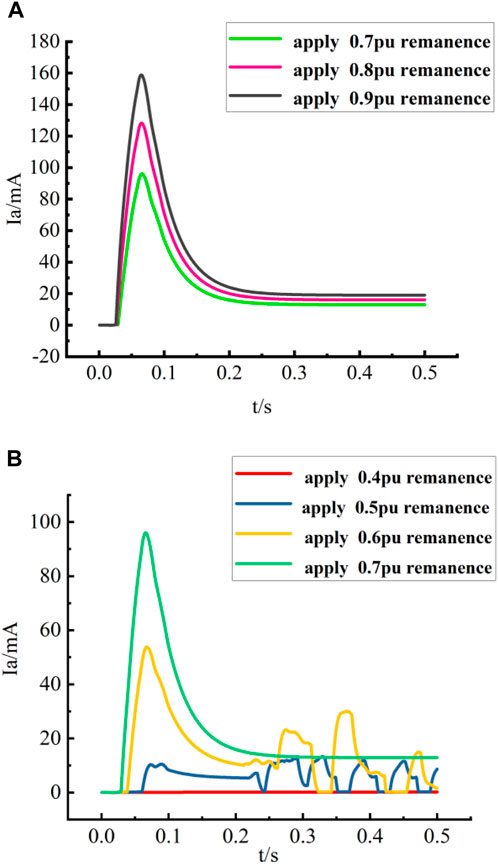
Figure 9. Waveforms of A-phase current of PT under different magnitudes of remanent magnetization in positive direction. (A) Waveforms of A-phase current of PT when the applied remanence size is 0.7 pu to 0.9 pu; (B) Waveforms of A-phase current of PT when the applied remanence size is 0.4 pu to 0.7 pu.
The waveform details of the above currents are shown in Figure 10. Figures 10B shows that when the applied remanent magnetization value is 0.6 pu, the A-phase current on the primary side of the voltage transformer has aberrations, with a peak value of about 55 mA; from (c) of Figure 10, it can be found that when the applied remanent magnetization value is 0.7 pu, although the current aberration disappears, the amplitude of the current at this time reaches 100 mA, which is close to twice the former value!, the excessive resonant inrush current will bring damage to the PT’s.
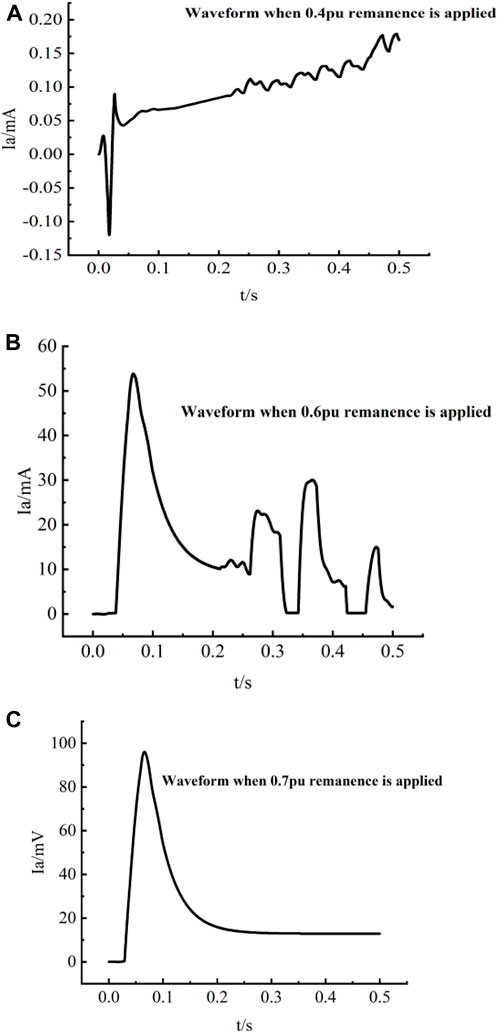
Figure 10. Detail of the waveform of Figure 9. (A) Waveform of A-phase current of PT when 0.4 pu remanence is applied; (B) Waveform of A-phase current of PT when 0.6 pu remanence is applied; (C) Waveform of A-phase current of PT when 0.7 pu remanence is applied.
In summary, when the direction of the remanent magnetization is positive, the remanent magnetization value is less than 0.6 pu on the ferromagnetic resonance overcurrent has a suppression effect, and the smaller the remanent magnetization is, the more obvious the suppression effect on the ferromagnetic resonance inrush current is, and when the value of the remanent magnetization is around 0.4 pu, the PT is already close to the normal operation state.
The positive and negative poles of the A-phase DC power supply connected to the PT are switched, and according to the relationship between the DC current and the magnitude of remanent magnetism in Table 4 above, a negative remanent magnetism value of 0.4–0.9 pu is applied to the PT with a current interval of [−26.1, −3] mA, and a comparative change graph of the A-phase current waveform is obtained. In order to make the results more observable, the contrast plots are divided into two groups, as shown in Figure 11.
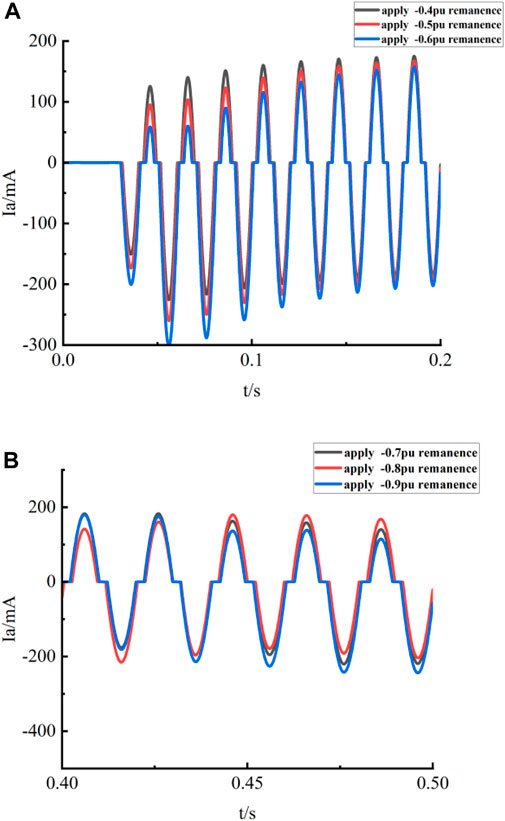
Figure 11. Waveforms of A-phase current of PT under different magnitudes of remanent magnetization in negative direction. (A) Waveforms of A-phase current of PT when the applied remanence size is −0.6 pu to −0.4 pu; (B) Waveforms of A-phase current of PT when the applied remanence size is −0.9 pu to −0.7 pu.
Simulation results show that, when the PT ferromagnetic resonance occurs, after applying remanent magnetization with negative direction and size of 0.4–0.9 pu to phase A, the waveform of
The voltage transformer in the full cable line is susceptible to ferromagnetic resonance due to certain operational reasons, which generates overcurrent and damages the safety of the equipment. This paper is based on the phenomenon that exists in the actual power system, when the current wave invades into the voltage transformer, residual magnetism will be left in the iron core, and the simulation is used to analyze the influence of residual magnetism in different sizes and directions on the ferromagnetic resonance, and the comparison of the obtained data, and ultimately, a method is found for realizing the effective suppression of the ferromagnetic resonance. The conclusions are as follows:
(1) When the system is subjected to a positive lightning intrusion wave, a positive remanent magnetization value of less than 0.6 pu can effectively suppress the ferromagnetic resonance inrush of the voltage transformer, and the smaller the remanent magnetization value, the better the suppression effect. The smaller the remanent magnetization value, the better the suppression effect. When the remanent magnetization value is 0.4 pu, the PT is close to the normal operation state.
(2) When the system is subjected to reverse lightning intrusion wave, the negative remanent magnetization cannot suppress the ferromagnetic resonance of the PT, but may exacerbate the inrush current, leading to more serious consequences.
In this paper, the range of remanent magnetism values that can effectively suppress PT ferromagnetic resonance in 10 kV all-cable lines is determined through simulation and analysis, which provides a reference for future research on methods of avoiding PT damage and gives future scholars a technical basis for optimizing the stability of power grids.
The raw data supporting the conclusion of this article will be made available by the authors, without undue reservation.
Written informed consent was obtained from the individual(s) for the publication of any potentially identifiable images or data included in this article.
HY: Project administration, Software, Writing–original draft. DS: Project administration, Writing–review and editing. LZ: Software, Writing–review and editing.
The author(s) declare that no financial support was received for the research, authorship, and/or publication of this article.
The authors declare that the research was conducted in the absence of any commercial or financial relationships that could be construed as a potential conflict of interest.
All claims expressed in this article are solely those of the authors and do not necessarily represent those of their affiliated organizations, or those of the publisher, the editors and the reviewers. Any product that may be evaluated in this article, or claim that may be made by its manufacturer, is not guaranteed or endorsed by the publisher.
Andrei, R. G., Halley, B. R., et al. (1989). Voltage transformer ferroresonance from an energy transfer standpoint. IEEE Trans. Power Deliv. 4 (3), 1773–1778. doi:10.1109/61.32672
Cao, W. B., Huang, X. M., Wang, S., Qiu, Y. T., Wen, M. H., and Yin, X. G. (2023). Inrush current imbalance analysis of transformer based on saturation depth dynamic phasor diagram. Power Syst. Prot. Control 51 (13), 139–147. doi:10.19783/j.cnki.pspc.202203
Chaolong, Z., Yigang, H., Bolun, D., Lanfang, Z., and Shan-he, J. (2020). Intelligent fault diagnosis method for power transformer based on deep learning. J. Elec. Meast. and Ins. (01), 81–89. doi:10.13382/j.jemi-B1902359
Chen, H., and Shuheng, T. (2023). Simulation analysis of ferromagnetic resonance of voltage transformer caused by asymmetric operation on hybrid line. High. Volt. Appar. 50 (3).
Chen, L., Minsheng, X., Chunxu, ZHENG, Gao, H., Fan, H., and Zhang, B. (2021). Analysis of operating characteristics of ground transformer under single-phase ground fault. Power Syst. Prot. Control 49 (12), 56–64. doi:10.19783/j.cnki.pspc.201028
Chen, Q., Peng, T., Kang, W., and He, G. (2024). Infrared detection of power mechanical equipment overheating fault based on feature fusion. Mach. Des. Manuf. (04), 337–341. doi:10.19356/j.cnki.1001-3997.2024.04.006
Chen, Y. (2022). Electrical test and relay protection of power transformer. Electron. Technol. Softw. Eng. (17), 115–118.
Fen-Yan, Y., and Bao, W. (2017). Transformer model considering hysteresis based on PSCADV4.6. Guangdong Electr. Power 30 (6), 67–72.
GBT (2015). Guidelines for energy efficiency evaluation of medium and low voltage distribution networks. GB/T 31367-2015.
GBT (2020). Transformers - Part 102: ferromagnetic resonance in substations with electromagnetic voltage transformers. GB/T 20840.92-2020.
Jin, J., Chun-En, F., Tian-Hui, L., and Feng-xiang, W. (2009). And simulation research of the remanence of transformer excitation inrush current. J. transformer 46-48 (11), 40–43. doi:10.19487/j.carol.carroll.nki.1001-8425.2009.11.010
Kulkarni, S., and Khaparde, S. (2004) Transformer engineering: design and practice [M]. New York. Basel: Marcel Dekke, r Inc.
Liu, H., Yinglong, D., Yinghui, H., Lixue, C., Xiaofei, L., and Hong, Y. (2024). Research on high precision voltage transformer based on high temperature superconductivity. Electr. Meas. Instrum. 61 (04), 48–55. doi:10.19753/j.issn1001-1390.2024.04.008
Liu, Ke (2024). Cause analysis and countermeasure of fault of middle joint of direct-buried collector line in wind farm. Public Electr. 39 (03), 55–56.
Ping, F., and Wang, E. (2004). Theoretical analysis of three-phase ferromagnetic resonance in neutral grounded power system. Trans. China Electrotech. Soc. 19 (9), 57–61. doi:10.19595/j.cnki.1000-6753.tces.2004.09.011
Quan, W., and Li, W. (2022). Analysis and countermeasures of ferromagnetic resonance of voltage transformer in a power plant. Hydropower Pumped Storage 8 (01), 35–39.
SA (2021). Instrument transformers, Part 102: ferroresonance oscillations in substations with inductive voltage transformers (IEC TR 61869-102:2014 (ED 1.0) MOD). SA TR 61869.102:2021.
Tian, Y., Chen, H. Y., Que, Y. B., Mu, Y. K., Gao, T., Wang, G. Q., et al. (2024). Research on magnetic analysis method of pipeline force Based on Improved JA Model. J. Harbin Univ. Sci. Technol. 1-9.
Vecchio, R. M. D., and Poulin, B. (2010). Transformer design principles: with applications to core-form power transformers. Boca Raton, Florida, United States: CRC Press.
Wang, J. (2021). Simulation and analysis of ferromagnetic resonance in 110kV substation based on PSCAD. Shenyang, China: Shenyang university of technology. doi:10.27322/.dc.nki.Gsgyu.2021.000186
Wang, S., Wang, X., Xia, Y., He, X., and Wu, T. (2022). Research on ferromagnetic resonance characteristics and Identification of PT in distribution network switch under non-outage operation. Power Grid Technol. 46 (11), 4534–4540. doi:10.13335/j.1000-3673.pst.2022.0205
Xuyang, Li, Dong, X., and Zhiqian, Bo (2011). Research on ferroresonance detection method of power transformer. Power Syst. Prot. Control (9), 102–107.
Yang, J., Yan, H. U., and Wang, J. (2022). Ferromagnetic resonance analysis and suppression of 110kV substation. Transformers 59 (2), 19–23. doi:10.19487/j.cnki.1001-8425.2022.02.010
Yaohua, H. A. O., Cao, B., Wang, W., Feng, Y., and Chen, J. (2019). Simulation and application of series compensation capacitor on ferroresonance overvoltage based on PSCAD/EMTDC. High. Volt. Electr. Appar. 55 (12), 205–210. (in Chinese). doi:10.13296/j.1001-1609.hva.2019.12.030
Yuan, W., Mengying, G., and Yuan, J. (2022). Method of Reducing transformer remanence by changing external Circuit Capacitance. Proc. CSEE 42 (8), 2997–3004. doi:10.13334/j.0258-8013.pcsee.220535
Zhang, H., and Junhua, Li (2011). Simulation Analysis of insurge current in single-phase Transformer based on PSCAD. J. North China Inst. Water Resour. Electr. Power (6), 73–75. doi:10.19760/j.ncwu.zk.2011.06.021
Zhang, X., and Wen, Y. (2009). Research on PT ferroresonance overvoltage and detuning device in power distribution system. J. Chizhou Univ. 23 (03), 51–53.
Zhao, H. (2018). Causes and elimination methods of ferroresonance overvoltage in power system. South. Agric. Mach. 49 (18), 145.
Zhao, Z. (2020). Transformer core remanence testing and weaken. Hebei: Hebei university of technology. doi:10.27105/dc.nki.Ghbgu.2020.000462
Zheng, J., Sheng, Y., Su, X., Li, G., Ren, M., Ma, X., et al. (2024). Research on ground potential rise and overvoltage of sheath power frequency in high voltage single core cable under ground fault. Electr. porcelain arrester (02), 98–105. doi:10.16188/j.isa.1003-8337.2024.02.013
Keywords: all-cable line, ferromagnetic resonance, voltage transformer, lightning incursion wave, residual magnetism
Citation: Yonghao H, Shuheng D and Zhiyuan L (2024) Study on the optimum value of remanent magnetism for suppressing ferromagnetic resonance of voltage transformer in all-cable line. Front. Energy Res. 12:1408924. doi: 10.3389/fenrg.2024.1408924
Received: 29 March 2024; Accepted: 29 May 2024;
Published: 20 June 2024.
Edited by:
Chaolong Zhang, Jinling Institute of Technology, ChinaReviewed by:
Suwarno Suwarno, Bandung Institute of Technology, IndonesiaCopyright © 2024 Yonghao, Shuheng and Zhiyuan. This is an open-access article distributed under the terms of the Creative Commons Attribution License (CC BY). The use, distribution or reproduction in other forums is permitted, provided the original author(s) and the copyright owner(s) are credited and that the original publication in this journal is cited, in accordance with accepted academic practice. No use, distribution or reproduction is permitted which does not comply with these terms.
*Correspondence: Huang Yonghao, aHVhbmd5b25naGFvMDMyN0AxNjMuY29t
Disclaimer: All claims expressed in this article are solely those of the authors and do not necessarily represent those of their affiliated organizations, or those of the publisher, the editors and the reviewers. Any product that may be evaluated in this article or claim that may be made by its manufacturer is not guaranteed or endorsed by the publisher.
Research integrity at Frontiers
Learn more about the work of our research integrity team to safeguard the quality of each article we publish.