
95% of researchers rate our articles as excellent or good
Learn more about the work of our research integrity team to safeguard the quality of each article we publish.
Find out more
METHODS article
Front. Energy Res. , 07 June 2024
Sec. Nuclear Energy
Volume 12 - 2024 | https://doi.org/10.3389/fenrg.2024.1407170
This article is part of the Research Topic Novel Nuclear Reactors and Research Reactors View all 11 articles
 Huaiming Cui
 Zhiyun Cai*
In the Hualong-1 Unit (HPR1000), the hydrogen (H2) concentration should be reduced to 15 mL (STP)/kg 24 h before reactor shutdown when the reactor vessel is scheduled to be opened. The traditional degassing method, i.e., letting down the reactor coolant through a chemical and volume control system, will take longer, and its operation is more complicated. To shorten the degassing time and simplify the operation, this paper proposes a pressurizer degassing system design for HPR1000 by applying the pressurizer as thermal degassing equipment. Then, the degassing system optimization analysis is carried out under a full range of steady operating conditions during shutdown, and the optimal size of the flow-limiting orifice plate is obtained. Meanwhile, in order to verify the transient characteristic during the degassing process to ensure operating safety, a dedicated transient degassing program based on an improved non-equilibrium multi-region pressurizer model and a transient degassing model is used to carry out a transient simulation analysis of this process. The transient simulation results show that, under bounding conditions of hot–zero-power operation, during the degassing process, the pressure of the pressurizer decreases by a maximum of 0.038 MPa and the water level increases by 0.016 m above the normal level. As can be seen, both the pressure and water level are within the normal operation band and shall not initiate any safety signal. Meanwhile, the entire transient process lasts approximately 24 min and then enters a stable degassing period. It takes approximately 5.2 h to remove the gas dissolved in the reactor coolant from 35 mL (STP)/kg to 15 mL (STP)/kg. The analysis shows that the pressurizer degassing system designed for HPR1000 is safe, effective, and reliable.
The Hualong-1 Unit (HPR1000) is a third-generation nuclear power plant that is completely self-developed and designed by China using the highest international safety standards. It innovatively puts forward the safety concept of “active and passive safety,” provides comprehensive measures for serious accident prevention and mitigation, and fully absorbs the experience feedback from the Fukushima accident. It has a core damage frequency (CDF) ≤10−6/reactor·year and a large release frequency (LRF) ≤10−7/reactor⋅year.
The HPR1000 reactor cooling system (RCS) consists of three parallel heat transfer loops, each with a reactor coolant pump, a steam generator, and associated pipes and valves. In addition, the RCS includes a pressurizer, a corresponding pressurizer spray subsystem, and an electric heating subsystem to control the pressure of the pressurizer. A 3D diagram of the HPR1000 RCS is shown in Figure 1.
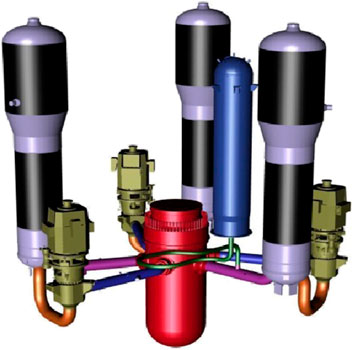
Figure 1. Three-dimensional (3D) diagram of the HPR1000 RCS.
The traditional degassing method is used to let down the reactor coolant through the chemical and volume control system under water–solid conditions. Engineering experience has shown that this traditional method is very complex and time-consuming.
To shorten the degassing time and simplify the operation, this paper proposes a pressurizer degassing system design for HPR1000 by applying the pressurizer as thermal degassing equipment. The pressurizer degassing system flow diagram is shown in Figure 2. The degassing pipeline of the pressurizer degassing system is connected to the pressurizer safety valve impulse pipeline, and a flow-limiting orifice plate is installed at the entrance of the degassing pipeline to limit the degassing flow. The degassing valve is selected as a remotely controlled, air-operated valve. During shutdown operation, when RCS degassing is required, the operator can manually open the degassing valve and modulate the spray-valve opening to adjust the charge/let-down flow rate according to the specific degassing procedure to degas the RCS continuously. The radioactive waste gas discharged from the RCS is then led into the radioactive gas treating system.
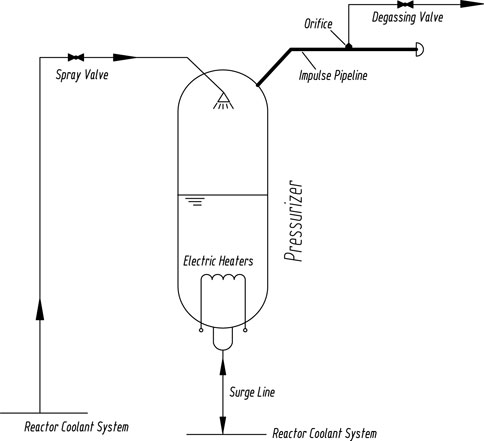
Figure 2. Schematic diagram of the HPR1000 regulator degassing system.
The principle for the degassing process is as follows.
First, the reactor coolant is pumped into the pressurizer vapor space through a pressurizer spray system by the reactor coolant pump (RCP). Since the concentration of non-condensing gas in the spray liquid is much higher than the equilibrium concentration of steam in the pressurizer vapor space, the non-condensing gas will then migrate from the spray liquid into the pressurizer vapor space. Therefore, the gas partial pressure of the pressurizer vapor space will increase. At the same time, mass exchange and gas migration occur continuously between the pressurizer vapor space and liquid space until the two-phase system achieves a new equilibrium. Then, the degassing valve is opened to discharge the pressurizer steam, whose gas partial pressure is increased, and the electric heater is put on to supplement the discharged gas and the lost heat, by which the pressure of the pressurizer and the corresponding saturation temperature are maintained within the allowed range. Repeating the above process can achieve the purpose of reducing the concentration of non-condensing gas in the primary coolant.
The pressurizer degassing system design can maximize the use of the pressurizer and is consistent with the principles of simplicity and economy for a small module reactor. At the same time, a reasonable system design can make degassing more efficient, the degassing time shorter, and operation safer. In this paper, the optimal system design of HPR1000 is first obtained by using the verified steady-state pressurizer degassing model and optimization algorithm. Then, to verify the safety of the optimized system design, a transient analysis of the process when opening the degassing valve is simulated based on the verified transient pressurizer model to ensure that the pressure and water level in the pressurizer do not fluctuate significantly to activate the safety protection device. The paper is structured as follows: Section 1 is the introduction; Section 2 provides the mathematical models for the steady-state and transient analysis of HPR1000; Section 3 describes the degassing system of HPR1000; and Section 4 provides the results and discussion.
The degassing process is based on solution and mitigation theory, which can be described by Henry’s Law (Henry, 1803). A typical pressurizer degassing model is shown in Figure 3.
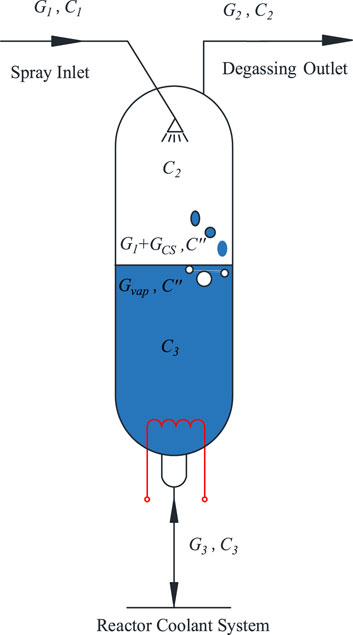
Figure 3. Degassing flow diagram.
In the figure, C1, C2, C3, C′, and C″ are the concentrations of non-condensable gas in the spray flow, discharging flow, coolant return from the surge line to the reactor loop, and evaporative gas in the pressurizer, respectively; G1, G2, G3, Gcs, and Gvap are the corresponding mass flows.
Caldwell (1956) proposes a calculation model for steady-state hydrogen (H2) removal efficiency for the pressurizer. Zhong et al. (2018) proposed a more accurate steady-state degassing model for the pressurizer, which can be used as the basis for theoretical research on degassing.
Based on the study by Zhong et al. (2018), the equation for the concentration of non-condensable gas in the pressurizer vs time is
where ε is the degassing efficiency.
Using this formula, the degassing time to reach a certain degassing concentration and the degassing concentration change curve in the coolant can be calculated under a given degassing efficiency.
The degassing efficiency can be influenced by different inherent characteristics of the pressurizer, degassing operating conditions, degassing flow rate, and degassing type. To obtain the optimal system design, a verified steady-state degassing optimization algorithm (Zhong et al., 2018) is adopted in this paper, and its main ideas are as follows.
The degassing period Td (Zhong et al., 2018) is defined as
where Td represents the time taken for the concentration of the non-condensable gas in the reactor coolant to decrease to 1/e of the initial concentration, reflecting the length of degassing time, and, therefore, serves as an objective function.
To ensure the smooth operation of the degassing process, there are two constraints (Zhong et al., 2018):
1) The discharging flow rate must be less than the spray flow.
2) The electric heater cannot be overloaded and has a maximum limit value.
Based on the constraints, the feasible region of the optimization objective is a linear constraint set, as shown in Figure 4 (Zhong et al., 2018). Since Td (G1, G2) is a nonlinear function of G1 and G2, the optimization problem is a convex optimization problem.
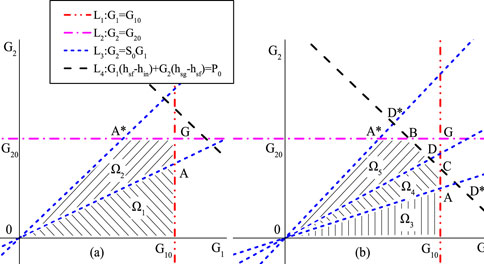
Figure 4. Optimization algorithm diagram (Zhong et al., 2018).
The feasible region boundary in the figure above consists of four constraint lines, namely, L1: G1 = G10, representing the maximum spray flow constraint line; L2: G2 = G20, indicating the maximum discharging flow constraint line; L3: G2 = S0G1, which is the spray flow constraint line; and L4: G1 (hsf-hin)+G2 (hsg-hsf) = P0, representing the electric heating power constraint line. Here, hsf is the enthalpy of saturated water, hsg is the enthalpy of saturated steam, and hin is the enthalpy of spray flow.
Typical pressure-level response models for pressurizer simulation include the non-equilibrium two-region model, the non-equilibrium tri-region model, and the non-equilibrium multi-region model. The two-region model was first proposed by Redfield and Margolis (Gunther and Kreith, 1950; Redfield et al., 1968; Nahavandi and Makkenchery, 1970; Baron, 1973; Kim et al., 2006). In this model, thermal stratification will be induced when cold water enters the pressurizer, which will affect its accuracy. The tri-region model was proposed first by Baggoura, Martin, and Baek (Abdallah et al., 1982), which divides the entire pressurizer into three regions, namely, vapor region, water region, and surge region. Since this model does not clearly define the surge region, the initial volume is uncertain, and the dividing coefficient is also hard to determine, which is critical to the simulation accuracy.
The non-equilibrium multi-region model divides the entire pressurizer into three main regions (vapor region, liquid region, and saturated region), and each region is further subdivided into a number of control volumes, as shown in Figure 5. The mass and energy-exchanging processes can be more precisely simulated through this model, and it can overcome the problems that exist in two-region and tri-region models. Based on the multi-region model, an improved non-equilibrium multi-region model was proposed by Zhong et al. (2019), which is more applicable to the pressurizer degassing transient simulation analysis.
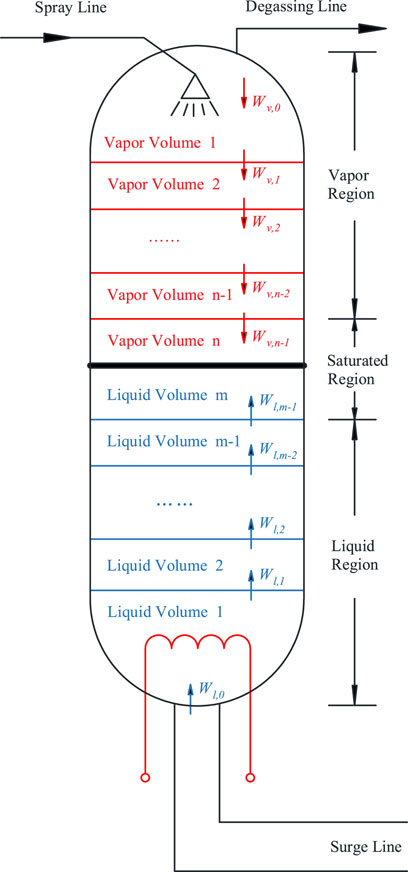
Figure 5. Multi-region non-equilibrium model.
From mass conservation and energy conservation, for liquid region i (i = 1,2, … ,m-1),
where p is the RCS pressure, Pa; VL is the pressurizer volume, m3; Wx,i(x = 1,v) represents the mass flow rate between control volume i and i+1, kg/s;
For vapor region i (i = 1,2, … ,n-1),
where VT is the pressurizer volume, m3; Wbc,v,i is the condensate flow rate of volume i, kg/s; and Wsc,v,i is the spray flow rate of volume i, kg/s. For the saturated region,
where Wbe,sum represents the total flashing flow rate entering the vapor region from the liquid region, kg/s. Wbe,sum represents the total condensate flow rate entering the saturated region from the vapor region, kg/s, volume i and i+1, kg/s; Wsp is the pressurizer spray flow rate; and Wsc,sum is the total spray droplet flow rate, kg/s.
During the pressurizer degassing process, two physical phenomena occur. One is flashing and steam condensation, while the other is spray condensation.
The flashing process occurring in the liquid region can be described as the process in which bubbles form and rise from the liquid region; the steam condensation process occurs when the droplets in the vapor region fall into the liquid region. Then, the flashing flow rate for volume i (i = 1, 2, … , m-1) in the liquid region is
where Vbr is the bubble rising speed, m/s, which can be obtained by the Gunther–Kreith correlation (Gunther and Kreith, 1950).
Furthermore, the steam condensation flow rate for volume i (i = 1, 2, … , n-1) in the vapor region is
where Vcf is an experienced constant.
The homogeneous flow model is applied to both vapor and liquid regions; then,
The spray condensation process occurs when the spray droplets condense the surrounding steam as they fall, and then the condensates enter the saturated region. From energy conservation, the total condensation flow rate is
where hsp is the enthalpy of the entrance spray liquid, J/kg.
During the degassing process, the pressure and water level in the pressurizer will fluctuate as the degassing valve opens, which can, in turn, affect the degassing efficiency. Thus, a pressurizer degassing transient model is required to simulate this process.
A lumped parameter method is applied in establishing the transient degassing model (Zhong et al., 2021), as shown in Figure 6.
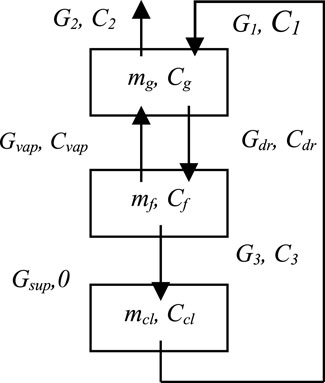
Figure 6. Degassing transient model diagram.
From mass conservation,
where mcl is the total mass of the RCS coolant, kg; Ccl is the gas concentration dissolved in the RCS coolant, kg/kg (H2O); and Gsup is the makeup flow rate, kg/s.
For the gas concentration of the interface between the vapor and liquid regions,
where Ki is the Henry coefficient, which is the function of the saturated pressure p.
Before this model can be used to calculate the transient of the gas concentration of the pressurizer and the primary coolant, it is necessary to obtain the values of the thermal–hydraulic physical quantities of the pressurizer, such as pressure, mass, and mass flow rate. In this paper, the thermal–hydrodynamic calculations are given to the model proposed in Section 2.3, and then the calculated values are passed to this model to calculate the gas concentration. Zhong et al. (2021) provides the specific computational framework.
The optimal size of the flow-restricting office is calculated using the degassing optimization algorithm presented in Section 2.2. Seven pressure plateaus during plant shutdown operation are selected for the optimization calculation of pressurizer degassing (15.5 MPa–2.6 MPa [pressure of the steam bubble collapsed]), and the corresponding spray inlet temperature is the highest temperature allowed for each operating condition to maximize the degassing efficiency (Zhong et al., 2018). The available power of pressurizer electric heaters is 0–100%, and the maximum ratio of gas discharging flow to spray flow is set to be 1.0.
Based on the boundaries and conditions described above, the calculated results are shown in Table 1:
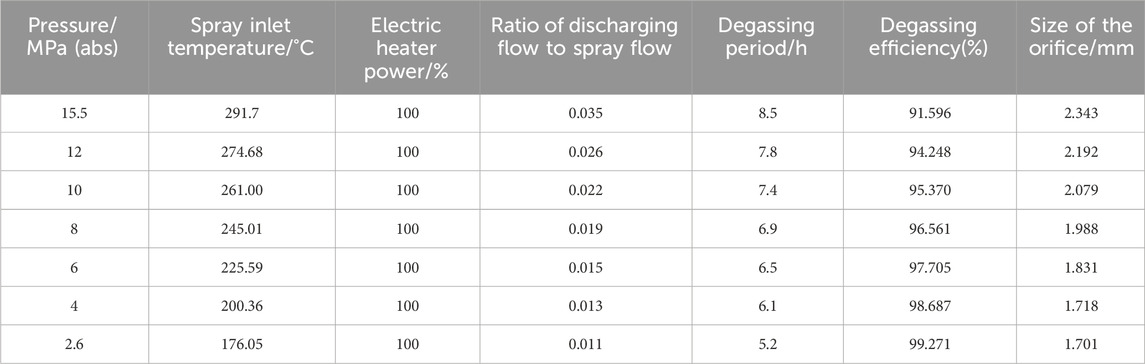
Table 1. Optimization calculation results.
As shown in the optimization calculation results, the size of the flow-limiting orifice plate is in the range of 1.701 mm–2.343 mm. The larger the size of the flow-limiting orifice plate, the greater the system pressure fluctuations when the degassing valve is opened, especially under the high-pressure plateau. At the same time, for the low-pressure plateau, a larger flow-limiting orifice plate means more heat loss and a lower ratio of discharging and spray flow.
After comparative analysis, the size of the flow-limiting orifice plate is selected to be 1.7 mm. This selection not only ensures the stability of the system pressure fluctuations but also takes into account the degassing efficiency of the low-pressure plateau.
After using the 1.7-mm flow-limiting orifice plate. the hydrogen concentration vs. time curves when degassing at different pressure and temperature plateaus can be calculated using Equation 1, and the results are shown in Figure 7.
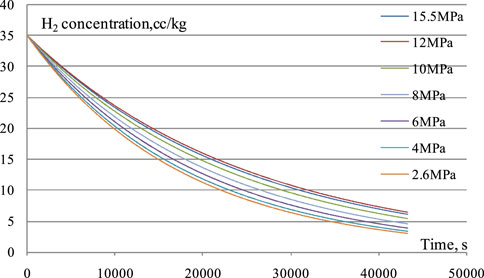
Figure 7. Hydrogen concentration vs. time curves.
As shown in the figure, the lower the degassing pressure, the higher the degassing efficiency, and the shorter the degassing time required. The degassing time is shortest at the 2.6-MPa plateau, and it takes approximately 5.2 h to remove the gas dissolved in the reactor coolant from 35 mL (STP)/kg to 15 mL (STP)/kg.
Although the RCS can be degassed at any shutdown plateau, the bounding condition is the hot–zero-power operation. Prior to opening the degassing valve, the operator energizes all the pressurizer heaters and places the spray valve in automatic control mode, according to the operating procedure. When the plant enters a stable condition approximately 200 s later, the operator opens the degassing valve. Therefore, the initial condition parameters can be easily calculated through heat balance (see Table 2).

Table 2. Degassing transient initial condition.
Boundary conditions are as follows:
i. Spray valve
The spray valve is placed into automatic control mode, whose opening is a function of the pressure difference between the measured pressure and the set pressure (see Figure 8).
ii. Surge line
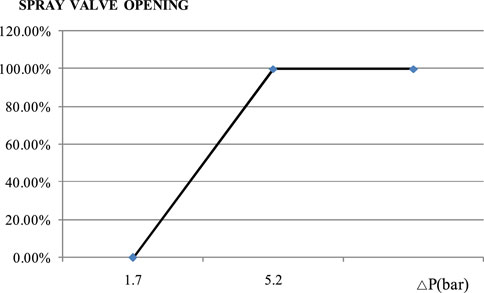
Figure 8. Opening of the spray valve vs. pressure difference.
The in-surge or out-surge flow rate in the surge line will vary with the spray flow and the thermal expansion of the RCS automatically.
iii. Electrical heaters
All the electrical heaters are energized according to the operating procedure and the optimized calculation result.
iv. Degassing valve
The degassing valve will be fully open at 200 s, and the flow will be limited by the downstream orifice plate with a size of 1.7 mm.
Transient simulation analysis is conducted using the improved non-equilibrium multi-region pressurizer model described in Section 2.3. The total simulation time is set at 3,000 s, and the time step is set to 0.1 s. By repeated trial calculation, when the grid number of the liquid region and vapor region reaches 300, a grid-independent solution can be obtained.
The degassing valve is opened 200 s later, and then the RCS begins to degas the hydrogen. In the degassing transient, the pressure and the spray flow versus time curves are given in Figure 9 and Figure 10, respectively.
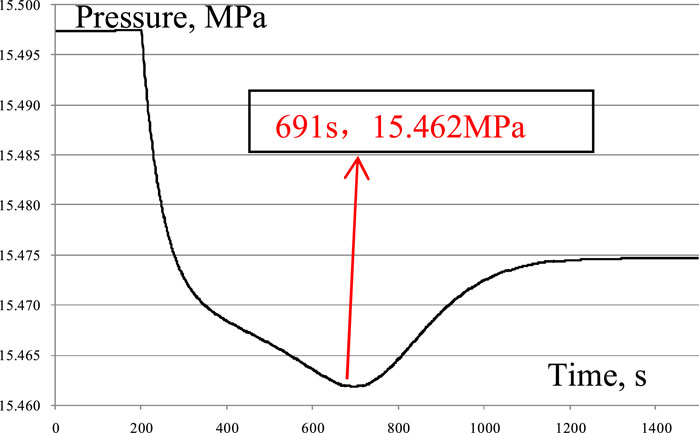
Figure 9. Pressure transient curve.
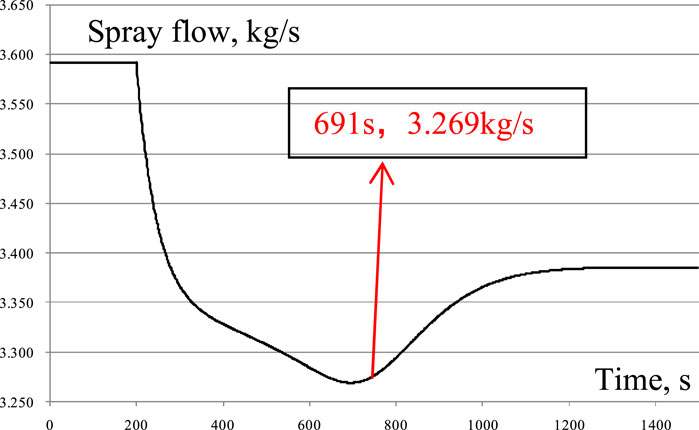
Figure 10. Spray flow-rate transient curve.
From these two transient curves, at the moment of the degassing valve being opened, the pressure decreases rapidly, which will cause the control system to reduce the spray valve opening automatically; thus, the spray flow rate decreases quickly. However, at 263 s, since the spray flow, heater power, and degassing flow reach a heat-balance state gradually, the pressure and spray flow begin to decrease more slowly and eventually arrive at the lowest point at 691 s, with a pressure of 15.462 MPa and a spray flow rate of 3.269 kg/s. Then, the pressure begins to increase, and the spray flow starts to increase. After 1,230 s, the pressure reaches a stable value, which means that the degassing process enters the steady degassing condition.
The water level in the pressurizer is shown in Figure 11. In order to show more details, the section from 100 s to 300 s of the curve is partially enlarged (see Figure 12). As shown in Figure 11, the water level does not change a lot due to opening the degassing valve. The eventual stable level is 3.421 m. From Figure 12, the partially enlarged water-level curve shows that, at the moment of opening the degassing valve, the water level increases to 3.607 m, which is because the condensation droplets in the vapor region increase quickly due to the pressure decreasing rapidly at this moment.
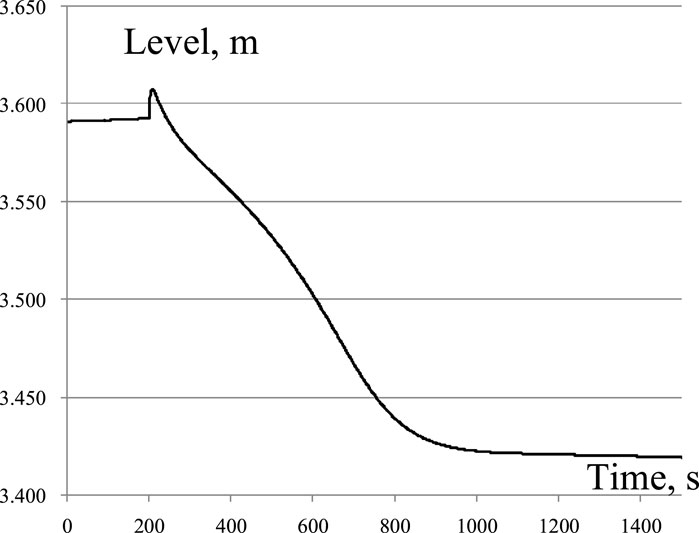
Figure 11. Water-level transient curve.

Figure 12. Partially enlarged water-level transient curve.
It can be seen that the HPR1000 regulator degassing system designed in this paper is stable and controllable in the transient process of degassing when opening the exhaust valve, and degassing is safe and effective and meets the safety design requirements.
To reduce the time taken to reduce the H2 concentration from 35 mL (STP)/kg to 15 mL (STP)/kg, this paper designs a pressurizer degassing system by applying the pressurizer as thermal degassing equipment. Then, an optimization analysis is carried out under a full range of shutdown conditions, and the optimal size of the flow-limiting orifice plate is obtained.
Based on the optimal system design, the degassing steady analysis is performed for different degassing pressure plateaus. The analysis results show that the entire degassing process can be completed in as quickly as approximately 5.2 h, which shows a big advantage over the traditional degassing method, which removes non-condensable gas by letting down the reactor coolant to the chemical and volume control system.
To verify the safety features of the pressurizer degassing system designed for HPR1000, this paper performs an analysis of the transient when the degassing valve is opened with a dedicated computer application, which is developed based on the non-equilibrium multi-region model and pressurizer degassing transient model. Simulation results show that the pressure and water level in the pressurizer are within the normal operation band and will not initiate any safeguard signal and also have no effect on the degassing efficiency.
In conclusion, the pressurizer degassing system designed in HPR1000 is reasonable, feasible, safe, effective, and reliable.
The original contributions presented in the study are included in the article/Supplementary Material; further inquiries can be directed to the corresponding author.
HC: conceptualization, data curation, formal analysis, funding acquisition, investigation, methodology, project administration, resources, software, supervision, validation, visualization, writing–original draft, and writing–review and editing. ZC: writing–original draft and writing–review and editing.
The author(s) declare that no financial support was received for the research, authorship, and/or publication of this article.
The authors declare that the research was conducted in the absence of any commercial or financial relationships that could be construed as a potential conflict of interest.
All claims expressed in this article are solely those of the authors and do not necessarily represent those of their affiliated organizations, or those of the publisher, the editors, and the reviewers. Any product that may be evaluated in this article, or claim that may be made by its manufacturer, is not guaranteed or endorsed by the publisher.
Abdallah, A. M., Mariy, A. H., Rabie, M. A., and Nagy, M. E. (1982). Pressurizer transients dynamic model. Nucl. Eng. Des. 73 (3), 447–453. doi:10.1016/0029-5493(82)90018-8
Baggoura, B., and Martin, W. R. (1983). Transient analysis of the three Mile island unit 2 pressurizer system. Nucl. Technol. 62 (2), 159–171. doi:10.13182/nt83-a33215
Baron, R. C. (1973). Digital model simulation of a nuclear pressurizer. Nucl. Sci. Eng. 52 (3), 283–291. doi:10.13182/nse73-a19475
Caldwell, C. S. (1956) “RESULTS OF BETTIS TEST FACILITY HYDROGEN DEGASIFICATION TEST,” in BTF special test No. 4[R]. Westinghouse electric corp. Pittsburgh: Atomic Power Div.
Gramer, G., and Korn, R. (1974). Thermal degassing of the primary coolant of nuclear reactors. U.S. Pat. 3 (789), 577.
Gunther, F. C., and Kreith, F. (1950) Progress report. California: Jet Propulsion Laboratory, California Institute of Technology.
Henry, W. (1803). Experiments on the quantity of gases absorbed by water, at different temperatures, and under different pressures. Philosophical Trans. R. Soc. Lond. (93), 29–276.
Kim, T. W., Kim, J. W., and Park, G. C. (2006). Development of non-equilibrium pressurizer model with non-condensable gas. Nucl. Eng. Des. 236 (4), 375–384. doi:10.1016/j.nucengdes.2005.09.003
Nahavandi, A. N., and Makkenchery, S. (1970). An improved pressurizer model with bubble rise and condensate drop dynamics. Nucl. Eng. Des. 12 (2), 135–147. doi:10.1016/0029-5493(70)90002-6
Redfield, J. A., Prescop, V., and Margolis, S. G. (1968). Pressurizer performance during loss-of-load tests at Shippingport: analysis and test. Nucl. Appl. 4 (3), 173–181. doi:10.13182/nt68-a26382
Zhong, X., Yu, J., Zhang, X., Saeed, M., Li, Y., Chen, Z., et al. (2021). Development of a lumped parameter dynamic degassing model for spray-heating degasser and its application in the pressurizer of a pressurized water reactor. Nucl. Technol. 207 (2), 228–246. doi:10.1080/00295450.2020.1763097
Zhong, X., Yu, J., Guo, X., and Saeed, M. (2018). Analysis of degassing time of pressurized water reactor pressurizer. Nucl. Eng. Des. 328, 301–308. doi:10.1016/j.nucengdes.2018.01.023
Keywords: pressurizer degassing, Hualong-1 Unit, non-equilibrium multi-region model, degassing transient, degassing optimizer, system design
Citation: Cui H and Cai Z (2024) HPR1000 pressurizer degassing system design and analysis. Front. Energy Res. 12:1407170. doi: 10.3389/fenrg.2024.1407170
Received: 26 March 2024; Accepted: 10 May 2024;
Published: 07 June 2024.
Edited by:
Jiankai Yu, Massachusetts Institute of Technology, United StatesReviewed by:
Wei Li, Xi’an Jiaotong University, ChinaCopyright © 2024 Cui and Cai. This is an open-access article distributed under the terms of the Creative Commons Attribution License (CC BY). The use, distribution or reproduction in other forums is permitted, provided the original author(s) and the copyright owner(s) are credited and that the original publication in this journal is cited, in accordance with accepted academic practice. No use, distribution or reproduction is permitted which does not comply with these terms.
*Correspondence: Zhiyun Cai, MTgyMDA1MjIwMTFAMTYzLmNvbQ==
Disclaimer: All claims expressed in this article are solely those of the authors and do not necessarily represent those of their affiliated organizations, or those of the publisher, the editors and the reviewers. Any product that may be evaluated in this article or claim that may be made by its manufacturer is not guaranteed or endorsed by the publisher.
Research integrity at Frontiers
Learn more about the work of our research integrity team to safeguard the quality of each article we publish.