 Ayman Aljarbouh
 Dmytro Zubov
 Issam A. R. Moghrabi
- Department of Computer Science, University of Central Asia, Naryn, Kyrgyzstan
The Rockaways Peninsula faces issues related to congestion and power outages during times of peak usage. Additionally, it is susceptible to disruptions caused by disasters such as hurricanes and storms. In this paper, we propose a new methodology that employs multi-paradigm modelling and control for the design and implementation of interconnected microgrid systems in the Rockaways. Microgrids are small-scale power networks that incorporate renewable energy technologies for power generation and distribution to enhance the control of energy supply and demand. Multi-paradigm modelling is employed to describe microgrids’ dynamic behavior more accurately by integrating system dynamics, agent-based modelling, as well as discrete event and continuous time simulation. We use agent-based models to describe the behavior of separate microgrid elements and the microgrid as a whole. Discrete event/continuous time simulation is used to analyze real-time operation of electrical parameters, such as voltage, current and frequency. Thus, the design, analysis and performance of microgrids are improved. Also, control strategies are used for the purpose of enabling the microgrids to operate effectively by responding to changes in power supply and demand and minimizing the effects of disturbances. The findings of this study demonstrate the feasibility and resilience benefits of incorporating multi-paradigm modelling and control in the design and management of microgrid systems in the Rockaways, which can result in the development of more durable, efficient, and sustainable energy systems in the region.
1 Introduction
Electrical power networks play a crucial role in ensuring a consistent and uninterrupted flow of electricity to consumers even during disruptions. However, such networks are susceptible to power outages caused by many factors, such as overloaded transmission lines, malfunctioning control systems, lightning strikes on power system equipment, inadequate maintenance, human error, voltage dips, faulty equipment, cyber-attacks, or sudden drops in frequency. Since 2010, numerous power disruptions have resulted in millions of people experiencing blackout hours. Below are a few examples of such power outages:
• On 8 September 2011, a power outage in the Pacific Southwest, lasting approximately 12 h, affected 2.7 million people across San Diego, California, Arizona, and Mexico (Wu et al., 2017). The outage occurred when a critical transmission line failed during peak demand, leading to a system-wide failure. San Diego was plunged into complete darkness, and analyses in subsequent studies (Haes Alhelou et al., 2019) indicated that insufficient load shedding played a significant role in the cascading effects of the outage.
• On 4 February 2011, Brazil’s electrical grid suffered a 16-h blackout caused by issues with transmission lines, affecting nearly 53 million customers directly.
• On 30 July 2012, the northern and eastern regions of India were hit by a blackout that lasted approximately 15 h, impacting nearly 620 million people. The outage was triggered when one of the two Gwalior-Bina transmission lines became overloaded, while the other was offline for maintenance. The following day, the system failed once more due to a mismatch between energy demand and supply, resulting in a loss of 32 GW of power for 700 million people. This incident is recorded as the largest blackout in history by the population affected.
• On 22 May 2013, power outages struck Vietnam’s northern and southern regions due to a wire tripping. Additionally, in the same year, the Philippines experienced significant power disruptions when 14 power plants were shut down, leaving Manila, the nation’s capital, and approximately 40% of Luzon Island without electricity (Ashok et al., 2021). The outages were caused by transmission lines and generators tripping, leading to a decrease in system voltage.
• On 1 November 2014, Bangladesh experienced a near 24-h shutdown of its electrical grid, initiated by an unplanned outage at a high voltage direct current (HVDC) station. The absence of active spinning reserves and the poor maintenance of certain generators exacerbated the issue. Despite the activation of all under-frequency load shedding (UFLS) phases, the load shedding executed was insufficient to counterbalance the disturbance, resulting in a widespread blackout. In (Papic et al., 2011), it was suggested that the Bulk Power System (BPS) load-shedding capabilities be improved to better handle future power outages. The disruption resulted in up to 150 million people losing electricity access.
• On 26 January 2015, a technical malfunction at a power facility in Sindh led to approximately 140 million people in Pakistan experiencing a loss of electricity (Defense Technical Information Center, 2023).
• On 31 March 2016, a breakdown of the electricity grid in Turkey resulted in nearly 70 million people being left without power. Notably, the disruption did not impact areas connected to Iran’s electrical grid, such as Hakkari and Van (Gurcan, 2015; Sharma et al., 2021).
• On 7 June 2016, an incident at the Gitaru hydropower station triggered the transformer to trip, resulting in a loss of 180 MW of power. This incident left approximately 10 million people in Kenya without electricity for over 4 h. The initial event set off a chain of unplanned occurrences that ultimately brought the system to a halt.
This study aims to address the issue of power outages in the Rockaway Peninsula, a region particularly prone to electricity disruptions caused by storms and natural disasters (Pekovic et al., 2007; Mortensen et al., 2009; Kunz et al., 2013). Many research studies have investigated strategies to mitigate the impacts of such outages. The study in (Boujoudar et al., 2023) suggested that community resilience can be enhanced through a matrix approach which includes defining system boundaries and threats, identifying critical functions, and selecting indicators to generate resilience scores. This approach allows the communities to assess their resilience to different types of disasters, including power outages, and identify the areas of improvement. Specifically, the study in (Albarakati et al., 2022) argues that building design is an important factor in reducing the effects of power outages. Building design can improve a facility’s capacity to incorporate solar and other sustainable energy production methods and effectively reduce the negative influence of central power interruptions. Adaptation methods include both simple, low-tech interventions and advanced and complex strategies that require careful planning; both help to reduce vulnerability and adjust to changes induced by climate-related power interruptions. For instance, a high-performance building design can extend the time a building can operate without requiring the mechanical systems of heating and cooling. The spatial design of neighborhoods can take advantage of solar technologies and particularly photovoltaic and solar technologies to achieve on-site energy production and maximum solar access, thus enhancing the energy resilience of urban surroundings. Therefore, to enhance the area’s resilience and increase the capacity to address such challenges, we can suggest a resilient solution based on multi-paradigm parametric modelling and control for the design and implementation of interconnected microgrids in the area. Microgrids are small-scale power systems employing renewable energy resources for the generation and distribution of electricity, thus achieving better management of production and consumption of power than conventional grids (Azeroual et al., 2022a; Azeroual et al., 2022b; Albarakati et al., 2023). This technology can offer customers multiple advantages over the power grid. The grid itself becomes less vulnerable, while the cost of electricity decreases. Moreover, CO2 emissions and other forms of pollution also get reduced (Storr et al., 2017; Azeroual et al., 2020a; Azeroual et al., 2020b; Zhang and Wei, 2020; Albarakati et al., 2021; Boujoudar et al., 2021; Azeroual et al., 2022c; Chekira et al., 2022; Sadaquat et al., 2023). The main goal of the study is to demonstrate the efficiency of multi-paradigm modelling in the development and operation of microgrid systems in the Rockaways. The approach is based on system dynamics, agent-based modelling, as well as discrete event and continuous time simulation to reflect the dynamic change of the microgrids. The latter helps in analyzing the electrical components such as voltage, current, frequency and their various attributes so that the system design, operation, and planning can also be improved. The choice of multi-paradigm modelling can be justified by its capacity to consider all complexities of the microgrids and their interrelations. In other words, with the employment of different modelling paradigms, including those of agent-based simulation for the component change together with the discrete event and continuous time simulation for the real-time, the study can enhance the energy reliability as well as sustainability in the Rockaways. The development of the approach can be supported by the ability to simulate various scenarios and identify control strategies that would minimize the effects of disturbances as well as occasional disbalance in power supply and demand. A control strategy is used in this study to control the interconnected microgrids. The control proves to be beneficial for managing the dynamics of interconnected microgrids, especially in the presence of nonlinear and variable components, such as renewable energy sources, storage devices, and changing loads. In addition, the control provides robustness and effectiveness in response to uncertainties and disturbances. The stable and reliable operation is guaranteed by the control strategy’s ability to respond to grid changes and reduce the impact of external disturbances. The proposed study thoroughly evaluates the resilience benefits achieved through the application of both multi-paradigm parametric modelling and control in developing and operating microgrid systems in the Rockaways Peninsula. The study includes diverse inputs and simulation results for comprehensive analysis. The results of this study affirm the technical and economic viability of microgrids for the Rockaways Peninsula, ultimately leading to a more robust, reliable, and sustainable energy infrastructure in the region. The Rockaways can benefit from multi-paradigm modelling and control in several ways:
• Enhanced Resilience: By integrating multiple modelling approaches, the microgrid can predict and respond to natural disasters, minimizing power outages and ensuring quick recovery.
• Improved Stability: Advanced control strategies can maintain voltage and frequency stability even under varying load conditions and renewable energy integration.
• Optimized Resource Use: Multi-paradigm models enable more efficient use of local energy resources, reducing dependency on external power supplies and lowering energy costs.
• Community Engagement: Agent-based modelling can simulate and optimize the participation of local consumers, fostering a cooperative energy community in the Rockaways.
• Scalability: The modular nature of multi-paradigm modelling allows the microgrid system to scale and adapt to future changes in energy demand and technology advancements.
The paper is organized as follows: Section 2 outlines the system modelling and control employed in this study. Section 3 discusses the simulation results. Section 4 presents the conclusion.
2 System modelling and control
In this study, we consider a decentralized power system that consists of multiple interconnected symmetric microgrid systems. This approach involves installing one microgrid system in each location throughout the region to enhance the resilience and reliability of the entire power system. Each microgrid connects to the main grid but can also disconnect and function independently in the event of power outages or grid disturbances; see Figure 1. We consider all loads as critical, with the primary goal of developing a balanced microgrid system that is entirely powered by renewable energy sources. The system setup comprises solar panels, battery storage units, infrastructure for power distribution, communication buses, points of interconnection, and energy management systems equipped with control systems to regulate the flow of energy among the different components of the system.
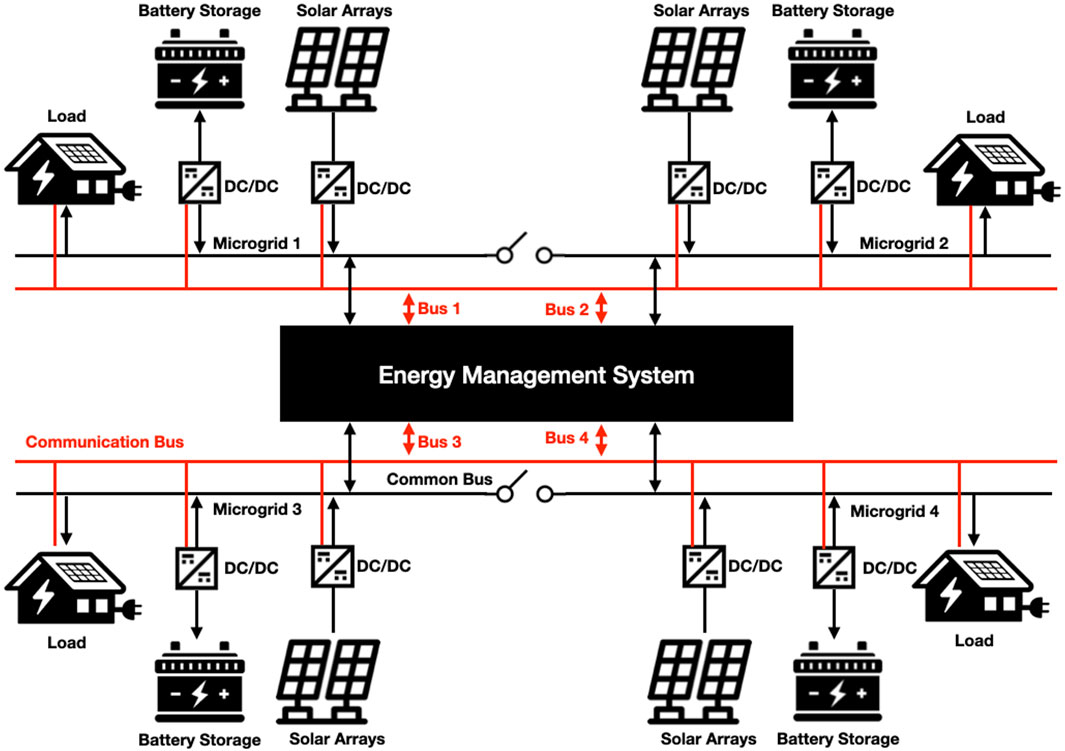
Figure 1. Schematic of the microgrid systems.
2.1 Modelling of solar panel and battery storage system (BSS)
In this study, we use a parametric model that incorporates the effects of temperature and solar irradiance, given their significant influence on the efficiency of photovoltaic (PV) cells. The fundamental equation that describes the current-voltage (I-V) relationship within a PV cell is given by Eqs 1, 2:
where
where
where
where
For the Rockaway Peninsula (approximate latitude 40.6°N), the model takes into account tilt angle seasonal adjustments for winter and summer, such as:
• Base Tilt Angle: Equal to the latitude (40.6°) for optimal year-round energy production.
• Winter Adjustment: Increase the tilt angle by 15° to account for the lower sun elevation.
• Summer Adjustment: Decrease the tilt angle by 15° for higher sun elevation.
The model also assumes that the power output is directly proportional to both the irradiance and the cosine of the difference between the optimal tilt angle and the actual tilt angle. The Battery Storage System (BSS) plays a crucial role in maintaining the stability and continuity of the power supply. To determine the battery’s performance, we use its State of Charge (SOC) which shows the current capacity of the battery. It is given by Eq. 7:
where
2.2 Control of energy management system
The energy management system is used to control the power flow between the solar panels, the battery storage system and the load. The main component of this system is the bidirectional DC-DC converter that regulates the power flow between the storage units, the solar panels, and the DC bus. To maintain stability in both AC and DC bus voltages in the DC microgrid, the system employs an energy management control strategy. This strategy is given by Eq. 8:
To increase the performance of the battery, a Fuzzy Logic controller is used to regulate the battery’s charging and discharging. The Fuzzy Logic control uses a set of rules based on linguistic variables, making decisions and adjustments based on the present conditions and needs of the battery system. This allows the charging and discharging of the battery to be optimally managed over various factors such as state of charge (SOC), voltage levels, currents, and temperatures, among others. Specifically, during the charging phase, the Fuzzy Logic controller controls the flow of energy into the battery. As the monitored state of the battery and the outside parameters change, the charging rate changes, allowing the battery to be charged safely. During the discharging phase, the Fuzzy Logic controller controls the release of stored energy.
The significant advantage of Fuzzy Logic control is its ability to be easily applicable in changing scenarios, adapting to changes in the input and outputs of energy and the conditions of the system. This makes it an ideal choice when improving the performance of hybrid systems that require precise management. Moreover, to ensure solar devices are working as efficiently as possible, they are equipped with a maximum power point tracker (MPPT). This device ensures that the power converted by the solar devices is being released and it adjusts the conditions in which devices are working, ensuring that they continuously output their peak power. Figure 2 presents the architecture of the battery management controller, incorporating both the Fuzzy Logic controller and the Maximum Power Point Tracker (MPPT).
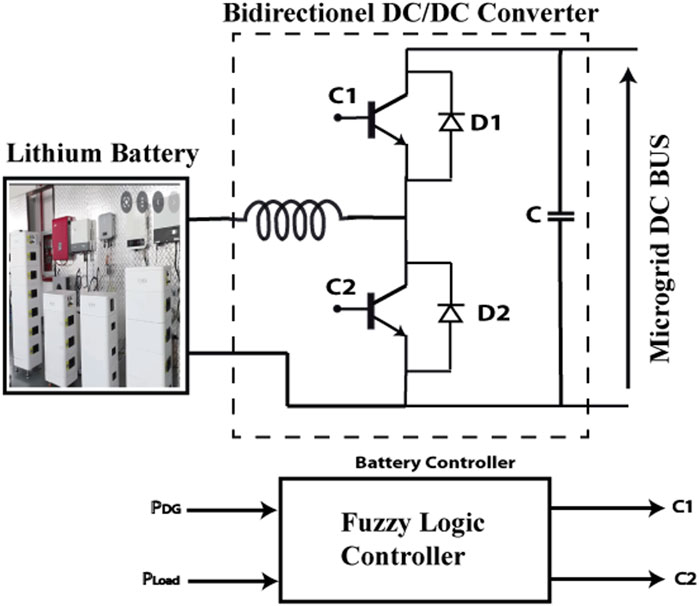
Figure 2. The fuzzy logic battery controller.
The controller interacts with the battery to evaluate the difference between the total load and the power generated, thereby determining the appropriate charging and discharging modes.
The power converters C1 and C2 are controlled using fuzzy logic (FL) to charge or discharge the Lithium battery based on the following principles:
• When the power generated by the distributed generators falls short of the power load (Pload), energy is directed from the battery to the bus. The bidirectional converter operates as a boost converter, discharging the battery to augment the power output, aiming to align PDG with Pload.
• When the PDG exceeds the Pload, energy is transferred from the bus to the battery.
• The bidirectional converter functions as a buck converter, utilizing the excess power to charge the battery, thereby adjusting the PDG to match the Pload.
• The Fuzzy Logic controller continuously observes and assesses the PDG against the Pload, modifying the power distribution as needed to preserve equilibrium and manage the battery’s charging or discharging processes efficiently.
3 Simulation and discussion
We conducted a thorough numerical simulation to evaluate the performance of the microgrid system under different conditions and loads. The simulation of the models and controller was conducted using Matlab/Simulink, with a set of experimental parameters; see Table 1. The simulation accurately integrated the distribution network of the Rockaway Peninsula, perfectly replicating the electrical load. A switch concept was utilized to regulate the transmission of energy within the network. The network consisted of five interconnected microgrid systems. In addition, every bus in the system included sensors to monitor voltage and frequency, therefore guaranteeing the stability of the microgrid. To meet the distinct energy needs of each microgrid, we have chosen different degrees of solar irradiation. The simulation utilizes Shenzhen Topray solar TPS10550-295W panels, arranged in series (500 panels) and parallel (134 panels) arrangements.
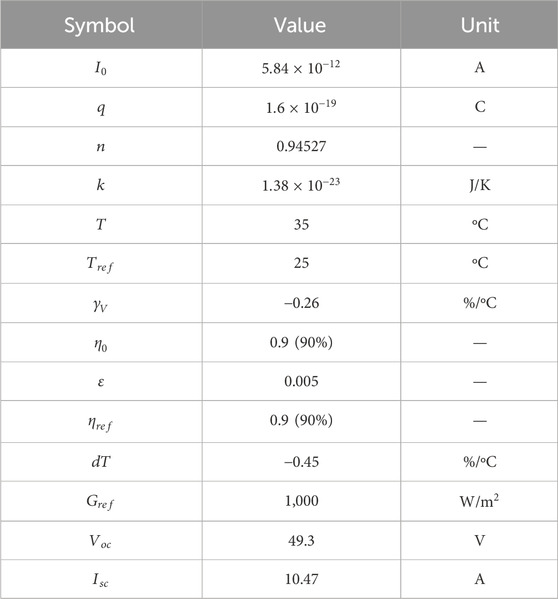
Table 1. Numerical values of the PV panel’s parameters.
Figure 3 shows the output power as a function of the voltage. The maximum power point (MPP), where the PV panel operates at its highest efficiency, occurs at approximately 40.6 V, where the output power reaches its peak value of about 400.316 W. This analysis demonstrates how output power varies with output voltage under specific conditions, incorporating adjustments for temperature and the provided electrical characteristics of the PV panel.
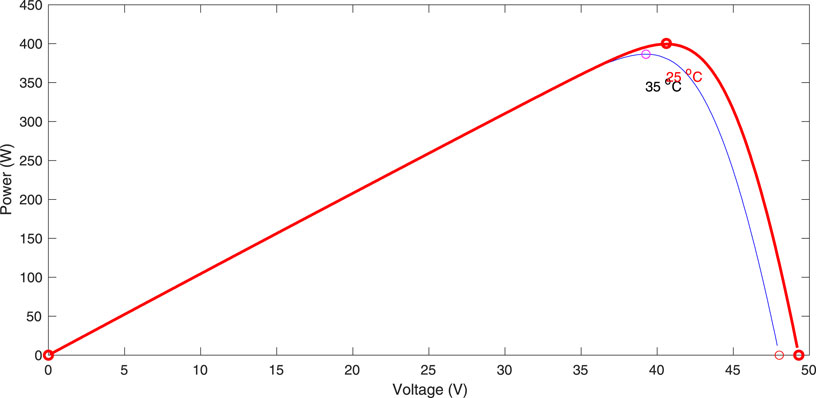
Figure 3. Output power as a function of the voltage.
Figure 4 illustrates the degradation of PV panel efficiency over a period of 25 years considering both aging and self-heating effects, based on an initial efficiency of 90% and a degradation rate constant of 0.005 per year. The efficiency decreases gradually over the 25-year period due to the combined effects of aging and temperature. The degradation rate of 0.5% per year is a relatively common estimate, though actual rates can vary based on panel technology, environmental conditions, and maintenance practices. Initially, the decline is more pronounced due to rapid early-stage degradation and the immediate impact of temperature. Over time, the rate of efficiency loss decreases, but the cumulative effect results in a notable reduction in panel performance. This simulation highlights the significance of addressing both aging mechanisms and thermal management in the design and maintenance of PV systems to optimize their performance over their operational lifespan.
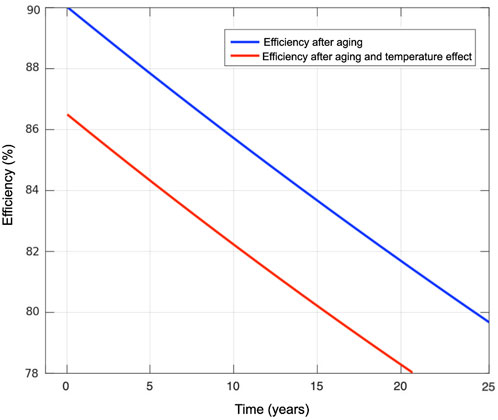
Figure 4. PV panel efficiency degradation over time considering aging and self-heating.
Figure 5 shows the simulated I-V curves with different levels of irradiances and temperatures for each cell in the solar panels. As expected, the photocurrent (
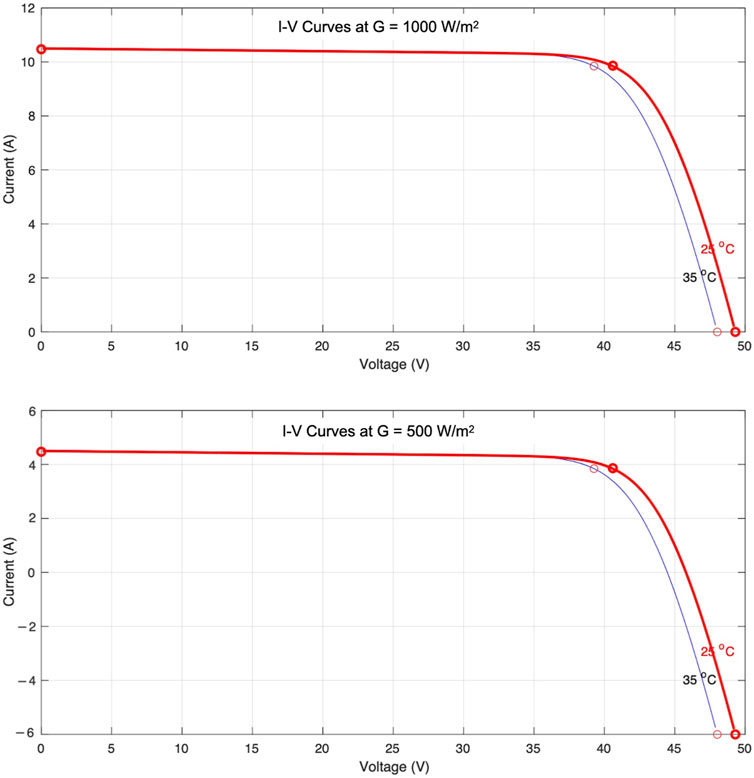
Figure 5. Current-Voltage (I-V) curves for different levels of irradiances and temperatures.
Figure 6 demonstrates the variations in solar irradiation levels accessed by microgrids 1–4. These fluctuations in solar irradiation are key to maximizing power generation within each microgrid. The results indicate that each microgrid can independently satisfy the energy demands of its designated load area without relying on integration with the external power grid. Individual microgrids often experience fluctuations primarily due to changes in solar irradiation levels. However, by incorporating a battery storage system into each microgrid, we successfully stabilized the power output to a constant 20 MW, achieving our objective; see Figure 7. Additionally, this integration has resulted in maintaining voltage stability at a steady 7,000 V; see Figure 8. Top of Form Despite variations in solar irradiation, the power generation consistently remained at 20 MW daily; see Figure 9.
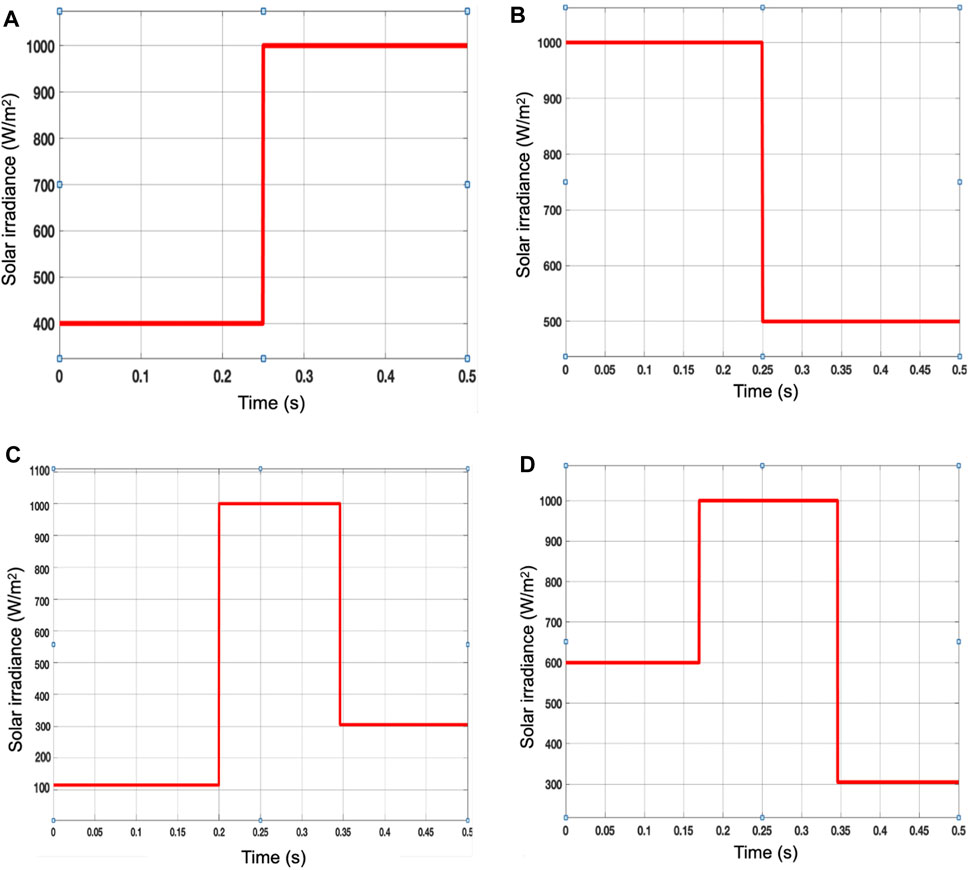
Figure 6. Solar irradiance: (A) Microgrid 1; (B) microgrid 2; (C) Microgrid 3; (D) Microgrid 4.
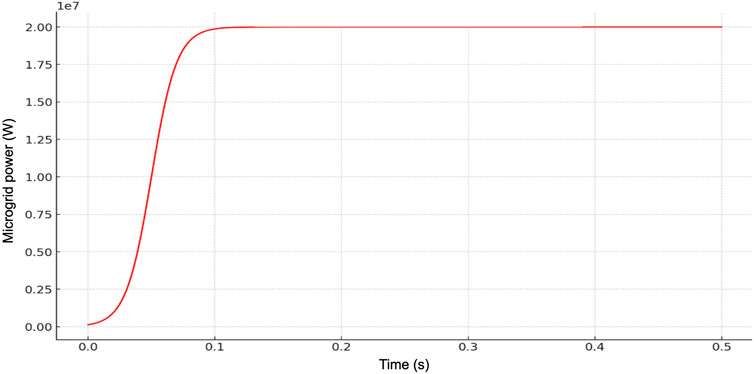
Figure 7. Microgrid power (W).
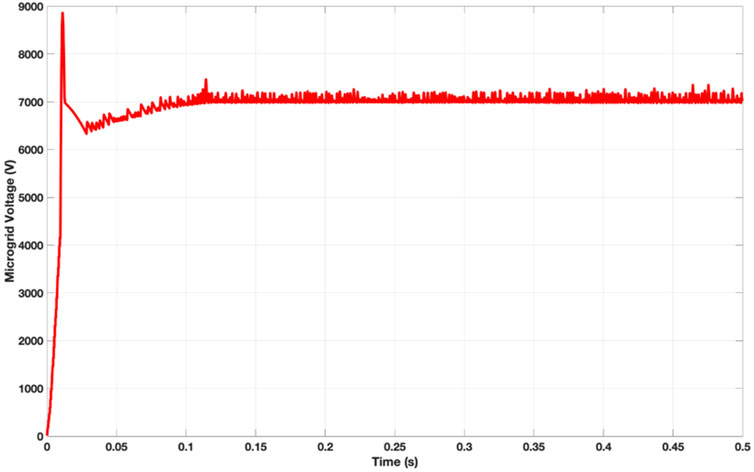
Figure 8. Microgrid voltage (V).
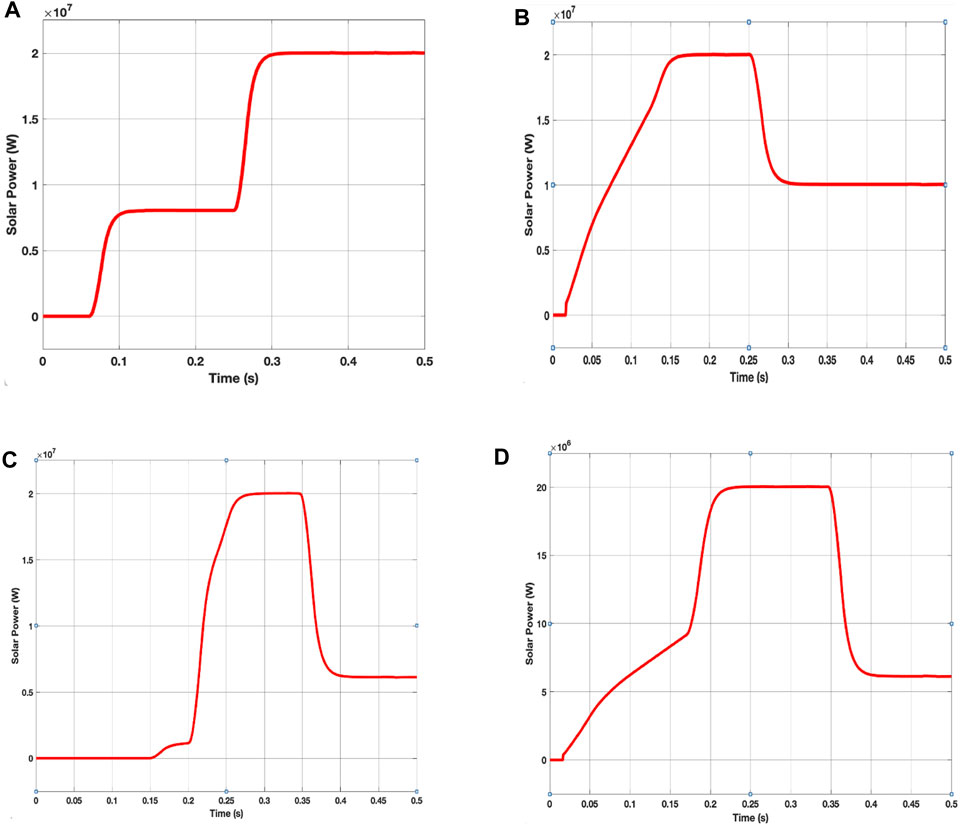
Figure 9. Produced power: (A) Microgrid 1; (B) Microgrid 2; (C) Microgrid 3; (D) Microgrid 4.
We also conducted frequency measurements for each microgrid to thoroughly assess the efficiency of the entire system. These measurements aimed to evaluate the signal quality, as depicted in Figure 10. Analyzing the frequency data from each bus provides critical insights into the performance of the microgrid system. The frequency measurements were conducted using Matlab’s Signal Processing Toolbox and the wavelet transform algorithm. These tools facilitate detailed time-frequency analysis, making them ideal for detecting frequency variations over time in dynamic microgrid environments. The wavelet transform algorithm decomposes the bus signals into different scales, enabling multi-resolution analysis. Unlike the Fourier transform, which represents signals using sinusoidal basis functions, the wavelet transform employs wavelets that are localized in both time and frequency domains. Voltage and current signal data from each microgrid bus were collected using a data acquisition system. The acquired signals underwent noise and unwanted component removal using built-in functions in the Signal Processing Toolbox. Subsequently, wavelet functions were applied, and the signals were decomposed using the continuous wavelet transform to derive wavelet coefficients. These coefficients were analyzed to identify dominant frequency components across various time scales. Instantaneous frequency information from the wavelet coefficients was then extracted. Finally, Matlab’s plotting functions were utilized to visualize the time-frequency representation of the signals, aiding in the interpretation of frequency variations over time.
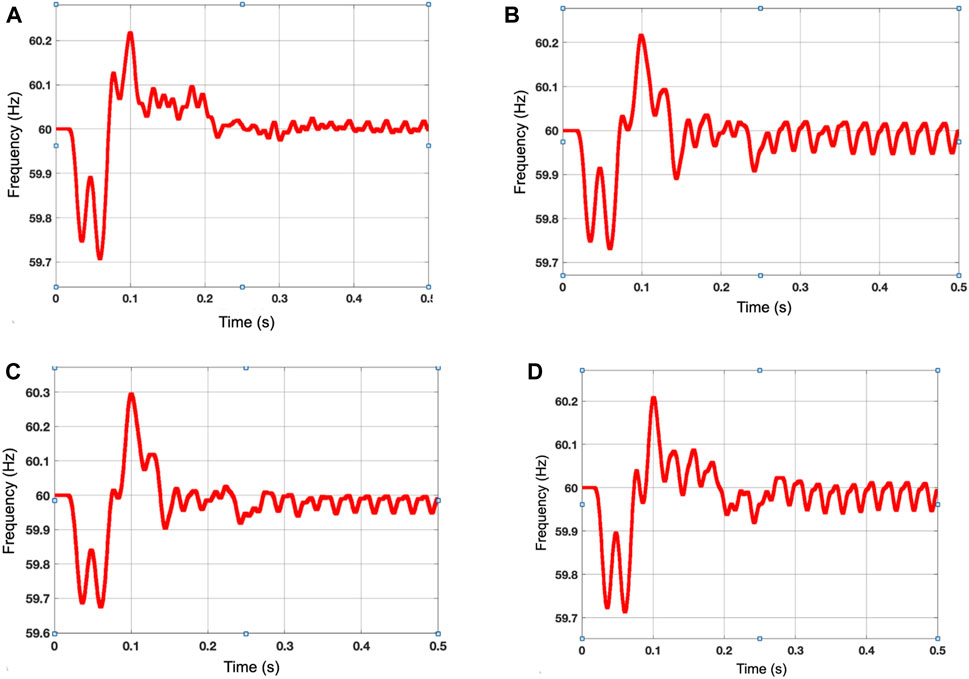
Figure 10. Measured frequency (Hz): (A) Bus 1; (B) Bus 2; (C) Bus 3; (D) Bus 4.
Overall, the use of multi-paradigm modelling in microgrid systems in the Rockaways leads to the enhancement of the system understanding, accurate simulation, better efficiency and more reliable resilience planning. Therefore, these advantages can be useful in the establishment of better, efficient and flexible microgrid systems in view of the challenges and opportunities in the Rockaways area. Thus, this approach enables the efficient use of computational resources and the assignment of more detailed specific simulations to each most critical component and event of the system, whereas the less detailed models can be used to model more stable and predictable elements of the microgrid. The level of detail of the paradigm models is set to be consistent in order to meet the middle ground between the simulation speed and precision, which allows running simulations with less time consumption without significant loss in accuracy. Furthermore, the information that is gained from multi-paradigm modelling is more detailed and as a result, leads to the formulation of better system optimization and control measures. Engineers can analyze the operation of the microgrid and optimize its parameters, design controllers to regulate the frequency and voltage of the microgrid, and simulate the performance of renewable energy integration or energy storage of the microgrid to a higher extent. Finally, the implementation of multi-paradigm modelling will facilitate a more rigorous validation and verification of models against real data or physical experiments since the closer the models are to reality, the more similar will be its performance to the actual microgrid. Therefore, it is possible to employ and implement new components and control strategies as microgrid technologies develop, adding extra features and increasing the scale.
4 Conclusion
This study presents a comprehensive solution that aims to enhance the reliability and resilience of the electrical infrastructure in the Rockaways region by establishing localized energy systems that possess their own generation, storage, and distribution capabilities. Our findings highlight the microgrid system’s performance in meeting stringent frequency control criteria, further solidifying its role as a dependable alternative for ensuring power supply continuity, especially during natural disasters. Importantly, we have successfully developed a balanced system with minimal variations in microgrid frequency and voltage, where frequency deviation does not exceed ±0.1 Hz. The introduction of multiple microgrids across the Rockaways region has the potential to drastically minimize outages and strengthen the resilience of the electrical infrastructure. The Rockaways case study is a perfect example of how our multi-paradigm modelling approach can be used to improve the dependability of electrical systems. Thus, the microgrid with the generation, storage, and distribution capacities in place for the specific region has been proven to be capable of meeting the required frequency control standards and thus guarantee continuous power supply even in the event of natural disasters. In future studies, we intend to investigate more adaptive control algorithms (e.g., sliding mode control) to dynamically adapt to fluctuating grid conditions and optimize the real-time operation of interconnected microgrids. Additionally, given the substantial reliance of interconnected microgrids on communication networks and digital control systems, future studies would include the development of robust cybersecurity measures to protect the microgrid infrastructure against potential cyber threats.
Data availability statement
The original contributions presented in the study are included in the article/supplementary material, further inquiries can be directed to the corresponding author.
Author contributions
AA: Conceptualization, Methodology, Resources, Writing–review and editing, Data curation, Software, Supervision, Validation, Writing–original draft. DZ: Conceptualization, Methodology, Resources, Writing–review and editing. IARM: Conceptualization, Methodology, Resources, Writing–review and editing.
Funding
The author(s) declare that no financial support was received for the research, authorship, and/or publication of this article.
Conflict of interest
The authors declare that the research was conducted in the absence of any commercial or financial relationships that could be construed as a potential conflict of interest.
Publisher’s note
All claims expressed in this article are solely those of the authors and do not necessarily represent those of their affiliated organizations, or those of the publisher, the editors and the reviewers. Any product that may be evaluated in this article, or claim that may be made by its manufacturer, is not guaranteed or endorsed by the publisher.
References
Albarakati, A. J., Azeroual, M., Boujoudar, Y., El Iysaouy, L., Aljarbouh, A., Tassaddiq, A., et al. (2023). Multi-agent-based fault location and cyber-attack detection in distribution system. Energies 16, 224. [CrossRef]. doi:10.3390/en16010224
Albarakati, A. J., Boujoudar, Y., Azeroual, M., Eliysaouy, L., Kotb, H., Aljarbouh, A., et al. (2022). Microgrid energy management and monitoring systems: a comprehensive review. Front. Energy Res. 10, 1097858. [CrossRef]. doi:10.3389/fenrg.2022.1097858
Albarakati, A. J., Boujoudar, Y., Azeroual, M., Jabeur, R., Aljarbouh, A., El Moussaoui, H., et al. (2021). Real-time energy management for DC microgrids using artificial intelligence. Energies 14, 5307. [CrossRef]. doi:10.3390/en14175307
Ashok, V., Yadav, A., and Abdelaziz, A. Y. (2021). “A comprehensive review on wide-area protection, control and monitoring systems,” in Wide area power systems stability, protection, and security. Power systems. Editors H. Haes Alhelou, A. Y. Abdelaziz, and P. Siano (Cham: Springer), 1–43. [CrossRef].
Azeroual, M., Boujoudar, Y., Bhagat, K., El Iysaouy, L., Aljarbouh, A., Knyazkov, A., et al. (2022a). Fault location and detection techniques in power distribution systems with distributed generation: kenitra City (Morocco) as a case study. Electr. Power Syst. Res. 209, 108026. [CrossRef]. doi:10.1016/j.epsr.2022.108026
Azeroual, M., Boujoudar, Y., Iysaouy, L. E., Aljarbouh, A., Fayaz, M., Qureshi, M. S., et al. (2022b). Energy management and control system for microgrid based wind-PV-battery using multi-agent systems. Wind Eng. 46, 1247–1263. [CrossRef]. doi:10.1177/0309524x221075583
Azeroual, M., Boujoudar, Y., Lamhamdi, T., El Moussaoui, H., and El Markhi, H. (2020b). “Fault location and isolation technique in smart distribution systems with distributed generation,” in Proceedings of the 2020 1st international conference on innovative research in applied science, engineering and technology (IRASET) (Morocco: Meknes), 16–19. [CrossRef].
Azeroual, M., Boujoudar, Y., Lamhamdi, T., El Moussaoui, H., and El Markhi, H. (2022c). Fault location technique using distributed multi agent-systems in smart grids. Lect. Notes Electr. Eng. 745, 607–613. [CrossRef]. doi:10.1007/978-981-33-6893-4_56
Azeroual, M., Lamhamdi, T., and El Markhi, H. (2020a). Simulation tools for a smart grid and energy management for microgrid with wind power using multi-agent system. Wind Eng. 44 (6), 661–672. [CrossRef]. doi:10.1177/0309524x19862755
Boujoudar, Y., Azeroual, M., Eliysaouy, L., Bassine, F. Z., Albarakati, A. J., Aljarbouh, A., et al. (2023). Fuzzy logic-based controller of the bidirectional direct current to direct current converter in microgrid. Int. J. Electr. Comput. Eng. (IJECE) 13, 4789–4797. [CrossRef]. doi:10.11591/ijece.v13i5.pp4789-4797
Boujoudar, Y., Azeroual, M., El Moussaoui, H., and Lamhamdi, T. (2021). Intelligent control of battery energy storage for microgrid energy management using ANN. Int. J. Electr. Comput. Eng. (IJECE) 11 (4), 2760–2767. [CrossRef]. doi:10.11591/ijece.v11i4.pp2760-2767
Chekira, O., Boharb, A., Boujoudar, Y., El Moussaoui, H., Lamhamdi, T., and El Markhi, H. (2022). An improved energy management control strategy for a standalone solar photovoltaic/battery system. Indonesian J. Electr. Eng. Comput. Sci. 27, 647–658. [CrossRef]. doi:10.11591/ijeecs.v27.i2.pp647-658
Defense Technical Information Center (2023). Defense technical information center. Available at: https://apps.dtic.mil/sti/citations/ADA552291 (accessed on 14 September 2023).
Gurcan, M. (2015). Arming civilians as a counterterror strategy: the case of the village guard system in Turkey. Dyn. Asymmetric Confl. 8, 1–22. [CrossRef]. doi:10.1080/17467586.2014.948026
Haes Alhelou, H., Hamedani-Golshan, M. E., Njenda, T. C., and Siano, P. (2019). A survey on power system blackout and cascading events: research motivations and challenges. Energies 12, 682. [CrossRef]. doi:10.3390/en12040682
Kunz, M., Mühr, B., Kunz-Plapp, T., Daniell, J. E., Khazai, B., Wenzel, F., et al. (2013). Investigation of superstorm Sandy 2012 in a multi-disciplinary approach. Nat. Hazards Earth Syst. Sci. 13, 2579–2598. [CrossRef]. doi:10.5194/nhess-13-2579-2013
Mortensen, K., Wilson, R. K., and Ho, V. (2009). Physical and mental health status of Hurricane Katrina evacuees in Houston in 2005 and 2006. J. health care poor underserved 20, 524–538. [CrossRef]. doi:10.1353/hpu.0.0130
Papic, M., et al. (2011). “Survey of tools for risk assessment of cascading outages,” in Proceedings of the 2011 IEEE power and (Detroit, MI, USA: Energy Society General Meeting), 24–28. [CrossRef].
Pekovic, V., Seff, L., and Rothman, M. (2007). Planning for and responding to special needs of elders in natural disasters. Generations 31, 37–41. [CrossRef].
Sadaquat, A., El Iysaouy, L., Lahbabi, M., Boujoudar, Y., Alharbi, S. J., Azeroual, M., et al. (2023). A matlab-based modelling to study and enhance the performance of photovoltaic panel configurations during partial shading conditions. Front. Energy Res. 11 (11), 1169172. [CrossRef]. doi:10.3389/fenrg.2023.1169172
Sharma, N., Acharya, A., Jacob, I., Yamujala, S., Gupta, V., and Bhakar, R. (2021). “Major blackouts of the decade: underlying causes, recommendations and arising challenges,” in Proceedings of the 2021 9th IEEE international conference on power systems (ICPS) (Kharagpur, India), 16–18. [CrossRef].
Storr, V. H., Haeffele-Balch, S., and Grube, L. E. (2017). Social capital and social learning after Hurricane Sandy. Rev. Austrian Econ. 30, 447–467. [CrossRef]. doi:10.1007/s11138-016-0362-z
Wu, Y. K., Chang, S. M., and Hu, Y. L. (2017). Literature review of power system blackouts. Energy Procedia 141, 428–431. [CrossRef]. doi:10.1016/j.egypro.2017.11.055
Keywords: microgrid, power outage, simulation, modelling, smart grids
Citation: Aljarbouh A, Zubov D and Moghrabi IAR (2024) Multi-paradigm modelling and control of microgrid systems for better power stability in the Rockaways. Front. Energy Res. 12:1404811. doi: 10.3389/fenrg.2024.1404811
Received: 21 March 2024; Accepted: 24 July 2024;
Published: 05 August 2024.
Edited by:
Ningyi Dai, University of Macau, ChinaReviewed by:
Rajesh K., Kalasalingam University, IndiaMichael Saulo, Technical University of Mombasa, Kenya
Copyright © 2024 Aljarbouh, Zubov and Moghrabi. This is an open-access article distributed under the terms of the Creative Commons Attribution License (CC BY). The use, distribution or reproduction in other forums is permitted, provided the original author(s) and the copyright owner(s) are credited and that the original publication in this journal is cited, in accordance with accepted academic practice. No use, distribution or reproduction is permitted which does not comply with these terms.
*Correspondence: Ayman Aljarbouh, YXltYW4uYWxqYXJib3VoQHVjZW50cmFsYXNpYS5vcmc=