 Amna Mumtaz
 Syed Ali Abbas Kazmi
 Abdullah Altamimi
 Zafar A. Khan4
95% of researchers rate our articles as excellent or good
Learn more about the work of our research integrity team to safeguard the quality of each article we publish.
Find out more
ORIGINAL RESEARCH article
Front. Energy Res. , 22 May 2024
Sec. Process and Energy Systems Engineering
Volume 12 - 2024 | https://doi.org/10.3389/fenrg.2024.1404777
Floating Photovoltaic (FPV) systems are gradually becoming more desirable due to a multitude of reasons, encompassing proximity to urban water reservoirs (facilitating city access) and their technical advantages. Climate change potentially presents risks of drought and FPV can potentially benefit by providing clean energy as well as saving water from evaporation. However, detailed studies are required to comprehensively evaluate the potential of FPV considering not only the technical parameters but evaluating the climatic effects as well. This paper presents an integrated multi-dimensional framework for the analysis of 2.5 MW grid-connected FPV systems over different climatic zones. In the first layer, a techno-economic and performance evaluation is carried out by fine-tuning different inputs of systems to make it ideal for proposed analyses under actual FPV conditions. Similarly, in the second layer environmental along with forest absorbing carbon analyses are performed. While socio analysis observed in the third fold is based on various SDGs and their indicators. Results reveal that the Dam with cold in winter and hot in summer climate conditions observed a most feasible site with a Levelized cost of energy (LCOE) of $0.047/kWh and a Net present value (NPV) of million $1.7705, respectively. In contrast, a Dam with mild cold climate conditions proves the least feasible site with LCOE of $0.057/kWh and NPV of million $1.0256, respectively. Similarly, the former Dam saved 20.50% higher CO2 emissions as compared to the latter, as well as required hectares of forest absorbing carbon. A comparative analysis observes a capacity factor of 22% and a performance ratio (PR) of 5%–10% higher as compared to solar photovoltaic (SPV) for dams with extreme weather.
Human social activities and lifestyles, as well as aquatic habitats, are influenced by fossil fuels. Carbon and hydrogen are the primary components of fossil fuels, but they also contain other substances e.g., lead, sulfur, and alcohol). Fossil fuel combustion results in the production of a variety of gases (COx, SOx, NOx, CH) ash and soot, tar droplets, and other organic compounds into the atmosphere, all of which contribute to air pollution. The health of people, animals, crops, and buildings is harmed by air pollution (Barbir et al., 1990). According to a statistical review of World Energy (2020), almost 84.3% of global energy comes from fossil fuels containing 33.1% of energy from oil resources, which always remained the main driver behind increasing oil prices in the international market and renewable has a share of only 11.4% of overall energy consumption (Statistical Review, 2020).
From the perspective of Asian countries, this energy mix situation is even more alarming as compared to other developed nations. For some countries, the domestic sector has the highest energy consumption share of 48%, while the industrial sector contributes 27% of the overall energy consumption (Raza et al., 2022). For some countries, the energy supply is mostly dependent on fossil fuels, with more than 63% thermal energy. Renewable energy (RE) like solar and wind often accounts for very little up to 3% of total electricity generation (Raza et al., 2022).
Renewable energy sources are the best option for addressing these challenges because of their long-term sustainability and environmentally friendly options (Goswami et al., 2019). Because of the threat posed by GHG emissions from fossil fuels and associated power generation, the usage of environmentally friendly renewable energy, notably SPV has gained enormous popularity as its demand has steadily increased by 20%–25% per year across the globe over the first 2 decades of the twenty-first century. The rate of expansion of RE capacity has been fast-growing, yearly renewable capacity additions reached 45% to about 280 GW in 2020, the biggest annual increase since 1999. Its appeal is based mostly on semiconductor technology, environmental benefits, policy-intensive nature, and ease of installation. Because they never run out of resources, photovoltaic (PV) and wind energy are the most widely adopted renewable energy sources across the globe. Most Asian countries have a good potential for solar or wind generation or hybrid. Most of the Asian countries existing energy mix is heavily reliant on fossil fuels (Ministry of Energy Petroleum Division, 2018).
The effective use of renewable energy potential is necessary to assure energy security and reduce climate change challenges. Further observations show that ground-mounted PV power plants in modern towns take up a lot of territory. As a result of this factor, land prices have risen, increasing the Levelized power tariff. The earth’s total surface area is made up of 71% of water and 29% land. Land acquisition is another issue to address as the population grows, so the best solution is to put the water’s idle surface to good use. Where, at the one hand, solar energy is gaining popularity due to its limitless energy supply. At the same time, on the other hand, the climatic conditions, design parameters, and operation parameters affect the performance of PV, due to which a 0.5% reduction in PV efficiency is observed by a 1°C increase in temperature. PV efficiency gets decreased, as the module temperature increases due to a higher thermal effect of solar irradiance. Two major issues associated with land-based PV (LPV) i.e., land acquisition and high temperature have been solved by an emerging PV system concept called FPV. A comparison of LPV and FPV is given in Table 1.
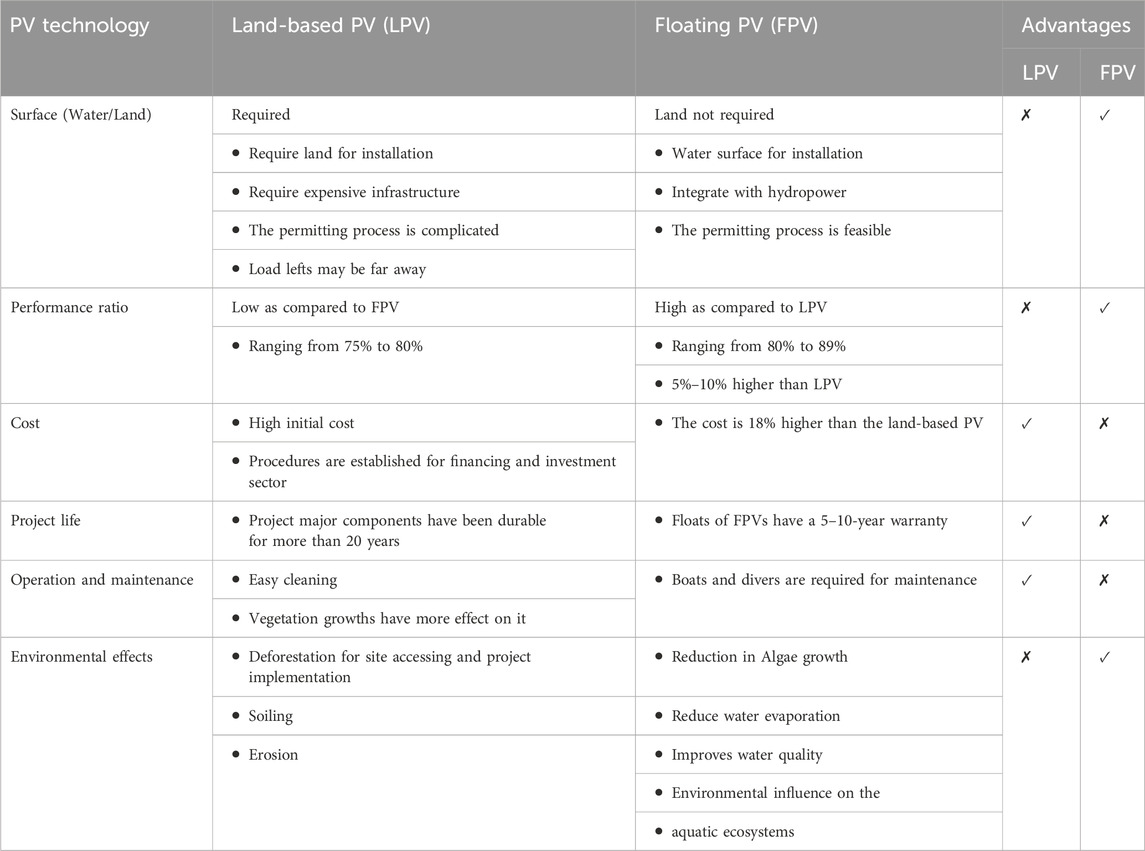
Table 1. Comparison between LPV and FPV (Where Sun Meets Water, 2019; Pimentel Da Silva and Branco, 2018).
This concept works best in densely populated areas with uneven terrain. For hot and arid regions, FPV has a lot of potential since the operating temperature can be controlled and the PV performance can be optimized. FPV systems offer new ways to expand solar power generation capacity due to their high efficiency as compared to LPV. They can be integrated with hydroelectric power plants and have a considerable impact on supplying electric load in various spans of the year, particularly during the hot and dry seasons. A standalone system needs a large power storage infrastructure, which almost doubles the system’s overall capital cost, and challenges the economic feasibility of the systems (Temiz and Dincer, 2021). Moreover, as the number of components increases, it suffers a significant power dissipation loss which poses a substantial challenge to system performance. As a result, grid-connected configurations are widely adopted for most practical scenarios.
In comparison to LPV systems, FPV provides technological, economic, social, and environmental advantages. Furthermore, due to fluctuating fuel prices on the worldwide market, electricity prices are always changing. Hydropower accounts for 26% of total output, and the dam’s idle surfaces may be utilized to generate energy by dedicating water surfaces to FPV installations. An integrated infrastructure of floating systems and PV plants is referred to as an FPV plant. A crystalline and thin-film FPV offers financial benefits of more than $129 cents/L over diesel-fueled energy production sources (Trapani and Millar, 2016). The efficiency of the LPV system is around 15%, which may be enhanced further by using FPV to take advantage of the cooling effects of water. FPVs are also favored over LPVs because they have a recyclable platform. Additionally, they are recommended for generating energy in remote locations and places with land accessibility and water conservation issues, such as salt mines and oil refineries that are far from grid stations.
The development of FPV systems is in its early stages, emphasizing the need for comprehensive long-term performance and feasibility studies. Precise parameter estimation is crucial for gauging actual performance, carbon savings, and facilitating the deployment of FPV systems. Accurate modeling not only supports researchers, scientists, and engineers in making informed decisions but also contributes to the establishment of a sustainable ecosystem aligned with low-carbon power generation methods within the framework of Industry 4.0 (Goswami and Sadhu, 2022). Notably, FPV systems, operating on water with higher relative humidity and lower temperatures compared to LPV systems, exhibit superior energy output despite the observed impact on the performance ratio (PR). This underscores the potential of FPV systems to offer efficient and sustainable solutions in the evolving landscape of renewable energy (Goswami, 2023). FPVs are preferred over LPVs for several reasons, including FPVs avoid high dust accumulation because they are installed on the surface of the water, FPVs reduce evaporation in water reservoirs, decrease GHG emissions, Save high land purchase costs, utilize idle water surfaces, address the problem of increased electricity transportation costs, conquer high-temperature impacts on SPVs, reduce algae growth, satisfy energy demand, and overcome long and tedious installation times.
Several states in the United States have set a goal of producing 100% renewable energy-based green power by 2040, incorporating both centralized and decentralized generation. By 2040, several European and Asian countries have set a target of producing more than half of their total electricity from renewable sources (Uddin et al., 2022).
IRENA has identified FPV as a rising niche and an emerging technology. According to NREL, FPVs have a 7.6 TW potential on hydropower reservoirs. In almost 40 countries, FPVs have been built on reservoirs, freshwater lakes, and dams. Since 2007, different FPV plants ranging in size from a few kW to a few megawatts have been developed and are now functional in many countries (Trapani and Redõn Santafé, 2015). The first 20 kW FPV system was installed in Japan in 2007, and Ciel & Terre was the first FPV installation French company has built several projects on both artificial and natural water bodies. According to a market perspective, the global market for FPV is growing rapidly, and it is predicted to reach $842 million by the end of 2023. According to the IEA, adding FPVs to the water bodies of hydropower stations may yield a potential power of roughly 10,600 TWh per year, whereas total world energy consumption in 2018 was 22,300 TWh.
Internal cell temperature has a significant impact on solar PV efficiency. The cooling effect of the water surface reduces the internal temperature which boosts the system’s energy efficiency by 5%. Among renewable technologies, FPV technology is becoming more attractive for both research and commercial operations. It is expected to reach 4.13 GW of installed capacity by 2024, with a compound annual growth rate of 30%. Although installing a floating structure, extra insulation, and equipment increases capital and operational costs by 25%, lower land prices may compensate for the higher expenditures (Temiz and Dincer, 2021). The primary issue with FPV is the initial investment, which is decreasing with time and will soon be competitive with LPV. The solar industry in Asia is booming, thanks to the fact that 78% of Asia’s water bodies are appropriate for FPV installation. FPV is a cutting-edge technology that can solve the current energy deficit while also providing economic and environmental benefits by lowering
A test case in India is taken on the Mettur dam in Tamil Nadu to analyze the performance of FPVs. A land-scaped flat-mounted system was found to have a high-performance ratio (PR). A 1 MW FPV system having a component configuration of four 250 kW inverters, four blocks, and twenty strings was proposed by Indonesia in 2019. Three reservoirs were chosen for simulation and modeling reasons. Sungrow, a Chinese business, built a 600 kW FPV plant in Hanoi, Vietnam. Table 2 shows a potential summary of FPV from 2007 to 2017. Recently Portugal launched an auction of 26 MW which is allocated to seven different dams, having diverse capacities, summarized in Table 3.
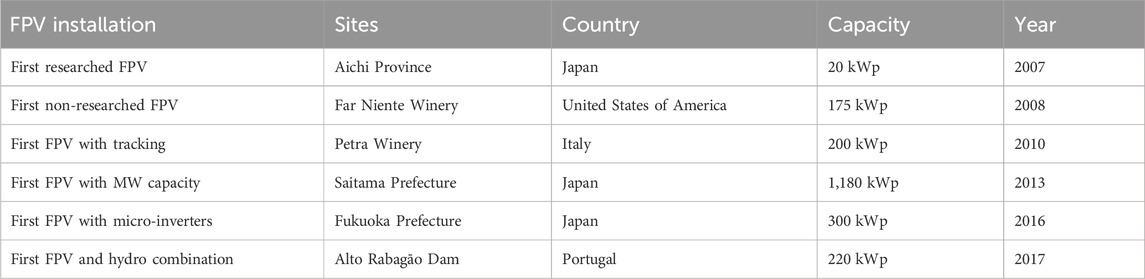
Table 2. Potential summary of FPV from 2007-17.
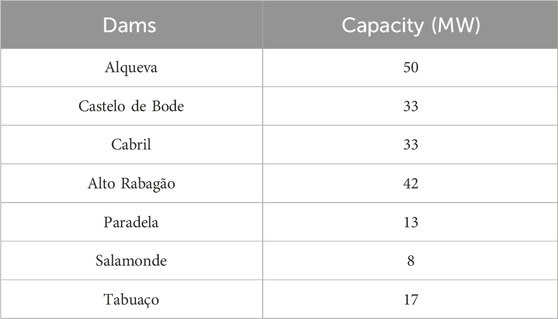
Table 3. Portugal launched an auction and the capacity of the dams.
A total of ten of the largest FPV farms are summarized in Table 4. There are various FPV solution providers for offshore, near-shore, and interior freshwater applications all around the world. FPV solutions for inland freshwater are provided by companies such as Ciel & Terre International, Kyoraku, LG CNS, LSIS, Scotra, SMCC, Sungrow, and Xiamen Mibet New Energy while floating technology solutions for offshore uses are provided by Ocean Sun and Swimsol.
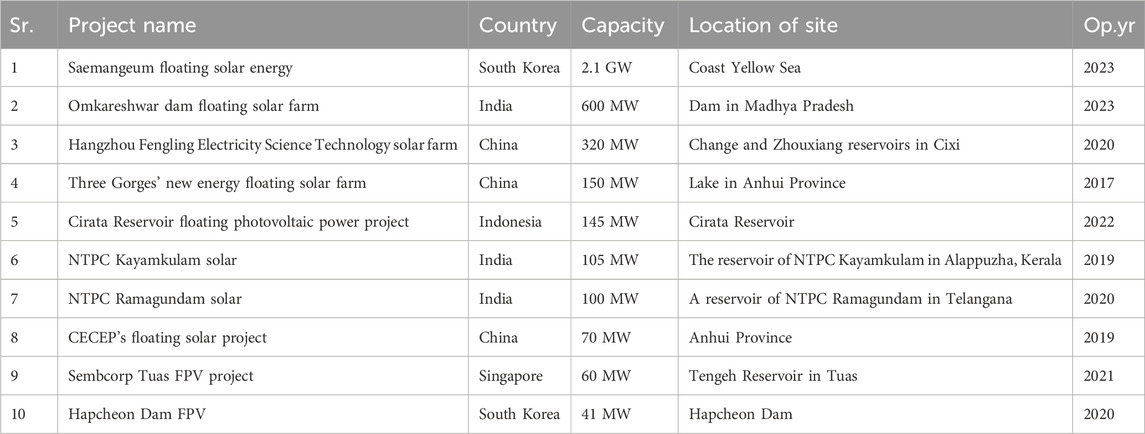
Table 4. Ten largest scheduled FPV power plant projects.
As the world’s population grows, land use competition for buildings, industry, power production, transportation, and ecosystem products and services intensify. FPV systems have shown promise as a technical solution for land acquisition, and several studies have been conducted, with these systems being examined from a variety of angles. A rigorous techno-economic and sustainability assessment of these solar technologies reveals a plethora of benefits, including cost-effective and environmentally friendly solutions. Due to its high initial investment and lack of appropriate water bodies, FPV technology currently faces several technical and practical challenges. Various studies have been performed to carry out these challenges across different regions with different sites’ specific natures. Pietro et al. (Campana et al., 2019) have proposed an approach to analyzing numerous scenarios for optimal integration of hybrid renewable energy systems into a typical shrimp farm by taking the case of Thailand with the aims of renewable energy exploitation and decarbonization of the shrimp farming sector. FPV plants and FPV tracking systems are being examined as solar energy solutions to supply the shrimp farm’s power requirements. The authors investigated the integration impacts with the different optimal configurations of hybrid energy sources. Results summarized that the incorporation of FPV is a crucial approach for minimizing shrimp farming’s ecological consequences.
In India, FPVs have a lot of potential, and their efficiency is thought to be higher than that of LPVs. FPVs can manage and minimize algae growth and water evaporation by 70% and require less maintenance. FPV is made up of three basic parts: a mooring system, a pontoon, and floats. By altering the tilt angle of the PV panels, the problem of water shading may be solved.
During rainy seasons, the mooring system should be strong enough to withstand the effects of flooding (Akole and Jadhav, 2018). Temperature and dust are two important effecting variables in SPV that can be addressed with the use of FPVs. The FPV system is considered an ideal solution for land-constrained sites, high population density, numerous water resources, and high evaporation rates. FPVs are cost-effective solutions due to lower cleaning costs and no need for land (Zahedi et al., 2021). Contraction, tracking, and cooling techniques for FPVs can help in increasing the efficiency of the overall PV system. Flat reflectors and positive trackers enhanced power generation considerably. A different indicator like the thermal coefficient plays a major role in predicting the efficiency of system. A negative thermal coefficient means that the efficiency of the commercial PV system is inversely proportional to cell temperature. For silicon crystalline PV technologies, it ranges from 0.4% to 0.45%/oC whereas for a-Si it is 0.2%/oC (Cazzaniga et al., 2018).
An FPV power plant might help the San Francisco River Integration Project (SFIP), which aims to supply water to 12 million people in the Brazilian semiarid. The SFIP needs a substantial quantity of energy in an area where power costs have climbed, and water usage has increased over the previous decade. The results established the techno-economic feasibility of this technology linked to the SFIP by simulating an FPV power plant using the System Advisor Model (SAM) employing approaches and parameters from existing FPV projects. The FPV’s environmental implications and importance in the Brazilian Northeast’s water-energy nexus are also examined by Luana Carolina Alves da Costa et al., (da Costa and da Silva, 2021). The FPV might reduce SFIP running costs, reduce environmental impacts, and increase water and energy management efficiency. Such elements are significant when looking at the water-energy interconnection in a location where there is strong competition for water and extended periods of drought.
Southern European countries have ideal climate conditions for boosting solar energy adoption. J. Baptista et al. (Baptista et al., 2021), looked at the possibility and grid integration for FPV systems in Portugal. The Gouves dam, which is part of the Tâmega hydropower complex under development in northern Portugal, was used to test the sizing and performance of a 1 MW FPV power plant. A techno-economic feasibility analysis was also carried out, taking into account the current investment costs and energy tariffs in the liberalized Iberian market. This in-depth analysis uncovered crucial information regarding the present state of the art, the types of technologies that are accessible, their costs, and the payback period (PBP) for similar projects. In 2020 J. Haas (Haas et al., 2020) took to Rapel reservoir in central Chile to examine the impact of FPVs on water quality as well as on hydropower production. FPV reveals several advantages including water quality improvement by eliminating algae blooms and the area covered with FPVs has a direct impact on cost and ecological health. If 40%–60% area will cover it can eliminate 100% of algae without severe financial hydropower loss. For more than 60% of the area covered, ecological heath will affect major economic hydropower loss because of no sunlight in the reservoir. Evaporation from open water reservoirs, such as dams, results in a significant loss of water resources. By merging FPVs with HEPP, water is conserved as well as power is generated for electrification purposes. For nearly 2 decades, satellite photographs of Turkey’s Demirköprü dam were used to locate the best location for FPV installation, where high power generation was recorded with minimal evaporation (Ates et al., 2020). China has a rich potential for FPV installation having almost 2,865 lakes with a surface area of 78,000 sq. km. The efficiency of FPVs over standard terrestrial PVs improves when the operating temperature drops due to the cooling effect (Liu et al., 2017). R. Cazzaniga et al. (Cazzaniga et al., 2018) investigated the performance of FPV plants and proposed various design options for increasing efficiency and cost-effectiveness. FPV systems, in particular, make use of added characteristics like cooling, tracking, and concentration. A floating structure on the water was used to demonstrate the possibility of constructing an integrated air storage system.
According to the findings of (Goswami et al., 2019), The production capacity of a 10 MW FPV plant is 10.2% higher than an LPV system. The FPV plant saves $352,125 in land expenses and $47,600 in water cess. Furthermore, the FPV plant saves tons of coal and 340801.74 tons of
Integrating FPVs with HEPP by installing them at dam reservoirs to make use of the optimum energy combination is also a brilliant way to save money associated with transmission and distribution infrastructure. In Bangladesh, the technical feasibility and financial viability of a 50 MW plant integrated with a hydroelectric dam were investigated. The plant may reduce
According to literature surveys, relatively few studies on the techno-economic, environmental, and social (TEES) assessment of grid-connected FPV systems for various sectors have been published. Most of the studies are related to techno-economic analysis of standalone FPV system. For example, with the goal of evaluating the feasibility of implementing a FPV system on an urban lake site, the authors in reference (Hafeez et al., 2022) conducted a techno-economic assessment. This assessment aimed to estimate the potential deployment of the FPV system, assess its scope, and compare it with a ground-based photovoltaic system with similar specifications. The study focused on an urban lake within institutional premises. In reference (Micheli et al., 2022), the authors evaluated the potential energy yield and cost-effectiveness of FPV systems over appropriate water bodies in Europe. The comparison was made against land-based photovoltaic systems with optimal tilt angles. In reference (Kowsar et al., 2023), researchers conducted a comprehensive examination of the techno-economic and environmental aspects of a 50 MW FPV power plant situated in a marsh area within an extremely densely populated country. Utilizing PVsyst simulation tools, the study revealed that the levelized cost of energy (LCOE) for the 50 MW FSPV plant is US$ 0.051/kWh, significantly lower than the US$ 0.087/kWh observed for fossil fuel-based power plants in the studied nation. Additionally, the proposed FSPV system contributes to reductions in CO2 emissions, water evaporation, and supports biodiversity conservation in marshlands. Likewise, employing a GIS-MCDA model, an evaporation model, and incorporating a cost-benefit analysis, the study outlined in (Bai et al., 2024) assessed the prospective growth of FPV systems in China. The research delves into the energy-land-water co-benefits associated with FPV. Additionally, the analysis extends to unveiling the existing land limitations for the deployment of solar photovoltaics in China, with an evaluation of the potential for traditional terrestrial solar photovoltaic systems. To the best of the authors’ knowledge, no study in the literature reported an integrated analysis of techno-economic, environmental, and social (TEES) feasibility along with performance evaluation of mega-scale FPV systems, especially from the metrological and geographical point of view of south Asian country. It is worth mentioning here that FPV installation and performance work differently compared to LPV. Various parameters like U-value and Albedo differ in FPV as compared to LPV. Most of the previous studies performed an analysis based on the same or default U-value and Albedo for FPV as these are kept in LPV. However, in actual conditions, for correct analysis and performance evaluation of FPV, the U-value and Albedo should be customized differently as compared to LPV. For that reason, in this study, these parameters are customized in PVsyst during simulation to reach the true cost of energy and other technical and performance parameters. Moreover, no study has been reported in the literature concerning forest absorbing carbon emissions analysis along with environmental analysis. As well as previous studies have focused on limited decision parameters, mostly NPV and LCOE to reach the optimal decision regarding the techno-economic feasibility of FPV systems. In contrast, this study has focused on various techno-economic, performance, and environmental decision parameters at the same time. A comparative analysis of previously reported studies and the contribution of the proposed study is summarized in Table 5. Likewise, similar studies have conducted in (Ma et al., 2023) where concentrated solar power, offers reliability and dispatch by complementing extensive thermal energy storage. The concerned stability regions can-be tackled accurately for grid-connected systems, by employing a nonlinear multi-parameter analysis method based on tracking limit cycle amplitudes (Yao et al., 2024) and can mitigate consumption conflicts with the potential to meet total electricity demand (Yang et al., 2024).
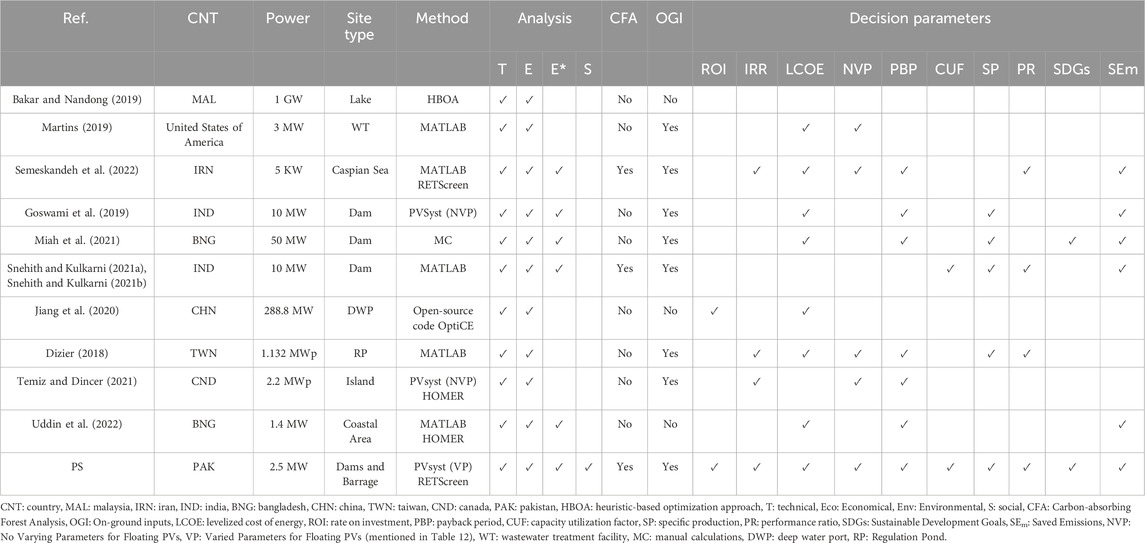
Table 5. Summary of major carried literature review and contribution of the proposed study.
The current study will examine the technical, economic, and socio-environmental benefits of a 2.5 MW grid-connected FPV system in five climate zones and propose a strategy for installing an FPV system in the most favorable climate zone to tap new technology-based renewable potential and to improve the country’s current energy mix. To the best of the authors’ knowledge, no study in the literature has provided a thorough feasibility analysis of significant water bodies. The majority of the research examined just one or two climatic scenarios to assess the viability of floating infrastructure. This study encompasses a variety of meteorological zones with an emphasis on the country’s current climate conditions. Additionally, the majority of earlier studies did not use on-ground inputs, whereas proposed investigations concentrate on on-ground inputs to determine whether the proposed architecture is feasible. From an environmental analysis point of view, the literature has substantially focused on only emitted carbon emissions. No study regarding FPV focused on providing an alternate solution for the mitigation or absorption of these carbon emissions. The current aims are to conduct forests absorbing carbon emissions analysis along with carbon emission analysis to carry a policy solution to absorb the same carbon emissions. In a nutshell, the major contribution with respect to the reviewed literature is shown in Table 5.
This paper is organized as follows: Section 1 carried the introduction of current energy scenarios across the globe and more specifically in Asian countries. Section 2 carried the history behind applications of FPV and some major associated projects across the globe are summarized. In Section 3, a literature work is summarized, and research gaps are identified. The methodology is summarized in Section 4. In Section 5, results and discussion are carried out briefly. In Section 6, tracking FPV is discussed and in Section 7, the limitations of the FPV plant are discussed. Finally, the policy recommendations are carried out in Section 8 and the paper is concluded in Section 9.
FPV plants are well-established technologies. FPV can be installed on various sites mainly categorized as man-made or artificial water bodies, industrial and agricultural water bodies, and offshore water bodies (Where Sun Meets Water, 2019). In this research, man-made or artificial water bodies are considered like dams and barrages to perform multidimensional analysis for finding out the most practical site for FPV installation. Furthermore, these sites are divided into subcategories explained in Figure 1A.
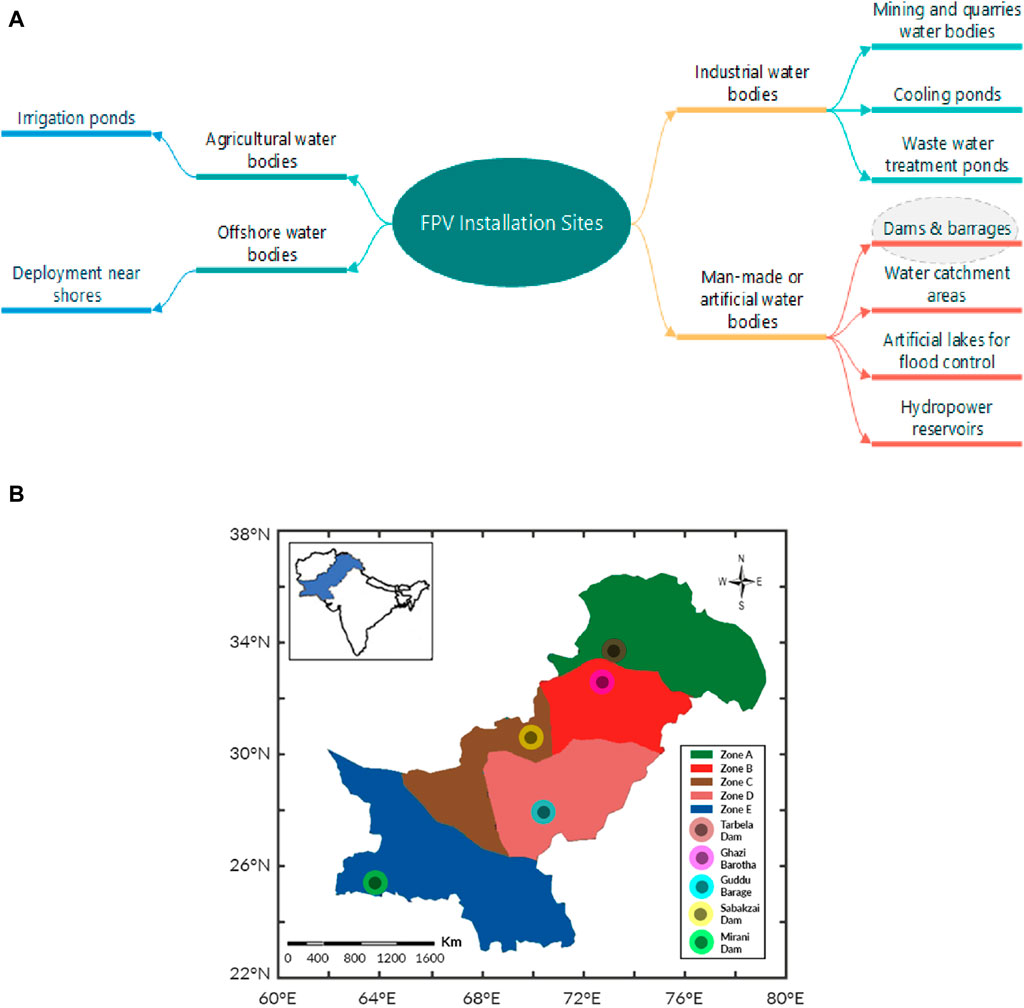
Figure 1. (A) Potential sites for FPV power plant installation. (B) Geographical placements of the five climate zones.
To examine the most essential impact characteristics, five representative sites including Zone A dam, Zone B dam, Zone C dam, Zone D dam, and Zone E dam were selected to represent the five climatic zones for the techno-economic-environmental and social analysis of a 2.5 MW FPV. Table 6 offers coordinate details for selected sites, and cities, whereas Figure 1B depicts the geographical placements of the five climate zones. Solar PV systems with a 1 MW capacity require around 20,000 square meters of land to install (Where Sun Meets Water, 2019). Approximately 50,000 square meters of land would be saved by installing a 2.5 MW FPV system. In this study, the discount rate and inflation rate are taken as 9.75% and 8.5%, respectively.
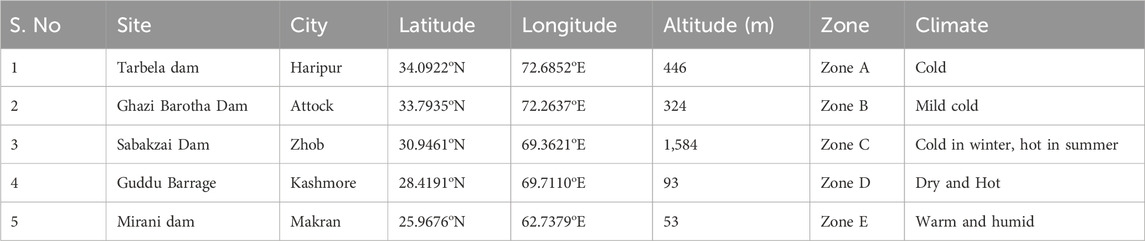
Table 6. Coordinate details of selected sites.
PVsyst is the most widely used simulation tool for assessing energy production and designing optimal solar power systems. It uses data on meteorological irradiation resources and PV system components, as well as a lot of knowledge of PV technology. PVsyst may therefore help with PV system component comprehension and, as a result, system design. Many parameters affect PV system performance, including tilt angle, orientation, geographical location, PV panel type, and solar global horizontal irradiation. This is one of the most reliable strategies for enhancing PV plant design. This is the most comprehensive modeling tool for the design and economic analysis of PV power plants. The comprehensive flow for PVsyst software’s simulation technique is depicted in Figure 2A, B shows the cross-functional methodology of the carried research.
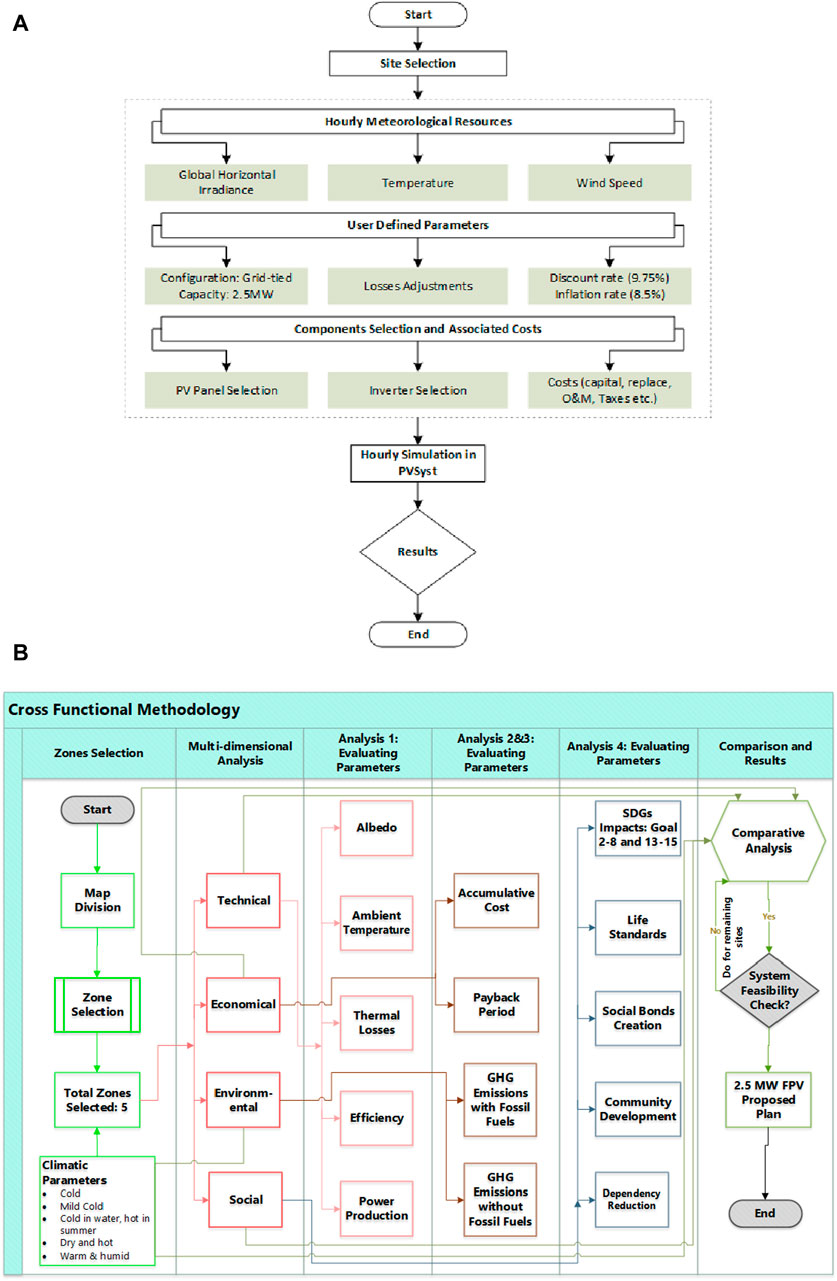
Figure 2. (A) PVsyst simulation framework. (B) Cross-Functional Methodology of the proposed 2.5 MW FPV plants at five climatic zones.
Table 7 shows an overview of performance parameters for IEC 61724. IEC 61724 standards were established by the International Electrotechnical Commission, and various countries throughout the world have adopted them to meet the quality values of their products. His standard specifies a method for assessing the performance of different types of on-grids, off-grid, and hybrid PV systems. IEC 61724 offers a consistent baseline for assessing PV plant performance across geographies. According to the standard various measurements, such as irradiance, ambient temperature, wind speed, module temperature, voltage, current, and most importantly developed electricity measurement, are required for accurate performance evaluation of the PV system. All these measurements must be done with a precision of 1%–2% and these quantities must be measured within a sample period of fewer than 10 min (Srivastava et al., 2020).
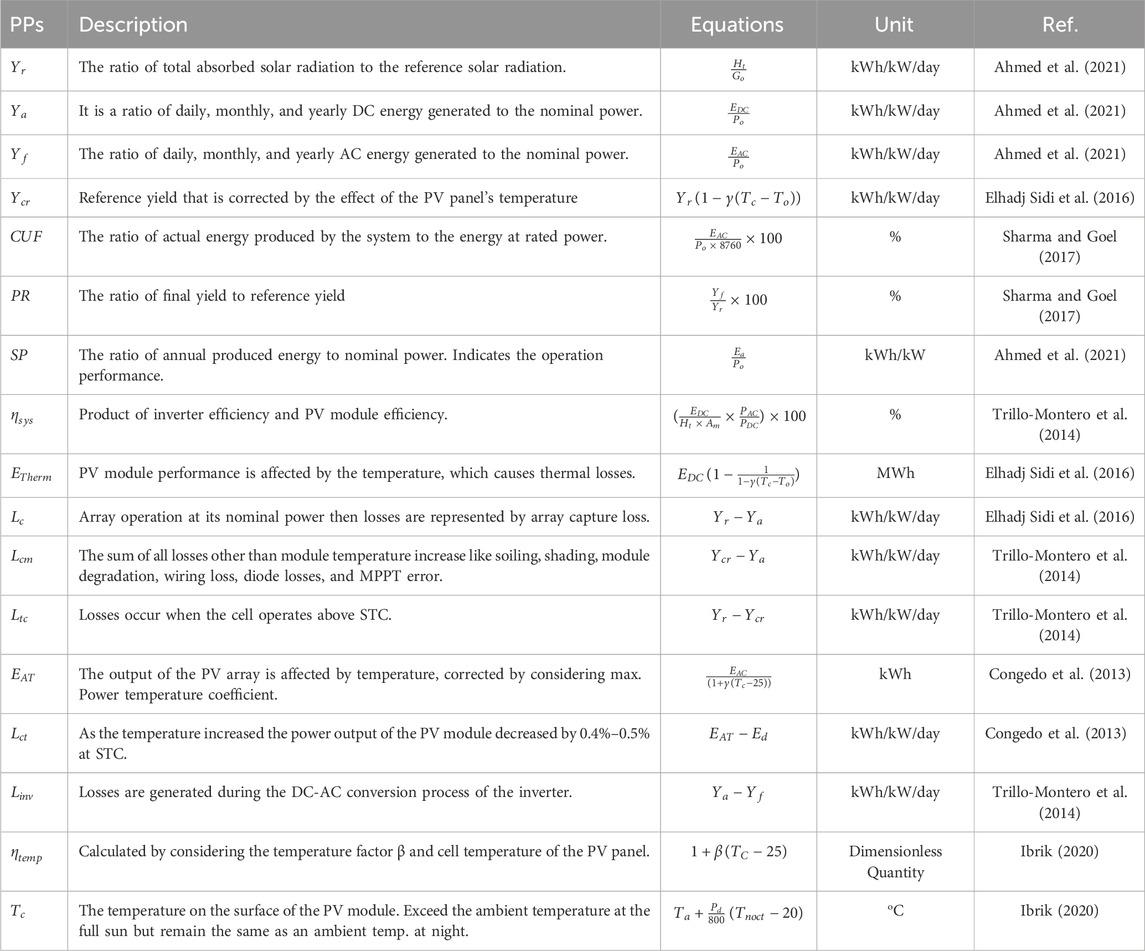
Table 7. Performance parameters (PPs).
Given South Asia’s usual weather pattern, it is necessary to assess the following site-related climatic factors including solar irradiance, wind speed, and ambient temperature to guarantee that FPV platforms endure as long as they’re needed. These factors should be assessed with comprehensive detail since they have strong relations with the final output production and performance parameters of FPV plants.
1. Maximum wind speed
2. Maximum velocity of the water current
3. Maximum wave height and frequency
4. The composition and quality of the water (to assess corrosion risk)
The climatic data utilized in this investigation are taken from weather station Meteonorm 8.0 (PVsyst). Table 8 summarizes different parameters like wind speed, storage capacity, global horizontal irradiance, horizontal diffused irradiance, and ambient temperature for selected sites.
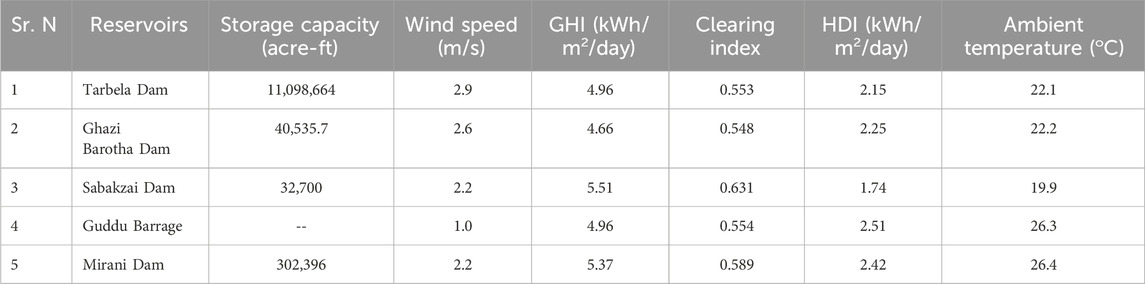
Table 8. Storage capacity, wind speed, GHI, Horizontal Diffused Irradiance, and temperature of selected sites.
Because the structure will rotate and move as a result of the wind, wind speed influences generation efficiency. To ensure the dependable and safe operation of an FPV system under extreme weather conditions, all extraneous conducting parts (e.g., PV module frames, structural metal, and junction boxes) should be bonded and grounded to the water surface. Any maintenance work on FPV should be avoided during rain or storms since the internal lightning protection system largely supports equipment and conducting components. Figure 3 depicts the monthly average wind speed (m/s) at five different locations. At various turbulence intensities of wind, the first row of the floating solar panels displayed the highest drag and lift coefficients. Due to the first row of solar panels’ wind-shielding properties, the drag and lift coefficients of the solar panel array steadily reduced along the direction of the wind. Additionally, the turbulent kinetic energy enhanced the drag and lift pressures on the solar panels, particularly for the first row of panels. A distinct flow and recirculating zone was created behind the first row of solar panels as a result of wind pressure impinging on them. Due to the first row’s shielding effect, the wind speed gradually dropped as it moved down the solar panel array. Therefore, while designing an FPV system, the pressure on the first row of solar panels is crucial (Choi et al., 2021).
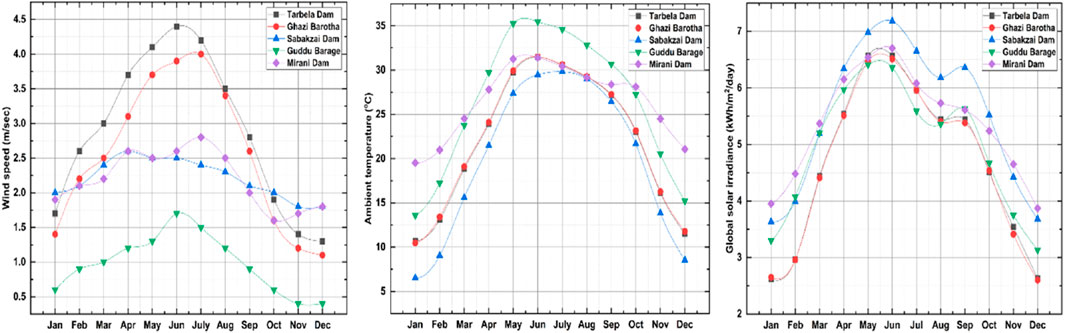
Figure 3. Monthly average metrological data; wind speed (left), ambient temperature (middle), and global solar irradiance (right) for five selected sites of respective zones.
PV modules are tested at a temperature of 25°C (STC), and heat can lower output efficiency by 10%–25% depending on the installed location. The output current of the solar panel increases exponentially as the temperature of the panel rises, whereas the voltage output decreases linearly which decreases the overall performance ratio (PR) of the system. High temperature significantly increases the heating effects within solar cells which alternately produces a thermal loss in the overall solar panel. These thermal losses further decrease the overall efficiency of a PV system. Because of the water surface, the ambient temperature of FPV always remains lower than LPVs, and the key advantage of FPV power plants is their PR, which is boosted by 5%–10% over traditional photovoltaic plants due to the natural cooling effect of the water (Kjeldstad et al., 2021). Figure 3 illustrates the ambient temperature profiles for five selected sites of the respective zones. The parameterization and conditions of sites with relevant details are shown in section 1 (sub-section 1.1) in the Supplymentry section.
The bottom-to-top versions of the intended 2.5 MW FPV system are shown in Supplymentary Figure S3. There are a total of 379 strings that are joined in a parallel arrangement where each string contains 22 series configured panels with 12 combiner boxes. A DC-AC inverter is linked in a series manner with combiner boxes and its role is to convert DC electrical input to AC. At the substation level, a network of underground cables is built to transport the power. Even though underground transmission infrastructure is more expensive than over-head, due to trains and land topologies, an underground transmission network is regarded as more reliable than an over-head transmission network in this scenario. The total required area (
Where NM is the number of the module, NS is the number of strings, SR is the spacing between rows, and
Where
Where P is the required power of the plant and
Where L is the width of the panel (0.991 m),
For the optimal absorption of solar radiation and the highest energy production, the suggested tilt angle for the FPV project is closer to the optimal angle of the site. While for the optimal generation of energy, the optimum angle is kept closer to the latitude of the respective site. For simulation studies in various climatic zones, the fixed tilt angle is mostly considered a reliable option. When adjusted to the ideal tilt angle, FPV modules produce the maximum amount of energy. The flat PV string provides 43.5% less energy than the PV string set to the optimum tilt angle of the respective site. Despite the fact, that horizontally positioned panels may benefit from water cooling more due to their proximity to the water surface, they produced the least amount of energy. This can be explained by the fact that the tilt angle optimization impact is stronger than the cooling effect. Finally, for FPVs, setting the PV modules to their optimal tilt angle is also suggested. As a result, for FPVs, adjusting the PV modules to the appropriate tilt angle is advised (Central, 2016). In this research optimum tilt angles of the suggested sites are summarized in Table 8 which was chosen in the current study through simulation in PVsyst for performance evaluation of the FPV system for the understudy site.
In this section, a comparative technical analysis of 2.5 MW solar plants in five climatic zones is offered. Furthermore, a techno-environmental analysis for each case in the specific site is described in detail. In the first fold, based on PR and specific production (SP) technical analysis of a 2.5 MW FPV plant for each under-study zone is carried out (Song and Choi, 2016; Pasalic et al., 2018). In the second fold, an economic analysis is carried out based on NPV, LCOE, PBP, etc. Similarly, in the third and fourth fold, environmental and social analyses are carried out based on balanced GHG emissions and the SDGs set by United Nations member states, respectively (El Hammoumi et al., 2021).
In the design process of FPVS using PVsyst simulation tool, various loss types are addressed to ensure a comprehensive and accurate representation of the system’s performance. Here is a detailed explanation of how each of these losses is considered includes incidence angle modifier (IAM) losses, soiling losses, irradiance losses, thermal losses, module quality losses, mismatch losses, module degradation loss, ohmic wiring losses and auxiliaries consumption: The details are shown in Section 2 of the Supplementary Material.
By incorporating these various loss types, PVsyst provides a comprehensive tool for engineers and designers to assess the performance of floating PV systems. This enables more accurate energy yield predictions and informed decision-making in system design and optimization.
For the performance evaluation of FPV, several parameters must be altered throughout the simulation shown in Table 9. One of these is albedo, which measures the amount of solar light reflected and ranges from 0 to 1. A dark body that absorbs all radiation has an albedo value of 1, whereas a body that reflects all irradiance has an albedo value of 0. The simulation uses a value of 0.2 albedo for LPV; however, because of the water surface, the value for FPV will be 0.06 (El Hammoumi et al., 2021). For this study, we are considering an albedo coefficient value of 0.06 to indicate the presence of water around FPV. In the literature, it is observed that the maximum value of albedo for the ocean is 10% while the minimum would be 0.05 (Pasalic et al., 2018). Albedo coefficient can be calculated by Eq. 6.
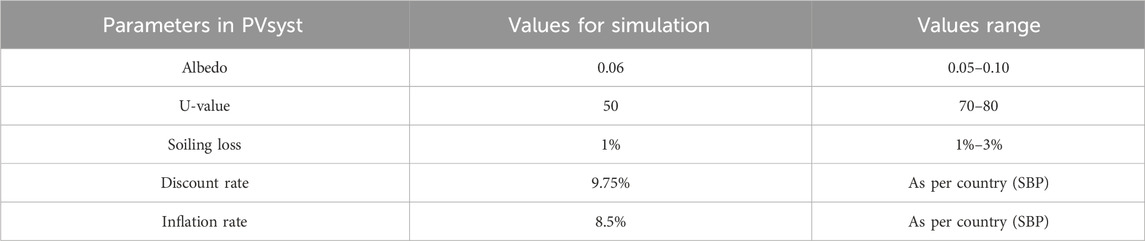
Table 9. Parameters of FPV in the simulation tool (Haas et al., 2020; Pasalic et al., 2018; Song and Choi, 2016).
Where
Capacity utilization factor, system production, specific production, and array losses are the fundamental evaluation parameters for technical analysis. The results for these technical parameters for all five selected sites are summarized in Table 10. The analysis results of the on-grid FPV system in five zones revealed that the Zone C dam received the highest solar radiation, with an average of 7.18 kWh/m2 during June. While Zone B dam has the lowest solar radiation intensity, with an average of 2.6 kWh/m2 during December. The power output at Zone C dam is rather high as compared to other sites, based on solar insulation values for five selected Zones. Figures 2, 3 depicts the monthly average global horizontal solar irradiance (
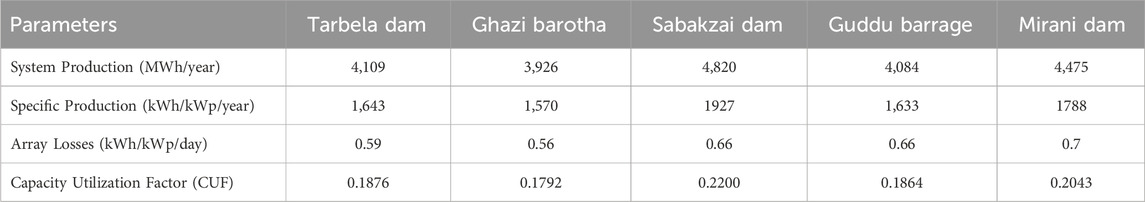
Table 10. Major Technical Analysis results of five selected sites.
Where Tc is module temperature (oC), and Gt is the solar irradiance (W/m2). The temperature of the module and air-water mixture should be examined because the temperature has a direct impact on the FPV power outcome. Figure 4A depicts the average monthly energy production by a 2.5 MW FPV plant at five under-study climatic zones. The lowest energy production for Zone B Dam was 227.3 MWh experienced in February, while the highest was 395.8 MWh in May. The Zone C dam produced the least amount of electricity (333.4 MWh) in February and the highest amount of energy (455.5 MWh) in October. The lowest energy production was 244.9 MWh in February and the highest was 406.4 MWh in May at Zone A dam. The Zone D dam produced the least energy (277.6 MWh) in January and the highest energy (384.7 MWh) in May. The minimum energy produced at Zone E dam was 305.6 MWh in February and the highest was 408.5 MWh in October. Figure 4B displays the percentage of annual energy output in chosen zones; Zone B Dam has the least energy production (3,926 MWh) while Zone C dam has the highest (4,820 MWh). Table 11 compares the major technical analysis simulation results for all investigated locations at their respective zones. A mathematical relation given in Eq. 8 can be used to compute the system’s specific production.
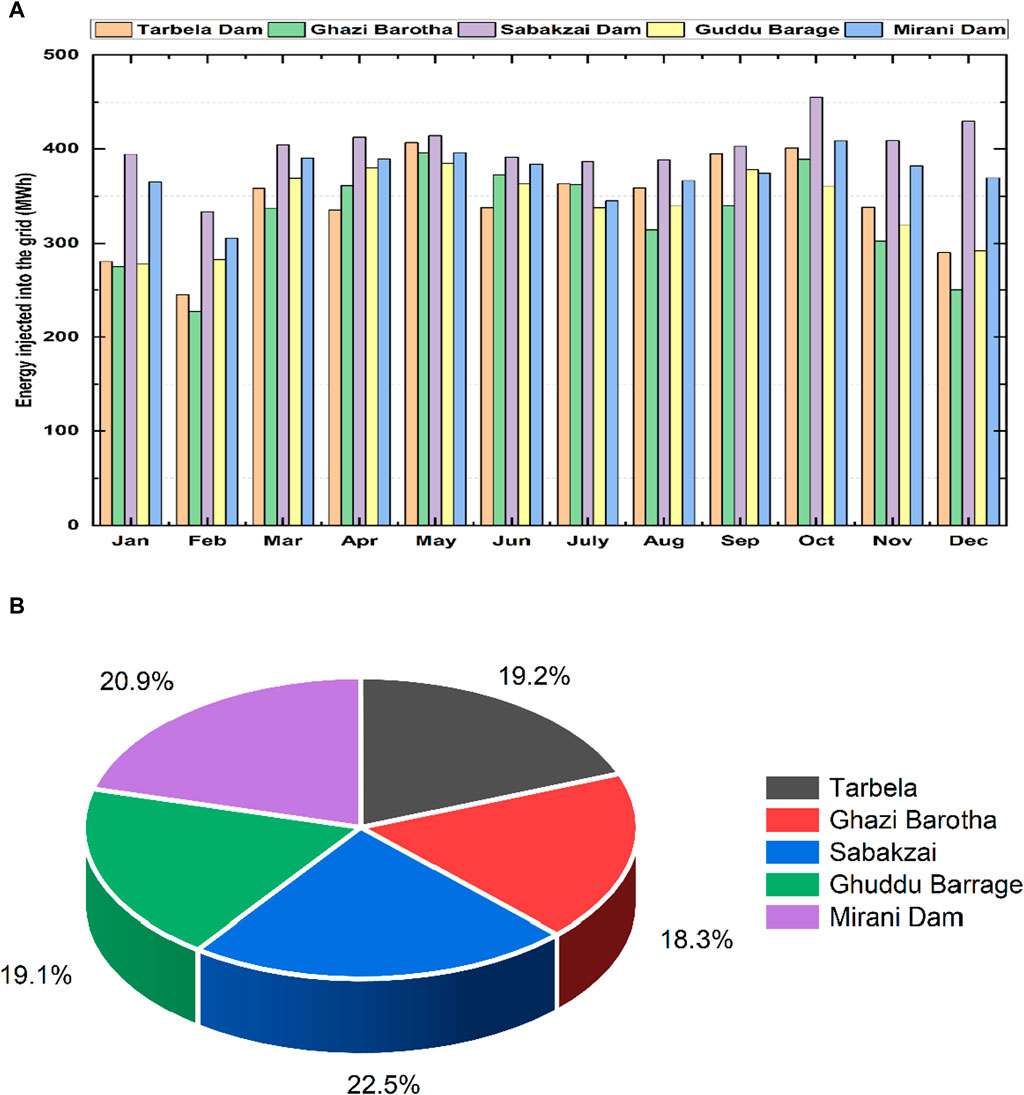
Figure 4. (A) Energy injected into the grid of five selected sites. (B) Grid injected share of annual energy output in the percentage of five under-study sites of respective zones.

Table 11. Optimum tilt angles for a selected solar panel at each under-study site.
In the above relationship,
Where S is the solar radiation intensity incident expressed in (W/m2). According to PVsyst simulation results, the required module area for a 2.5 MW FPV plant is 13,816 m2. The CUF also termed as capacity factor indicates the relationship between actual energy generated at a rated capacity of a system, calculated by Eq. 12.
Where
Figure 5 shows the comparative relation between different techno-economic and performance parameters of all five selected sites. Relationship indicating a direct relation of CUF with system production. Zone C dam experiences the highest CUF of 22% since it has the highest system production of an overall 4,820 MWh/year. In contrast, the Zone B Dam has the lowest overall system production that’s why it receives the lowest CUF of 17.92%.
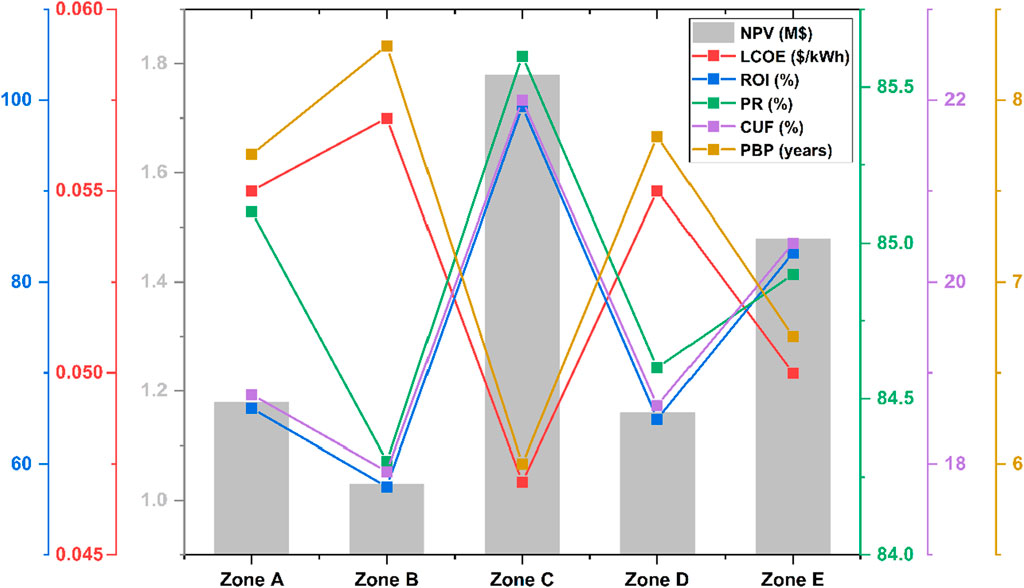
Figure 5. Comparative analysis of different techno-economic and performance parameters of all under-study five sites.
Although RE has some integration problems, it improves the voltage stability of the electrical network. Because the number of installations has increased, there has been a progressive growth in the integration of PV energy during the past few years. A solar panel is simply a collection of solar cells, therefore large solar panels are required to produce sufficient electricity. Because solar radiation occurs naturally, DC output is produced by PV arrays. Due to factors such as temperature, shade, dust, tilting, etc., solar cells lose some of their efficiency. It is anticipated that the price of a PV panel will reduce over time as this technology develops significantly.
In addition to expenditures, a full cost and profitability analysis of the FPV system should address the factors that directly impact energy output. Consider the economic aspects while evaluating the benefits of investing in FPV systems. Appropriate economic analyses, such as Levelized cost of energy (LCOE), Rate of Investment (ROI), Internal Rate of Return (IRR), and net present value (NPV) may ensure the profitability of installed FPV systems. Annual savings can be calculated by Eq. 13.
Where ET is the total energy supplied to the grid in kWh and
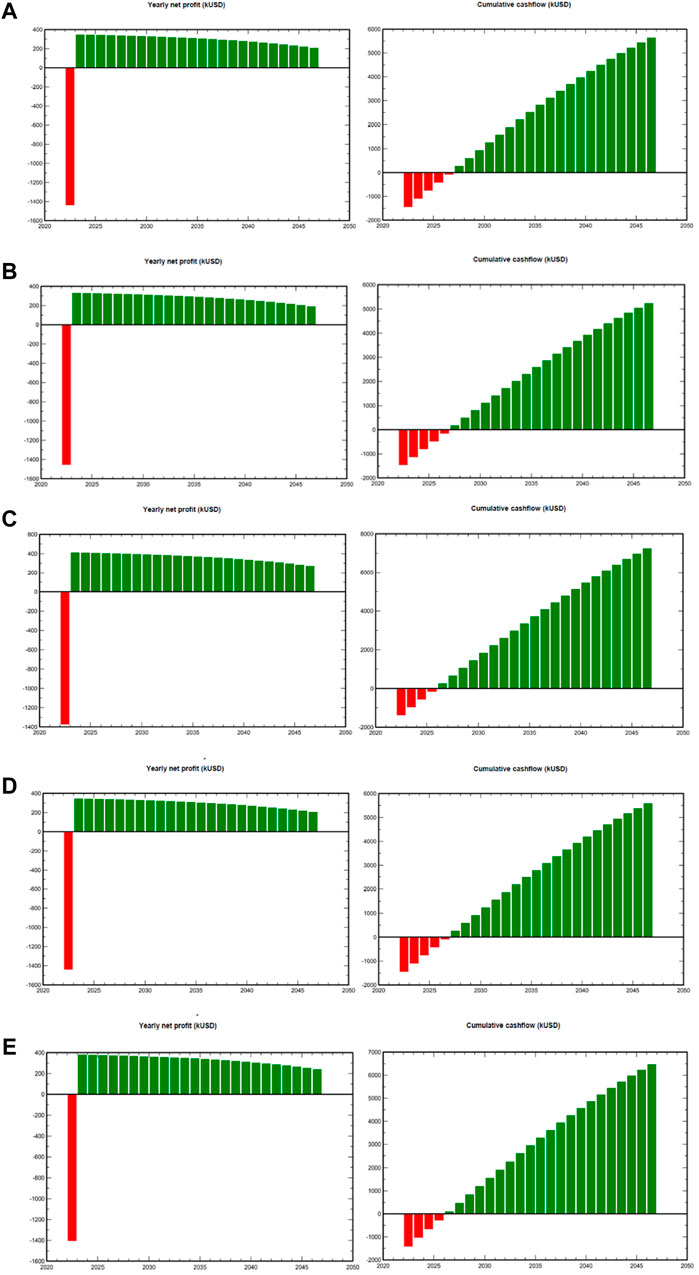
Figure 6. Yearly net profit and cumulative cash flow (A) for Zone-A dam, (B) for Zone-B dam, (C) for Zone-C dam, (D) for Zone-D dam, and (E) for Zone-E dam.
Where
Table 12 includes the cost of system components like solar panels, inverters, wires, and so on, as well as installation, commissioning costs, and taxes. For all proposed plants in the chosen regions, the system costs are identical. The yearly operating cost including maintenance costs (salaries, repair, cleaning, and security fund) would be approximately $23250. The operation and maintenance costs of large-scale projects cannot be overlooked. It is important to mention here that the cost associated with land is not included in this analysis because, as previously stated, FPVs are installed on water bodies and hence land requirement holds no significance.

Table 12. Cost detail of the FPV system.
PV module degradation and aging have a significant impact on the dependability and life of PV power facilities. The real degradation of PV modules is a source of concern for owners and other beneficiaries, as it has an impact on the power plant’s financial outcome. The performance of FPV power plants and their degradation over time is investigated and results showed that it has an impact on financial factors as well; the Levelized cost of electricity (LCOE) is 2.5% higher than the LCOE computed with standard degradation (Coakley, 2003; Rosa-Clot and Tina, 2020; Goswami and Sadhu, 2021; Lindholm et al., 2021).
The internal rate of return (IRR) is a measure of a project’s profitability. If the IRR is significant, the project will be more profitable in the long run. The IRR is directly proportional to the project’s profitability when evaluating the value of money over time as shown in Eq. (16).
The following Eq. 16 demonstrates and mathematical relation for calculating the IRR. Eq. 17 shows how to determine the net present value (NPV) of the after-tax cash flow of the FPV plant.
Where

Table 13. Performance analysis of all five under-study sites.
From an economic standpoint, Figure 7 shows that FPV can already compete with LPV [55-56]. As a result, while FPV deployment is already profitable, it may not be as profitable as LPV yet. Because of its early age, the cost of floating structures still plays a large role in FPV economics, but it is likely to decrease in the future. Furthermore, rising land costs may narrow the difference between FPV and LPV capital costs, favoring FPV installation. FPV prices are greater than conventional PV due to civil works, unique equipment, mounting, and floating structures. Because the FPV involves floating structures, mooring systems, and anchoring, the floating structures account for around a quarter of the total cost of installation. The costs associated with FPV are influenced by various general parameters including project location, water body height, water level variation, topography, plant size, and wind speed. The chosen anchoring structure is the most cost-effective in real projects since it is independent of the reservoir’s geography and structure [56-57].
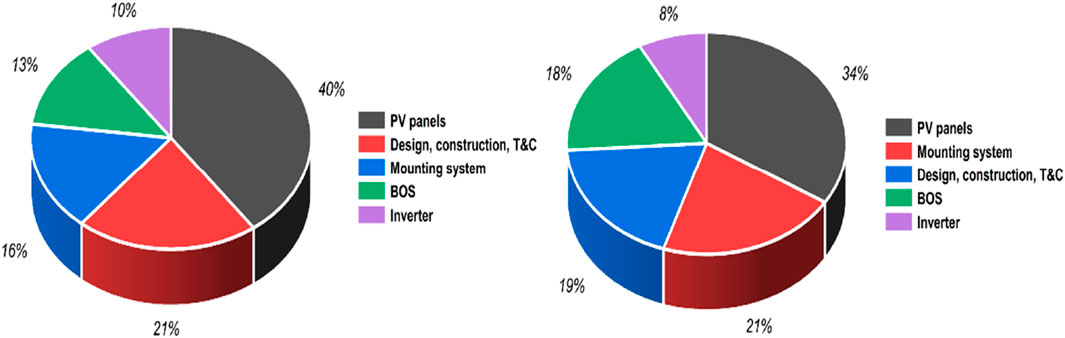
Figure 7. Major components-wise cost analysis of LPV (left) and FPV (right) plants.
Here, performance ratio (PR), normalized production (NP), system losses (SL), and payback period (PBP) are considered evaluation indicators for performance analysis. NP and PR are the most relevant measures for comparing the performance of different sites.
Figure 8 demonstrate that Zone C dam has the greatest normalized production with a PR of 85.6% and the shortest payback period (6 years) of the five locations that were chosen. Sabakzai Dam’s normalized production and return on investment are higher, at 5.28 (kWh/kWp/day) and 99.3%, respectively. Zone B dam, on the other hand, has the lowest values for performance ratio, payback period, normalized production, and return on investment, with values of 84.3%, 8.3 years, 4.3 (kWh/kWp/day), and 57.5%, respectively. The detailed performance analysis for all five sites is summarized in Table 14. The PR of the system can be measured according to Eq. 18.
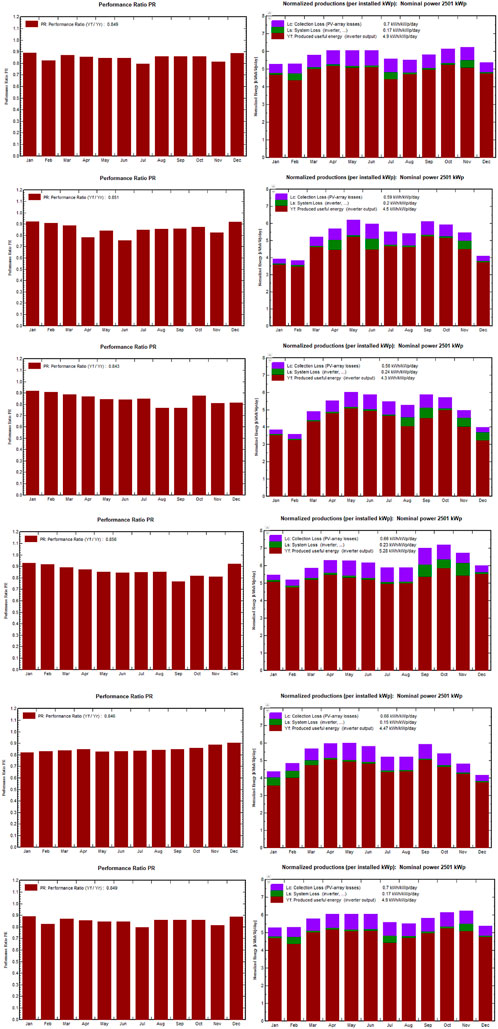
Figure 8. Performance ratio and Normalized production; (A) for Zone A dam, (B) for Zone B dam, (C) for Zone C dam, (D) for Zone D dam, and (E) for Zone E dam, respectively.
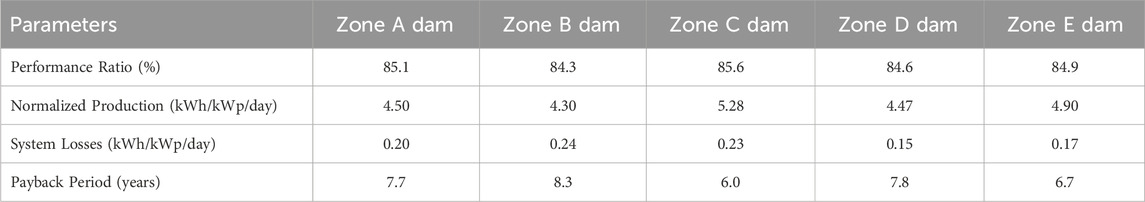
Table 14. Performance analysis of all five under-study sites.
Where ET is the total energy supplied to the grid in kWh, Po is the rated output power from FPV in kW, and IPOA is the plane of array irradiance in
Where m is the number of minimum years by which the total revenue of the system is larger than the total cost,
All of the performance analysis’s findings indicate that the 2.5 MW FPV project’s installation will be more advantageous at Sabakzai Dam than at Zone B dam. From Figure 8, PBP shows an indirect relation with the PR. As the PR of the system increases, the time required to recover the investment on a project gets shorter. For example, Zone C dam has the highest PR i.e., 85.6%, consequently, it receives the lowest PBP of 6.0 years. In contrast, Zone B Dam experienced the highest PBP of 8.3 years due to its lowest PR of 84.3 as compared to all other four sites.
The FPV has been shown to have fewer negative consequences on the environment than the SPV. Because of their economic viability and environmental stability, FPVs help to maintain ecological equilibrium. The capacity of FPVs is 10.2% higher than that of LPVs, FPVs save a significant amount of coal while also lowering GHG emissions. Factors like GHG emissions, wind speed, waves on water, water temperature (Acharya and Devraj, 2019; Micheli, 2021), soiling, algae growth, water evaporation, and deforestation predict environmental feasibility. The reduction in water evaporation may be seen in an environmental analysis; for each megawatt of FPV installed capacity, roughly 1,500 m3–2000 m3 of water is saved from evaporation (Rosa-Clot et al., 2017; Jeong et al., 2020).
The exploration into the interplay between water, particularly humidity, and FPV systems reveals intriguing insights. Given that the development of FPV systems is still in early stages, the investigation is focused on discerning the unique performance characteristics of FPVs compared to their LBP counterparts. The key findings and observations from the literature are outlined as follows:
The FPV system demonstrates a lower operating temperature compared to the LBP system, with a temperature difference of 7 °C. This indicates that the FSP system benefits from the cooling effect provided by the water surface.
The FPV system exhibits higher relative humidity levels compared to the LBP system. This elevated humidity is identified as having an impact on the performance ratio (PR) of the FSP system. The interplay between humidity and system performance is a crucial aspect explored in the study.
Despite the influence of relative humidity on the PR of the FSP system, the study notes that the FPV system outperforms the LPV system in terms of energy output. This suggests that, while humidity influences system performance, the FPV system’s overall energy yield surpasses that of its land-based counterpart.
These insights into the nuanced relationship between water, humidity, and the performance of FPV systems provide a comprehensive understanding of the topic. The observed temperature reduction in the FSP system, attributed to its water-based operation, underscores the cooling benefits of the floating platform. Additionally, the impact of higher relative humidity on the performance ratio highlights the need for a thorough understanding of environmental factors in FPV system design (Goswami, 2023).
Changes in environmental conditions, such as temperature and solar radiation impact the parameters like resistance, saturation current, and ideality factor etc. Higher temperatures typically lead to an increase in saturation current and a decrease in resistance, affecting the overall performance. Additionally, solar radiation variations and humidity levels influence the ideality factor, contributing to the dynamic response of the floating solar module under different climatic conditions.
Potential Evapotranspiration (PET) is a method of calculating evapotranspiration from entirely submerged lakes and reservoirs, as well as specific sites with endless water sources. It is useful for figuring out how installations on the surface of water bodies affect climate change. PET values are useful for determining a region’s atmospheric water requirement. It is measured in millimeters per day or millimeters per year. It can be determined using Eq. 20.
Where k is the proportionality constant,
Where
Where EF is the emission factor and AG is the annual energy generation. The results of the environmental analysis for five selected sites for the FPV plant are shown in Table 15. According to the table, the largest replaced emissions are found in the Zone C dam, while the lowest are found in the Zone B Dam. Similarly, Zone C dam has the highest emissions balance of saved CO2 emission at 43125.7 tCO2 while Zone B Dam has the lowest at 34283.8 tCO2. Figure 9 depicts the CO2 emissions saved throughout lifetime of a project for all five selected sites of respective zones. In this study, only CO2 emissions are considered for environmental analysis, because carbon emission is a major factor that contributes to almost 90% of overall pollution. In the proposed 2.5 MW FPV systems, the major portion of the GHG emissions is associated with the manufacturing, installation, operation, and maintenance of the system.
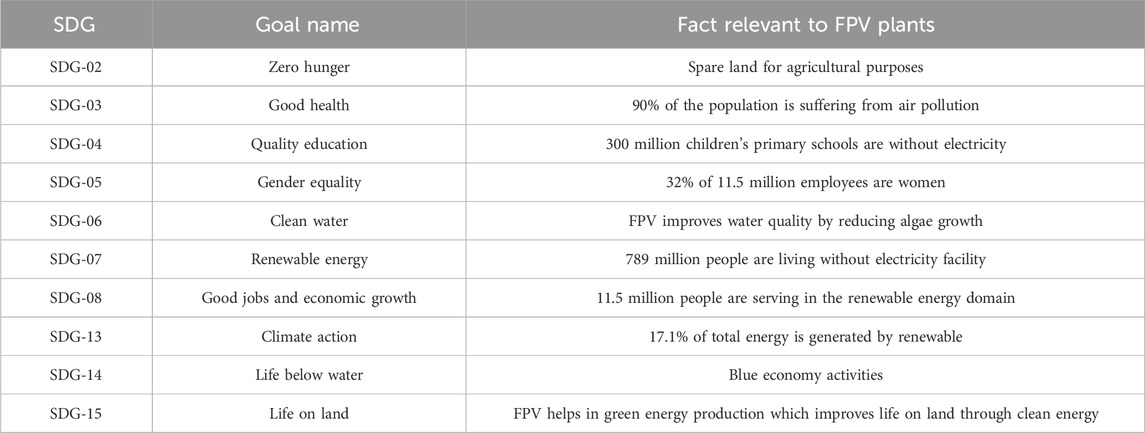
Table 15. Major Socio-Analysis outcomes of five selected sites (Exley et al., 2021).
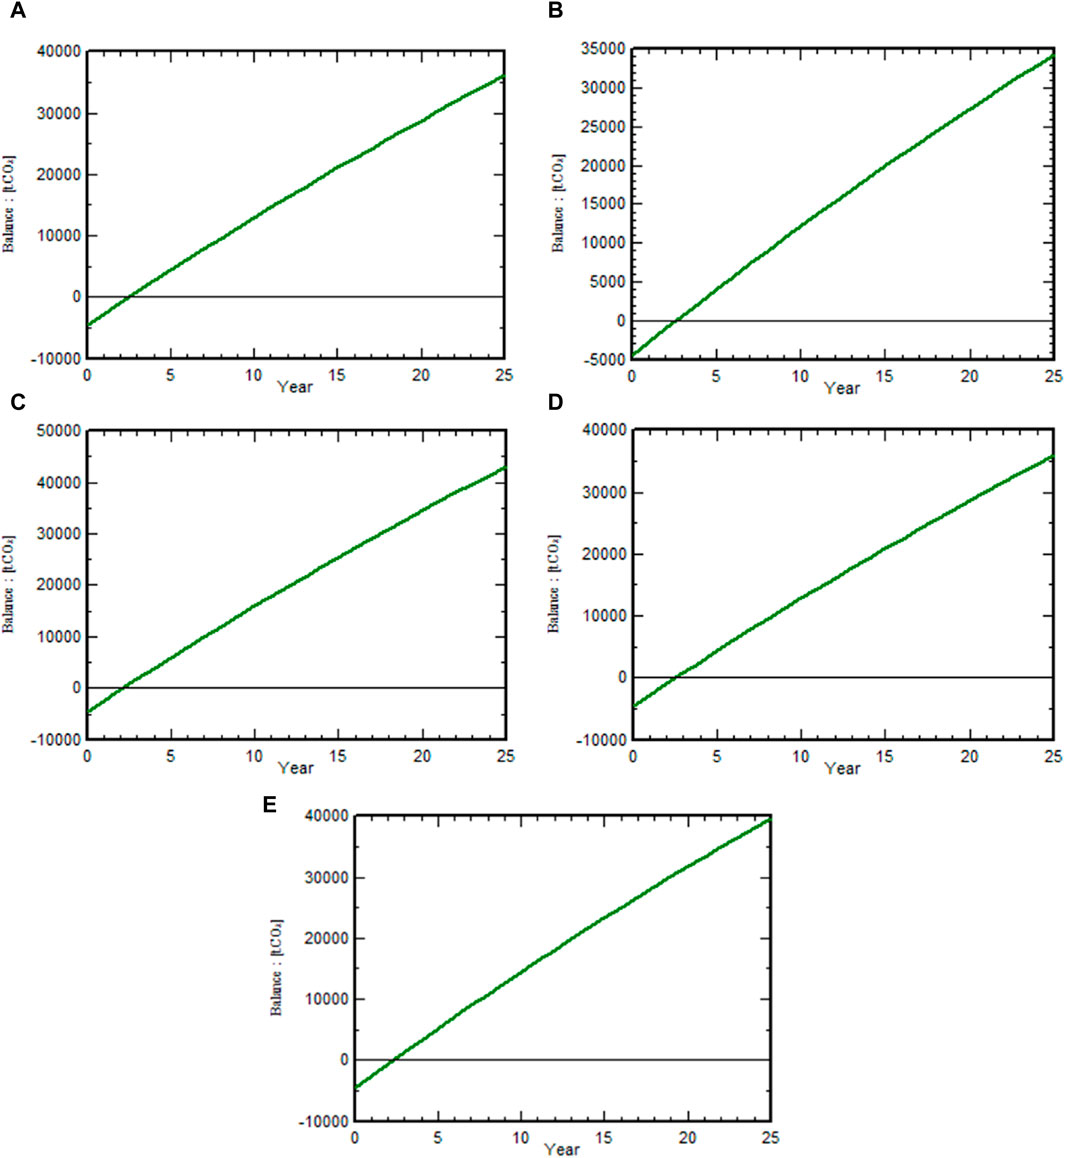
Figure 9. CO2 emissions balance (A) from Zone A dam, (B) from Zone B Dam, (C) from Zone C dam, (D) from Zone D dam, and (E) Zone E dam, respectively.
An emission absorbing forests analysis is carried out in RETScreen Expert based on the amount of carbon emission balanced from the system in the presence of grid-connected operation mode. The forest absorbing areas are evaluated in hectares concerning balanced GHG emissions. RETScreen Expert offers an energy module that may be used to monitor residential energy usage for liquefied petroleum gas (LPG), biomass, diesel generators, and kerosene oil. Furthermore, an equivalent forest carbon-absorbing area is provided to absorb carbon emissions from such non-conventional energy resources (Ali et al., 2021). Figure 10 shows the land (hectares) required for forests to absorb carbon emissions concerning overall emissions balanced by each under-study site. As more carbon emissions are balanced, more area is required for the forest to absorb those carbon emissions. For example, Zone C dam showed the highest index of 43125.7 tons of emissions equivalent to 3924.439 ha of forests absorbing carbon. In a nutshell, 189056.4 tons/year of emissions will be emitted from all five under-study sites, and about 17204.133 ha of forests are required to absorb the emissions from all sites.
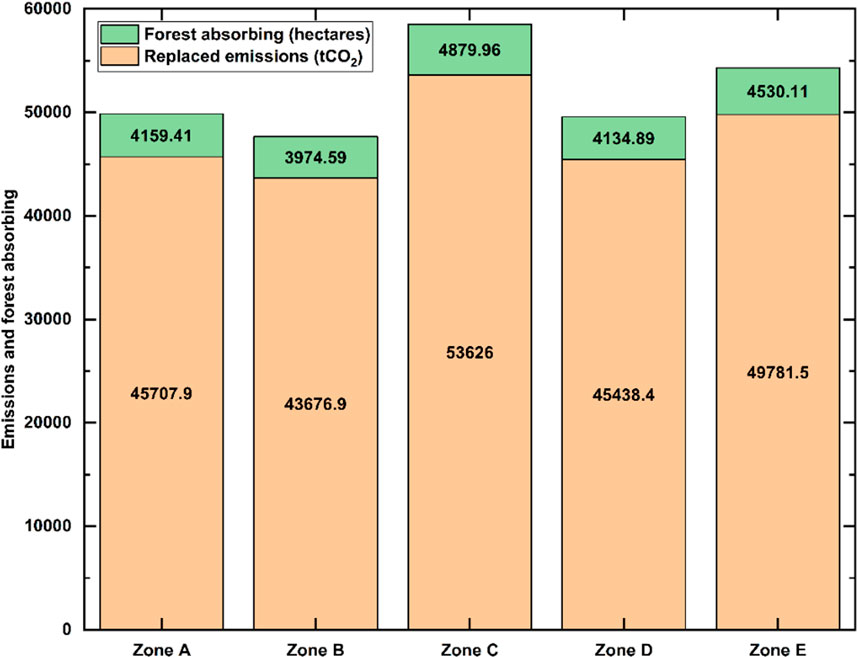
Figure 10. Land (hectares) required for forest absorbing balanced carbon emission for five under-study sites.
Bio soiling, especially from bird droppings, causes an increase in O&M costs as well as accelerates degradation. Solar panels require a lot of water to clean due to dust accumulation on the panels, yet there are few soiling losses and the FPV requires less water (Jeong et al., 2020). Before installation, a survey of bird species and numbers should be conducted. Natural cooling of water contributes to reducing cell degradation and maximizing lifetime. Because of the cooling impact of water, the average module temperature for FPV is 4.9% lower than with LPV, this is attributed to an increase in the power generation of FPV.
The efficiency of SPVs was severely reduced due to high temperatures; literature suggests that when the operating temperature of the panel hits 60°C, the cell efficiency drops by 10%. Surface temperature influences the quality and performance of PV cells (Li et al., 2012; Chander et al., 2015). Several simple and dependable solutions have been developed for ground-mounted PVs to improve conversion efficiency by collecting thermal heat and keeping the surface temperature low (Chander et al., 2015; Siecker et al., 2017). Another advantage of FPV for the environment is that it reduces the erosion of reservoir embankments by lowering wave impact. Implementing such an FPV system on a nationwide basis would result in increased energy output.
Increased use of renewable energy resources is the only way to accomplish the SDGs, especially SDG-7. The best solution for sustainably producing green energy is probably FPV technology on underutilized water bodies because large-scale PV plants take up valuable land and hence prevent redevelopment. The FPV technique could improve the efficiency of the region’s energy and water management. In dry and semiarid areas, integrating energy and water can improve long-term utilization and give societal benefits. FPV plants enhance the aesthetics, preserve important land for agriculture or other uses, and rehabilitate damaged areas while generating clean energy. There is a total of seventeen SDGs with the phrase “leave no one behind,” implying that the goal must be met by everyone. Table 15 shows numbers, names, and relevance of the SDGs to FPV plants. In just 9 years, 280 million people gained access to safe, affordable power and the positive influence can be seen in the fact that renewable energy replaces kerosene oil as a source of electricity 40% of the time. By 2050, an additional 350 GW of ocean offshore renewable energy capacity is expected. Wind, tidal, thermal, waves, FPVs, and salinity gradient technology are all used in ocean offshore renewed energy.
This study is novel in that it suggests the first FPV project because none have yet been developed for the specific Asian country. To prove that the suggested study is preferable to the LPV project, it is necessary to compare the simulated results of the Zone C dam with the actual results of the 2.5 MW on-ground PV project installed for the cement factory at Fateh Jang. Renewable Stars Private Limited assists in the collection of real-time on-site data for the 2.5 MW LPV system installed in Fateh Jang. Table 15 displays the comparative analysis and detailed results validation. According to results validation and comparison, the proposed highest feasible FPV system has a significant edge over the on-ground PV system in terms of techno-economic, performance, and environmental indices.
According to collected data, the Fateh Jang project’s efficiency is 13.8%. Sabakzai Dam, which is the most feasible location, has better CUF, final yield, normalized production, saved GHG emissions, and specific production than the Fateh Jang on-ground project. Sabakzai Dam’s performance ratio is 6.4% greater than that of Fateh Jang Dam due to the system’s increased production of 653 MWh per year. FPV projects, however, have a higher project total cost than LPV systems which raises the payback period. These higher costs of FPV over PV systems are due to additional equipment expenditures during project installation. Since the initial capital cost of FPV is 18% higher as compared to the on-ground PV system, that’s why the payback period of the FPV system increases by almost 43.33% as compared to the PV system. In addition, the proposed FPV system produces almost 1.5% more carbon emissions as compared to the on-ground PV system. This is due to the structure manufacturing of the FPV system which is mostly based on high-density polyethylene material which poses an additional carbon emission on the system as compared to the PV system. Kindly refer to Table A1 in the appendix section.
In this study, a techno-economic and sustainability assessment analysis of a grid-connected FPV system is carried out for five different climate zones. Techno-economic and environmental analyses are carried out based on different decision indicators like PR, CUF, LCOE, NPV, PBP, ROI, and GHG emissions. Zone B dam appears to be the least feasible site with LCOE of $0.057/kWh and NPV of million $1.0256. On the other hand, Zone B dam is the most feasible location with LCOE of $0.047/kWh and NPV of million $1.7705. While socio analysis is carried out based on SDGs especially (SDGs 2-8 & 13-15). The detailed multi-dimensional analysis showed that all selected sites (dams and barrage) in respective climate regions are feasible for the installation of a 2.5 MW FPV system. Zone C dam among all sites showed a better performance in terms of the proposed analysis. On the other hand, Zone B Dam showed the least feasible performance amongst all selected sites under the same evaluation criteria. The most practicable location is Zone C dam, which has a PR of 85.6% and a PBP of 6 years. The least feasible site is Zone B dam, which has a PR of 84.3% and a PBP of 8.3 years.
In addition, equivalent forest-absorbing carbon analysis has been carried out in RETScreen Expert software for each under-study climate zone. Results showed 43125.7 tons and 34283.8 tons of carbon emissions which are equivalent to 3924.439 and 3119.826 ha of forest absorbing carbon for Zone C dam and Zone B Dam, respectively. The results of the proposed study are later validated with real-time data of the on-ground 2.5 MW PV project in Fateh Jang, which shows a significant edge in techno-economic and performance parameters for FPV as compared to the LPV system. The 2.5 MW FPV proposed system at Zone C dam has an 85.6% PR compared to the 2.5 MW LPV existing system at Fateh Jang has a 79.2% PR, indicating that FPV performs better than LPV. The proposed study can be a decision pathway toward policy optimization for the installation of FPV technology. The current study is performed on manmade and artificial water bodies. In the future, the proposed study can be enhanced to other sites like industrial, agricultural, and offshore water bodies. In addition, a similar study can be performed on small-scale ponds and lacks local rural or off-grid communities. The proposed study can lead to policy recommendations for stakeholders toward investment in FPV sector.
The original contributions presented in the study are included in the article/Supplementary Material, further inquiries can be directed to the corresponding author.
AM: Conceptualization, Formal Analysis, Investigation, Methodology, Project administration, Software, Validation, Visualization, Writing–original draft, Writing–review and editing. SK: Conceptualization, Methodology, Project administration, Resources, Software, Supervision, Writing–original draft, Writing–review and editing. AA: Funding acquisition, Methodology, Project administration, Resources, Software, Supervision, Validation, Visualization, Writing–original draft, Writing–review and editing. ZK: Conceptualization, Formal Analysis, Investigation, Methodology, Project administration, Supervision, Validation, Writing–original draft, Writing–review and editing. SA: Conceptualization, Investigation, Project administration, Resources, Software, Supervision, Validation, Writing–original draft, Writing–review and editing.
The author(s) declare that financial support was received for the research, authorship, and/or publication of this article. The author extends the appreciation to the Deanship of Postgraduate Studies and Scientific Research at Majmaah University for funding this research work through the project number (R-2024-1111).
The authors declare that the research was conducted in the absence of any commercial or financial relationships that could be construed as a potential conflict of interest.
All claims expressed in this article are solely those of the authors and do not necessarily represent those of their affiliated organizations, or those of the publisher, the editors and the reviewers. Any product that may be evaluated in this article, or claim that may be made by its manufacturer, is not guaranteed or endorsed by the publisher.
The Supplementary Material for this article can be found online at: https://www.frontiersin.org/articles/10.3389/fenrg.2024.1404777/full#supplementary-material
Acharya, M., and Devraj, S. (2019) Floating solar photovoltaic (FSPV): a third pillar to solar PV sector ? teri discussion paper:output of the etc India project. New Delhi: The Energy and Resources Institute, 68.
Ahmed, N., Naveed Khan, A., Ahmed, N., Aslam, A., Imran, K., Sajid, M. B., et al. (2021). Techno-economic potential assessment of mega scale grid-connected PV power plant in five climate zones of Pakistan. Energy Convers. Manag. 237, 114097. doi:10.1016/j.enconman.2021.114097
Akole, H. U., and Jadhav, P. S. (2018). “Floating solar plant,” in 2018 3rd international conference for convergence in technology, I2CT, 493–498. doi:10.1109/I2CT.2018.8529479
Ali, M., Wazir, R., Imran, K., Ullah, K., Janjua, A. K., Ulasyar, A., et al. (2021). Techno-economic assessment and sustainability impact of hybrid energy systems in Gilgit-Baltistan, Pakistan. Energy Rep. 7, 2546–2562. doi:10.1016/j.egyr.2021.04.036
Ates, A. M., Yilmaz, O. S., and Gulgen, F. (2020). Using remote sensing to calculate floating photovoltaic technical potential of a dam’s surface. Sustain. Energy Technol. Assessments 41, 100799. doi:10.1016/j.seta.2020.100799
Bai, B., Xiong, S., Ma, X., and Liao, X. (2024). Assessment of floating solar photovoltaic potential in China. Renew. Energy 220, 119572. doi:10.1016/j.renene.2023.119572
Bakar, M. S. A., and Nandong, J. (2019). Technoeconomic analysis of floating solar field for 1 GWh of electricity generation. IOP Conf. Ser. Mater Sci. Eng. 495, 012064. doi:10.1088/1757-899X/495/1/012064
Baptista, J., Vargas, P., and Ferreira, J. R. (2021). A techno-economic analysis of floating photovoltaic systems, for southern european countries. Renew. Energy Power Qual. J. 19, 57–62. doi:10.24084/repqj19.214
Barbir, F., Veziroglu, T. N., and Plass, H. J. (1990). Environmental damage due to fossil fuels use. Int. J. Hydrogen Energy 15, 739–749. doi:10.1016/0360-3199(90)90005-j
Campana, P. E., Wästhage, L., Nookuea, W., Tan, Y., and Yan, J. (2019). Optimization and assessment of floating and floating-tracking PV systems integrated in on- and off-grid hybrid energy systems. Sol. Energy 177, 782–795. doi:10.1016/j.solener.2018.11.045
Cazzaniga, R., Cicu, M., Rosa-Clot, M., Rosa-Clot, P., Tina, G. M., and Ventura, C. (2018). Floating photovoltaic plants: performance analysis and design solutions. Renew. Sustain. Energy Rev. 81, 1730–1741. doi:10.1016/j.rser.2017.05.269
Central, S. (2016) Sunny central 630CP-jp sunny central 630CP-jp the perfect solution for PV power plants in Japan sunny central 630CP-jp.
Chander, S., Purohit, A., Sharma, A., Arvind, N. S. P., and Dhaka, M. S. (2015). A study on photovoltaic parameters of mono-crystalline silicon solar cell with cell temperature. Energy Rep. 1, 104–109. doi:10.1016/j.egyr.2015.03.004
Choi, S. M., Lee, G. R., Park, C. D., Cho, S. H., and Lim, B. J. (2021). Wind load on the solar panel array of a floating photovoltaic system under extreme hurricane conditions. Sustain. Energy Technol. Assessments 48, 101616. doi:10.1016/j.seta.2021.101616
Coakley, J. A. (2003). Reflectance and albedo, surface. Encycl. Atmos. Sci., 1914–1923. doi:10.1016/b0-12-227090-8/00069-5
Congedo, P. M., Malvoni, M., Mele, M., and De Giorgi, M. G. (2013). Performance measurements of monocrystalline silicon PV modules in South-eastern Italy. Energy Convers. Manag. 68, 1–10. doi:10.1016/j.enconman.2012.12.017
da Costa, L. C. A., and da Silva, G. D. P. (2021). Save water and energy: a techno-economic analysis of a floating solar photovoltaic system to power a water integration project in the Brazilian semiarid. Int. J. Energy Res. 45, 17924–17941. doi:10.1002/er.6932
Dizier, A. (2018). Techno-economic analysis of floating PV solar power plants using active cooling technique. A case study Taiwan, 1–68.
Elhadj Sidi, C. E. B., Ndiaye, M. L., El Bah, M., Mbodji, A., Ndiaye, A., and Ndiaye, P. A. (2016). Performance analysis of the first large-scale (15 MWp) grid-connected photovoltaic plant in Mauritania. Energy Convers. Manag. 119, 411–421. doi:10.1016/j.enconman.2016.04.070
El Hammoumi, A., Chalh, A., Allouhi, A., Motahhir, S., El Ghzizal, A., and Derouich, A. (2021). Design and construction of a test bench to investigate the potential of floating PV systems. J. Clean. Prod. 278, 123917. doi:10.1016/j.jclepro.2020.123917
Exley, G., Hernandez, R. R., Page, T., Chipps, M., Gambro, S., Hersey, M., et al. (2021). Scientific and stakeholder evidence-based assessment: ecosystem response to floating solar photovoltaics and implications for sustainability. Renew. Sustain. Energy Rev. 152, 111639. doi:10.1016/j.rser.2021.111639
Goswami, A. (2023). Effect of humidity on the generation capacity of floating solar photovoltaic system. Jordan J. Electr. Eng. 9, 31–41. doi:10.5455/jjee.204-1667584023
Goswami, A., Sadhu, P., Goswami, U., and Sadhu, P. K. (2019). Floating solar power plant for sustainable development: a techno-economic analysis. Environ. Prog. Sustain Energy 38. doi:10.1002/ep.13268
Goswami, A., and Sadhu, P. K. (2021). Degradation analysis and the impacts on feasibility study of floating solar photovoltaic systems. Sustain. Energy, Grids Netw. 26, 100425. doi:10.1016/j.segan.2020.100425
Goswami, A., and Sadhu, P. K. (2022). Nature inspired evolutionary algorithm integrated performance assessment of floating solar photovoltaic module for low-carbon clean energy generation. Sustain. Operations Comput. 3, 67–82. doi:10.1016/j.susoc.2021.10.002
Gurfude, S. S., Bhavitha, C., Tanusha, D., Mounika, D., Gouda Kake, S. P., Saisudha, M., et al. (2020). “Techno-economic analysis of 1 MWp floating solar PV plant,” in Proceedings of 2020 IEEE 1st international conference on smart technologies for power, energy and control, STPEC 2020. doi:10.1109/STPEC49749.2020.9297740
Haas, J., Khalighi, J., de la Fuente, A., Gerbersdorf, S. U., Nowak, W., and Chen, P. J. (2020). Floating photovoltaic plants: ecological impacts versus hydropower operation flexibility. Energy Convers. Manag. 206, 112414. doi:10.1016/j.enconman.2019.112414
Hafeez, H., Kashif Janjua, A., Nisar, H., Shakir, S., Shahzad, N., and Waqas, A. (2022). Techno-economic perspective of a floating solar PV deployment over urban lakes: a case study of NUST lake Islamabad. Sol. Energy 231, 355–364. doi:10.1016/j.solener.2021.11.071
Ibrik, I. H. (2020). Techno-economic assessment of on-grid solar PV system in Palestine. Cogent Eng. 7, 1727131. doi:10.1080/23311916.2020.1727131
Jeong, H. S., Choi, J., Lee, H. H., and Jo, H. S. (2020). A study on the power generation prediction model considering environmental characteristics of floating photovoltaic system. Appl. Sci. Switz. 10, 4526. doi:10.3390/app10134526
Jiang, M., Qi, L., Chen, J., Wang, N., Wei, W., and Yan, J. (2020) Selection and peer-review under responsibility of the scientific committee of CUE2020 A techno-economic comparison between grounding PV and floating PV for shore power generation: case study of Yangshan port.
Kjeldstad, T., Lindholm, D., Marstein, E., and Selj, J. (2021). Cooling of floating photovoltaics and the importance of water temperature. Sol. Energy 218, 544–551. doi:10.1016/j.solener.2021.03.022
Kowsar, A., Hassan, M., Rana, M. T., Haque, N., Faruque, M. H., Ahsan, S., et al. (2023). Optimization and techno-economic assessment of 50 MW floating solar power plant on Hakaluki marsh land in Bangladesh. Renew. Energy 216, 119077. doi:10.1016/j.renene.2023.119077
Li, X., Feng, K., Siu, Y. L., and Hubacek, K. (2012). Energy-water nexus of wind power in China: the balancing act between CO 2 emissions and water consumption. Energy Policy 45, 440–448. doi:10.1016/j.enpol.2012.02.054
Lindholm, D., Kjeldstad, T., Selj, J., Marstein, E. S., and Fjær, H. G. (2021). Heat loss coefficients computed for floating PV modules. Prog. Photovoltaics Res. Appl. 29, 1262–1273. doi:10.1002/pip.3451
Liu, L., Wang, Q., Lin, H., Li, H., Sun, Q., and Wennersten, R. (2017). Power generation efficiency and prospects of floating photovoltaic systems. Energy Procedia 105, 1136–1142. doi:10.1016/j.egypro.2017.03.483
LONGi Solar LR6-60-HPB-300M solar panel (2020). LONGi Solar LR6-60-HPB-300M solar panel. Available at: https://www.solarreviews.com/manufacturers/longi-solar/solar-panels/f46631b791himo3lr660hpb300m.
Ma, X., Wan, Y., Wang, Y., Dong, X., Shi, S., Liang, J., et al. (2023). Multi-parameter practical stability region analysis of wind power system based on limit cycle amplitude tracing. IEEE Trans. Energy Convers. 38 (4), 2571–2583. doi:10.1109/TEC.2023.3274775
Martins, B. P. (2019) Techno-economic evaluation of a floating PV system for a wastewater treatment facility.
Miah, M. A. R., Rahman, S. R., and Kabir, R. (2021). “Techno-economic analysis of floating solar PV integrating with hydropower plant in Bangladesh,” in IEEE green technologies conference 2021, 30–36. doi:10.1109/GreenTech48523.2021.00016
Micheli, L. (2021). Energy and economic assessment of floating photovoltaics in Spanish reservoirs: cost competitiveness and the role of temperature. Sol. Energy 227, 625–634. doi:10.1016/j.solener.2021.08.058
Micheli, L., Talavera, D. L., Marco Tina, G., Almonacid, F., and Fernández, E. F. (2022). Techno-economic potential and perspectives of floating photovoltaics in Europe. Sol. Energy 243, 203–214. doi:10.1016/j.solener.2022.07.042
Ministry of Energy (Petroleum Division) (2018). Hydrocarbon development institute of Pakistan. Pakistan energy year book 2018. Ministry Energy (Petroleum Div.).
Pasalic, S., Aksamovic, A., and Avdakovic, S. (2018). “Floating photovoltaic plants on artificial accumulations - example of Jablanica Lake,” in 2018 IEEE international energy conference, ENERGYCON 2018, 1–6. doi:10.1109/ENERGYCON.2018.8398765
Pimentel Da Silva, G. D., and Branco, D. A. C. (2018). Is floating photovoltaic better than conventional photovoltaic? Assessing environmental impacts. Impact Assess. Proj. Apprais. 36, 390–400. doi:10.1080/14615517.2018.1477498
Raza, M. A., Khatri, K. L., Israr, A., Ul Haque, M. I., Ahmed, M., Rafique, K., et al. (2022). Energy demand and production forecasting in Pakistan. Energy Strategy Rev. 39, 100788. doi:10.1016/j.esr.2021.100788
Rosa-Clot, M., and Tina, G. M. (2020) Geographic potential. Elsevier Inc. doi:10.1016/B978-0-12-817061-8.00003-8
Rosa-Clot, M., Tina, G. M., and Nizetic, S. (2017). Floating photovoltaic plants and wastewater basins: an Australian project. Energy Procedia 134, 664–674. doi:10.1016/j.egypro.2017.09.585
Semeskandeh, S., Hojjat, M., and Hosseini, A. M. (2022). Techno-economic-environmental comparison of floating photovoltaic plant with conventional solar photovoltaic plant in northern Iran. Clean. Energy 6, 1118–1126. doi:10.1093/ce/zkac019
Sharma, R., and Goel, S. (2017). Performance analysis of a 11.2 kWp roof top grid-connected PV system in Eastern India. Energy Rep. 3, 76–84. doi:10.1016/j.egyr.2017.05.001
Siecker, J., Kusakana, K., and Numbi, B. P. (2017). A review of solar photovoltaic systems cooling technologies. Renew. Sustain. Energy Rev. 79, 192–203. doi:10.1016/j.rser.2017.05.053
Snehith, B., and Kulkarni, P. S. (2021a). “Techno-economic analysis of proposed10 MWPFloating solar PV plant at nagarjuna sagar, telangana, India: Part-1,” in ICCISc 2021 - 2021 international conference on communication, control and information sciences, proceedings. (Kerala, India: Institute of Electrical and Electronics Engineers Inc.). doi:10.1109/ICCISc52257.2021.9484867
Snehith, B., and Kulkarni, P. S. (2021b). “Techno-economic analysis of proposed10 MWPFloating solar PV plant at nagarjuna sagar, telangana, India: Part-2,” in ICCISc 2021 - 2021 international conference on communication, control and information sciences, proceedings. (Kerala, India: Institute of Electrical and Electronics Engineers Inc.). doi:10.1109/ICCISc52257.2021.9484963
Song, J., and Choi, Y. (2016). Analysis of the potential for use of floating photovoltaic systems on mine pit lakes: case study at the Ssangyong open-pit limestone mine in Korea. Energies (Basel) 9, 102–113. doi:10.3390/en9020102
Srivastava, R., Tiwari, A. N., and Giri, V. K. (2020). An overview on performance of PV plants commissioned at different places in the world. Energy Sustain. Dev. 54, 51–59. doi:10.1016/j.esd.2019.10.004
Statistical Review, B. P. (2020). Stratistical review of world energy. Stat. Rev. World Energy 67, 1–56.
Temiz, M., and Dincer, I. (2021). Techno-economic analysis of green hydrogen ferries with a floating photovoltaic based marine fueling station. Energy Convers. Manag. 247, 114760. doi:10.1016/j.enconman.2021.114760
Trapani, K., and Millar, D. L. (2016). Floating photovoltaic arrays to power the mining industry: a case study for the McFaulds lake (Ring of Fire). Environ. Prog. Sustain Energy 35, 898–905. doi:10.1002/ep.12275
Trapani, K., and Redõn Santafé, M. (2015). A review of floating photovoltaic installations: 2007-2013. Prog. Photovoltaics Res. Appl. 23, 524–532. doi:10.1002/pip.2466
Trillo-Montero, D., Santiago, I., Luna-Rodriguez, J. J., and Real-Calvo, R. (2014). Development of a software application to evaluate the performance and energy losses of grid-connected photovoltaic systems. Energy Convers. Manag. 81, 144–159. doi:10.1016/j.enconman.2014.02.026
Uddin, M. N., Biswas, M. M., and Nuruddin, S. (2022). Techno-economic impacts of floating PV power generation for remote coastal regions. Sustain. Energy Technol. Assessments 51, 101930. doi:10.1016/j.seta.2021.101930
Yang, Y., Si, Z., Jia, L., Wang, P., Huang, L., Zhang, Y., et al. (2024). Whether rural rooftop photovoltaics can effectively fight the power consumption conflicts at the regional scale – a case study of Jiangsu Province. Energy Build. 306, 113921. doi:10.1016/j.enbuild.2024.113921
Yao, L., Wang, Y., and Xiao, X. (2024). Concentrated solar power plant modeling for power system studies. IEEE Trans. Power Syst. 39 (2), 4252–4263. doi:10.1109/TPWRS.2023.3301996
Zahedi, R., Ranjbaran, P., Gharehpetian, G. B., Mohammadi, F., and Ahmadiahangar, R. (2021). Cleaning of floating photovoltaic systems: a critical review on approaches from technical and economic perspectives. Energies (Basel) 14, 2018. doi:10.3390/en14072018
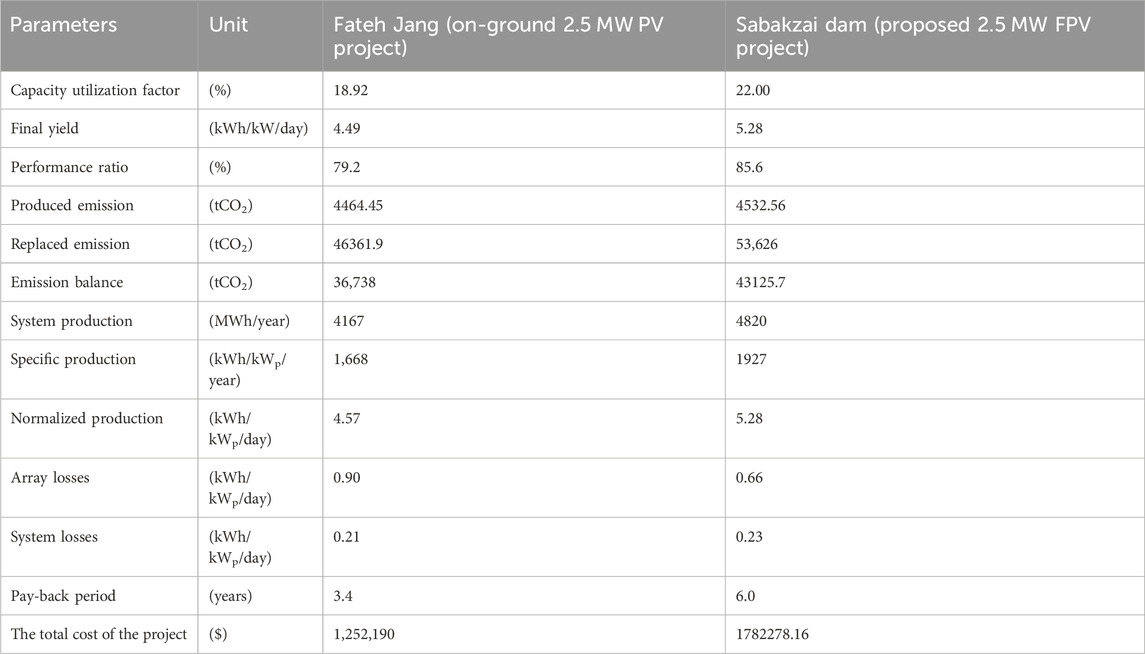
TABLE A1. Results validation and comparative analysis of the proposed 2.5 MW FPV project with an on-ground PV system of the same capacity.
Keywords: floating photovoltaics, techno-economic analysis, environmental analysis, social analysis, renewable energy
Citation: Mumtaz A, Abbas Kazmi SA, Altamimi A, Khan ZA and Alyami S (2024) Multi-dimensional potential assessment of grid-connected mega-scale floating PV power plants across heterogeneous climatic zones. Front. Energy Res. 12:1404777. doi: 10.3389/fenrg.2024.1404777
Received: 21 March 2024; Accepted: 22 April 2024;
Published: 22 May 2024.
Edited by:
Flah Aymen, École Nationale d'Ingénieurs de Gabès, TunisiaReviewed by:
Ishak Ertugrul, Mus Alparslan University, TürkiyeCopyright © 2024 Mumtaz, Abbas Kazmi, Altamimi, Khan and Alyami. This is an open-access article distributed under the terms of the Creative Commons Attribution License (CC BY). The use, distribution or reproduction in other forums is permitted, provided the original author(s) and the copyright owner(s) are credited and that the original publication in this journal is cited, in accordance with accepted academic practice. No use, distribution or reproduction is permitted which does not comply with these terms.
*Correspondence: Saeed Alyami, cy5hbHlhbWlAbXUuZWR1LnNh
Disclaimer: All claims expressed in this article are solely those of the authors and do not necessarily represent those of their affiliated organizations, or those of the publisher, the editors and the reviewers. Any product that may be evaluated in this article or claim that may be made by its manufacturer is not guaranteed or endorsed by the publisher.
Research integrity at Frontiers
Learn more about the work of our research integrity team to safeguard the quality of each article we publish.