Abstract
Introduction:
Grid-forming control has received increasing attention for being an effective solution to cope with low-inertia and weak damping systems. Owing to the basic characteristics of transient voltage regulation, inertia support and primary frequency regulation (PFR), virtual synchronous generator (VSG) is the most promising candidate of grid-forming control scheme. The damping characteristic plays a significant role in stabilizing when the system is disturbed. However, the traditional approaches for damping emulation pose a number of problems, such as the introduction of phase-locked loop (PLL) that may lead to stability issues, or the blurring of the functional distinction between damping characteristic and primary frequency regulation. Moreover, the grid strength affects the operational characteristics of the converters.
Methods:
Based on the background of these issues, firstly, an effective transient damping power strategy is proposed in this paper. In contrast to conventional damping approaches, the proposed scheme provides a positive damping during transient period that suppresses the fluctuation of active power, and has no impact on the steady-state frequency droop characteristic. Ulteriorly, based on small-signal models and classical control theory, an parameters adjustment strategy for both active and reactive power control is proposed to considerably enhance the adaptability of the converter to the variations in grid strength.
Results and Discussion:
The results obtained from PSCAD/EMTDC and hardware-in-the-loop (HIL) platform verify that proposed control strategy exhibits excellent transient damping effect, the decoupling characteristic between fixed damping coefficient and PFR coefficient, and performs well across a broad spectrum of grid strengths.
1 Introduction
Power electronic converters mainly shoulder the role of energy conversion in modern power systems. (Thao et al., 2021). Along with the decreasing proportion of the synchronous generators (SGs), the equivalent inertia in modern power systems is declining, which makes the operational stability of the system vulnerable to threats. To improve the operational stability of the system, grid-forming control technology comes into being (Zhang et al., 2021). One of the main features of grid-forming control is the use of power synchronization as an alternative to the classical PLL-based synchronization method. There is a wide variety of grid-forming control schemes. Among them, virtual synchronous generator (VSG) has received extensive attention and research as a control scheme of grid-forming (Driesen and Visscher, 2008; Gao and Iravani, 2008; Zhong and Weiss, 2011). VSG adopts control strategy appropriately to simulate the typical external characteristics of SGs, including virtual inertia and damping. Basically, the active power control loop (APCL) of VSG simulates the rotor inertia by simulating the swing equation. Moreover, the selection of the virtual inertia of VSG is more flexible compared to the fixed rotational inertia of the SGs. In contrast, there are many different ways of modelling the damping characteristic.
Damping control is introduced to solve the problem of active power oscillations when active power reference or grid frequency is disturbed. The most typical damping modelling approach is to use damping power, which is directly proportional to the difference in angular frequency. The first approach adopts a damping term proportional to the difference between the angular frequency of VSG and the actual angular frequency of the grid to realize damping emulation (Shintai et al., 2014; Liu et al., 2016). When the grid frequency varies due to the increase or decrease of the active load, the variations can be offhandedly sensed by VSG. Once the steady-state is reached, the frequency of VSG aligns with the actual grid frequency and no steady-state error generates. However, this kind of mimicking approach has the following disadvantages. On the one hand, PLL (or other frequency measuring module) is required to detect the actual frequency of the grid generally. In weak grid, it may cause stability problems (Golestan et al., 2017). On the other hand, it actually violates the intention for which the concept of grid-forming was originally proposed, that is, it is able to control voltage amplitude and phase independently without relying on grid voltage information. The second method uses a damping term proportional to difference between the angular frequency of VSG and the rated angular frequency (Zhong and Weiss, 2011), it is simple and does not require grid frequency information. However, when the grid frequency deviates from the rated value, the damping term is not zero at steady state, which changes the static droop characteristic of VSG. In other words, a coupling between the damping coefficient and PFR coefficient appears.
In fact, the traditional damping approaches as described above may not suppress oscillations well when relatively large virtual inertia coefficient and small damping coefficient are adopted. Decreasing the inertia coefficient or increasing the damping coefficient in a certain range is advantageous to enhance system damping and suppress oscillations. Therefore, the damping characteristic can be enhanced by adjusting the inertia and damping coefficient. In (Alipoor et al., 2015), the selection principle of virtual inertia is given according to the frequency deviation and frequency change rate, and the Bang-Bang control is adopted for the changing virtual inertia. Different from (Alipoor et al., 2015), the threshold values are set in (Wen et al., 2017; Li et al., 2019). The virtual inertia remains fixed when the frequency deviation and frequency change rate are both smaller than the set values. An adaptive parameters control strategy with constant damping ratio is proposed in (Wang et al., 2018). When the virtual inertia changes according to the given rules, the damping coefficient also changes to ensure a constant damping ratio. In (Wen et al., 2018), an expression of virtual inertia with respect to frequency change is constructed, and based on the constructed expression, the relationship between damping coefficient and frequency change rate is further obtained. It can be seen that changing these two parameters will effectively change the dynamic response when the system is disturbed. However, both virtual inertia and damping coefficient remain constant when the system is at a new equilibrium point. The coupling problem between the damping coefficient and the PFR coefficient is not solved when the grid frequency deviates from the rated value.
It can be seen that it is worth proposing an improved damping algorithm, which can suppress the active power oscillation without affecting PFR characteristic. For this purpose, various solutions have been proposed in literature. (Liu et al., 2019), added a damping term generated by state feedback control. A further application of a low-pass filter (LPF) to the calculated active power provides an additional design freedom. The proposed damping method in (Chen et al., 2021) is developed from the relation between power dynamics and angular acceleration. The main advantage is also that the damping level can be freely adjusted. (Suul et al., 2016), replaced the grid frequency by the virtual frequency of VSG through a first-order LPF. Nevertheless, there is no discussion regarding the adjustment of the time constant of LPF. Similarly, some other solutions are proposed by adding a virtual damping term based on LPF (Yan and Jia, 2019; Shuai et al., 2020; Lan et al., 2023; Huang et al., 2024), constructed transient electromagnetic power by using a first-order lag unit and also given a parameters design method for APCL. Nevertheless, they may significantly degrade the inertial response of VSG when introducing additional damping terms (Yu et al., 2021). To tackle this issue, a novel damping method utilizing active power reference feed-forward control is proposed to preserve the original inertial response of the VSG (Yu et al., 2022). Furthermore, some literature combine the output of reactive power control loop (RPCL) and APCL to realize transient damping emulation. (Dong and Chen, 2017), used a damping correction loop to add an additional adjustable parameter for adjusting the dynamic characteristics of the APCL without affecting the steady-state characteristics. A damping active power which carries the information about the difference between the VSG internal frequency and the grid frequency is generated using the output information of the APCL, RPCL and the measured grid voltage (Ebrahimi et al., 2019; Khajehoddin et al., 2019). The aforementioned methods not only achieve the purpose of enhancing the damping of system to a certain extent, but also realize the parameters decoupling. However, the effect on the dynamic response of the system when grid strength varies is not taken into account. This means that the issue of adaptability of the fixed parameters to the grid strength needs to be investigated. The equivalent grid impedance denoted by the short circuit ratio (SCR) affects the operating characteristics of VSG. For example, the output active power will oscillate when the equivalent grid impedance changes under fixed parameters (Mohammed et al., 2023). Meanwhile, the majority of the literature focus on the parameters design of the APCL. The parameters of RPCL under strong and weak grid also needs to be designed properly. A comprehensive design method of parameters based on grid impedance estimation for both APCL and RPCL is proposed (Mohammed et al., 2023). However, the coupling problem between fixed damping coefficient and PFR coefficient remains unconsidered. (Wang et al., 2022). adopted reinforcement learning and the adaptive dynamic programming, and takes into account weak grid conditions to design the parameters of APCL. However, the parameters design of RPCL are not considered.
In conclusion, an effective method is still lacking for solving the coupling problem that exists in traditional damping approaches between the damping coefficient and PFR coefficient, and simultaneously considering the effects of grid impedance on APCL. Furthermore, the effect of grid impedance on RPCL also needs to be considered for designing the parameters to make the responses exhibit satisfactory performance.
Prompted by the aforementioned research, this paper proposes a transient damping power strategy and a detailed design method of parameters is given. The main contributions of this paper are as follows:
1) An improved damping strategy is proposed by using transient oscillation active power to replace fixed damping power in the control loop. It addresses the coupling problem between fixed damping coefficient and PFR coefficient and exhibits excellent damping effect with the existence of the transient power.
2) Considering the effect of varying grid impedance on the dynamic response of APCL, an adjustable parameters method based on the proposed damping strategy is designed by using a reduced-order approach. Meanwhile, by analyzing the effect of the zero on the dynamic response characteristics, the key parameter is adjusted appropriately to attenuate the negative effects from the zero. Based on the adjustable parameters, the active power response demonstrates satisfactory performance when grid strength varies.
3) Summarizing the effect of varying grid impedance on the dynamic response of RPCL and analyzing the response of RPCL in relation to the position of zeros, a useful design guideline of key parameters for RPCL is proposed. The adjusted parameters ensures that the reactive power response can be adapted to the varying grid strength, which is advantageous for system voltage stability to some extent.
The rest of the paper is organized as follows. Section 2 gives an overview of VSG basic control principle and analyzes the problems of traditional VSG (T-VSG). In Section 3, the proposed damping strategy based on transient oscillation power is elaborated, and the design method for the key parameters of APCL and RPCL is detailed. The performance of the proposed control strategy is widely assessed using PSCAD/EMTDC and a HIL experiment platform in Section 4. Finally, Section 5 draws the conclusions.
2 Problem statement of T-VSG
2.1 Overview of VSG basic control principle
Figure 1 shows the main circuit topology and basic control architecture of general VSG. The circuit topology mainly consists of an inverter with an LCL filter. A three-phase inverter topology is used in this paper. Lf1, Lf2 and Cf are the inverter-side filter inductor, grid-side filter inductor, and the filter capacitance, respectively. Rf represents damping resistance, which is used to suppress the resonance spikes. es and if are the output voltage and current of the inverter, respectively. upcc and ipcc are the voltage and current at the point of common coupling of the main grid, respectively. The voltage source ug represents the main grid, where Lg and Rg are the equivalent inductance and resistance, respectively. The basic control architecture of the VSG contains three parts, i.e., the power control loop, the virtual impedance loop, and the current inner-loop control. The virtual rotor angle θ generated by the APCL and the amplitude of the virtual internal potential Ep generated by the RPCL are combined to form the reference value of internal potential named eemf. Then, a voltage difference between eemf and upcc is used to generate the current reference value expressed by iref through the virtual impedance. ipcc is generally controlled by PI controllers to follow iref. It is considered that the control bandwidth of the current control loop is much larger than that of the power control loop, hence, its influence on the power control loop will not be considered in subsequent analysis (Mohamed and El-Saadany, 2008). Meanwhile, the coupling term between APCL and RPCL is ignored in this paper (Wu et al., 2016).
FIGURE 1

Main circuit topology and basic control structure of general VSG.
2.2 Analysis of the coupling between the PFR and the virtual damping term
Traditional APCL (T-APCL) enables the inverter to have the characteristics of virtual inertia, damping and PFR by emulating the typical characteristics of real SGs. Figure 2 shows the control block diagram, and the mechanical equation is obtained by implementing the classic swing equation of SGs, as inwhere the superscript “*” represents per unit value. and are the active power reference and actual output active power, respectively. ω* is the virtual angular frequency. H is the inertia constant, Dp is the damping coefficient and kω represents coefficient of PFR.
FIGURE 2

Control structure of T-APCL.
The power angle expressed as δ is defined as the difference in phase angle between the output voltage of VSG and the grid voltagewhere and ωN are the angular frequency of grid voltage and its rated value.
The active power delivered by the inverter to the main grid can be approximatively represented as (Mandrile et al., 2023)where, and are the magnitude of inverter output voltage and grid voltage, respectively.
and are the equivalent reactance of VSG and the main grid, respectively.
According to Eqs 1-3, and the without considering the perturbations of the active power reference and the grid frequency, the state equation can be obtained in Eqs 4, 5where is the state variable and A0 is the state matrix.
Then, the eigenvalues of the system are obtained from the Eq. 5
In addition, it can be obtained from Eq. 1
As can be seen in Eq. 6, p1 and p2 vary with the change of Dp, which in turn affects the dynamic response of the output active power. The oscillation of the active power is suppressed as Dp continues to increase. According to (Eq. 7), the damping effect of Dp is reflected in the introduction of a damping power term actually. When the power balance of the system is broken, VSG regulates the virtual rotational speed with the synergy of virtual inertia and damping power to ensure stability of system.
The small-signal transfer function between the output power and grid angular frequency is obtained by considering the grid frequency perturbation based on Eqs 1–3where
Based on Eqs 8, 9, when steady-state is reached, (Eq. 8) can be written as
The existence of Dp will cause an equivalent increase of PFR coefficient, leading to an increasing steady-state error of active power when grid frequency deviates from the nominal frequency. Dp should be minimized to decrease the steady-state deviation from this perspective. However, from the perspective of achieving a satisfactory dynamic response, a relatively large Dp is desirable. Thereout, the introduction of a fixed damping power term cannot optimize the dynamic response and the steady-state response characteristics of the T-APCL simultaneously because of the mutual coupling between the fixed damping term and PFR.
2.3 Problems of T-VSG in different grid strength
Based on (Eqs 1–3) and without considering the grid frequency perturbation, the small-signal closed-loop transfer function between the output active power and its reference can be obtained as follows
The parameters used in the theoretical analysis based on Eq. 11 in Figures 3, 5 are shown in Supplementary Table S1.
FIGURE 3

Closed-loop Bode diagram of Gcp(s) under variation of SCR.
Figure 3 shows the Bode diagram of Gcp(s) under variation of SCR. It can be seen that for fixed control parameters, decreasing the SCR leads to a reduction in system bandwidth, consequently slowing down the response speed of APCL. As the SCR increases, the active power response is fast, but the system has a tendency to oscillate. Clearly, the dynamic response of the system is strongly related to the grid strength, and fixed parameters cannot ensure consistently optimal control performance in the face of varying grid strength.
Traditional RPCL (T-RPCL) of VSG generally uses a PI controller and a LPF in grid connected mode (GCM) (Fang et al., 2021), to track the reactive power reference with zero steady-state error. The control block diagram is shown in Figure 4 and the governing equation is shown belowwhere kpq and kiq are proportionality coefficient and integral coefficient, respectively. ωcq represents cut-off frequency of LPF.
FIGURE 4

Closed-loop control structure diagram of RPCL.
The reactive power delivered by the inverter to the grid is
Based on Eqs 12, 13, the small-signal closed-loop transfer function between the output reactive power and its reference can be approximatively derived as followswhere
Based on Eqs 14, 15, Figure 5 depicts the Bode diagram of Gcq(s) under different SCRs. It can be seen that with fixed parameters, the control bandwidth of the system increases, leading to a fast response at the cost of significant overshoot, power oscillation and other poor dynamic performance.
FIGURE 5
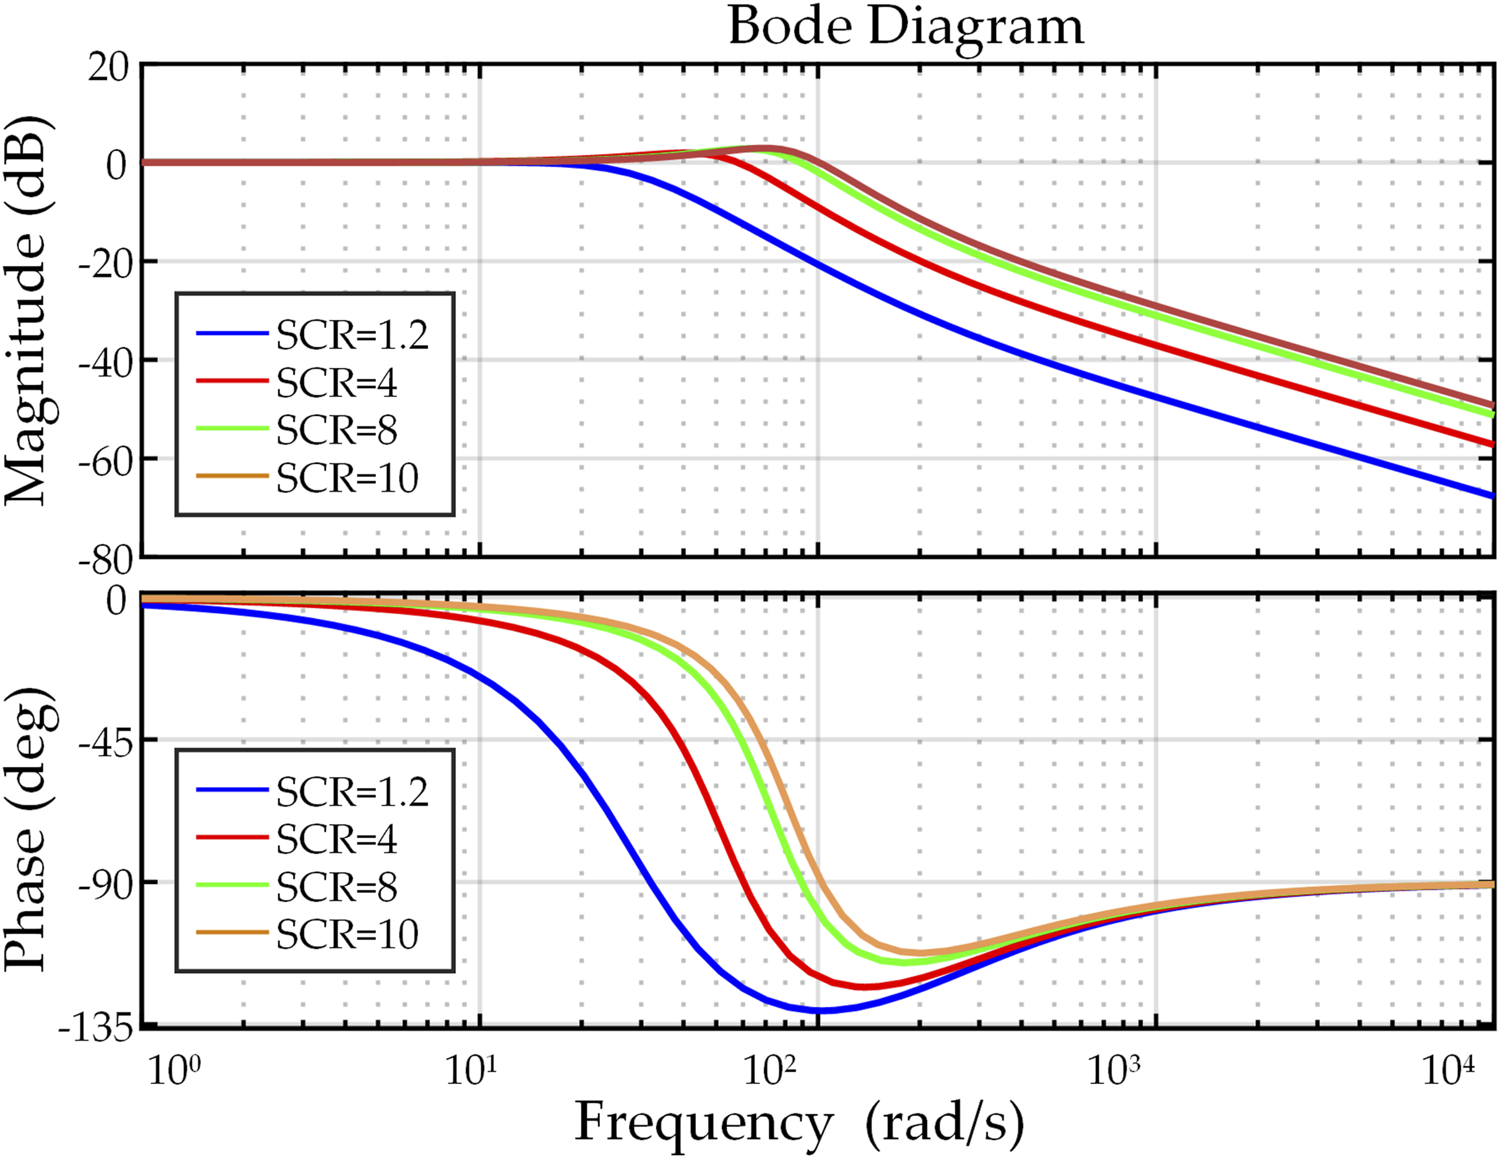
Closed-loop Bode diagram of Gcq(s) under variation of SCR.
From the foregoing analysis, it is clear that there are two issues with T-VSG, which can be identified as follows:
1) The mutual coupling between the damping coefficient and the PFR coefficient results in the failure to satisfy the damping characteristic and the PFR requirement simultaneously.
2) Since the response characteristics are associated with the grid strength, there is a problem of adaptation to grid strength if fixed control parameters are used.
It is thus necessary to propose a control strategy that not only satisfies the decoupling of the damping characteristic and the PFR, but also performs well under a wide range variation of grid strength.
3 Proposed strategy
3.1 Transient-oscillation-power-based damping strategy for APCL
Based on the analysis in the previous section, a new control strategy is designed to meet two control objectives as follows.
1) Minimize the steady-state deviation of the output active power produced by the traditional fixed damping term when grid frequency varies.
2) Suppress the oscillations of active power in case of disturbances.
For these purposes, an improved control equation for active power is designed, which can be expressed aswhere ke represents the equivalent damping coefficient, ωcp refers to cut-off angular frequency of APCL.
The improved control scheme is referred to the transient-oscillation-power-based damping strategy for APCL (TOPD-APCL) in this paper. Figure 6 shows the control block diagram of TOPD-APCL.
FIGURE 6
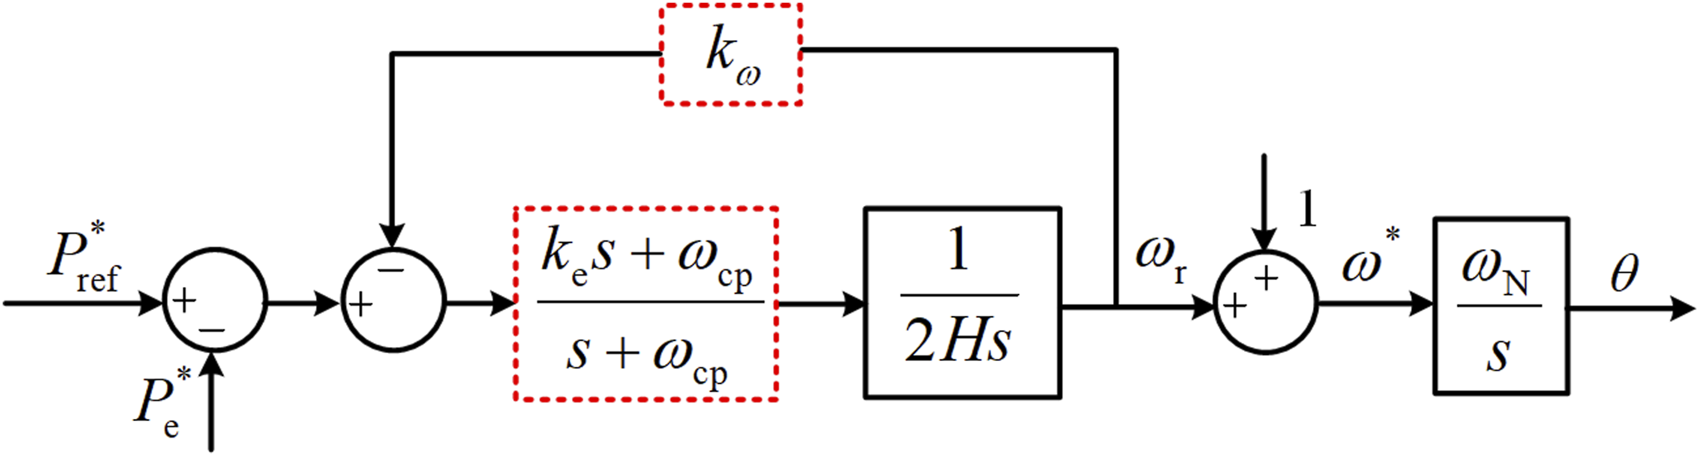
Control structure of TOPD-APCL.
The following analyzes how the introduction of Gp(s) can achieve decoupling and manifest the damping effect, as well as the effect of parameters ke and ωcp on the dynamic response.
The frequency domain expression for Gp(s) is given by
As for the dc component, i.e., when jω = j0
It can be clearly demonstrated in Eqs 18, 19 that the steady-state characteristic is unaffected and the decoupling is achieved in comparison to (Eq. 10).
From the perspective of the small-signal model, it can also be concluded that the decoupling is achieved. Considering the grid frequency perturbation, the small-signal transfer function between the output power and grid angular frequency of the proposed strategy is obtained as follow
When steady-state is reached, (Eq. 20) can be written as
It can be clearly demonstrated that Eq. 21 is independent of Dp in comparison to Eq. 10. Dp will not cause an increase of PFR coefficient, the steady-state value only relates to kω.
The per unit value between power and torque satisfies P* = T*ω*. Assuming ω* = 1, then the per unit values of power and torque are equal. Therefore, torque component is replaced by power component in the following analysis. For the sake of simplicity in analyzing the damping characteristic of TOPD-APCL, the PFR is disregarded temporarily. When the power system is disturbed, the change in electromagnetic power can be expressed as
Based on Eq. 3, the small perturbation component of the electromagnetic power is obtained as followswhere
Assuming that the frequency of oscillation component is ωosc, the small perturbation component of the angular frequency deviation at ωosc is given by
Based on Eqs 22–25, the small perturbation component of the electromagnetic power at ωosc is obtained as follows
On the basis of the classical power system stability theory, the change of electrical power of SGs following the disturbance can be decomposed into a synchronizing power component and a damping power component. The synchronizing power component P1 changes in phase with Δδ, and the damping power component P2 changes in phase with Δω (KUNDUR, 1994). P2 is a quantitative indicator of the ability to suppress low-frequency oscillations, and the lack of sufficient damping power produces oscillatory instability. Furthermore, a system with both a positive P1 and a positive P2 is small-signal stable. It can be seen from Eq. 26 that P1 and P2 are both related to the value of ke and ωcp. The value of ke should satisfy larger than 1, with the aim of obtaining a positive P2. P1 is also positive in this case. Actually, TOPD-APCL utilizes the oscillation component of the difference of active power to form a damping power, and the value of ke is mainly correlated with damping.
Through Eqs 2, 3, 16, 17, and disregarding the grid frequency perturbation, an improved small-signal transfer function between the output active power and power reference can also be obtained as below
The impact of altering the parameters ke and ωcp, and the variable SCR on the dynamic response of system can be quantitatively analyzed based on Eq. 27.
The parameters used in the theoretical analysis of Figures 7–9 are shown in Supplementary Table S2.
FIGURE 7
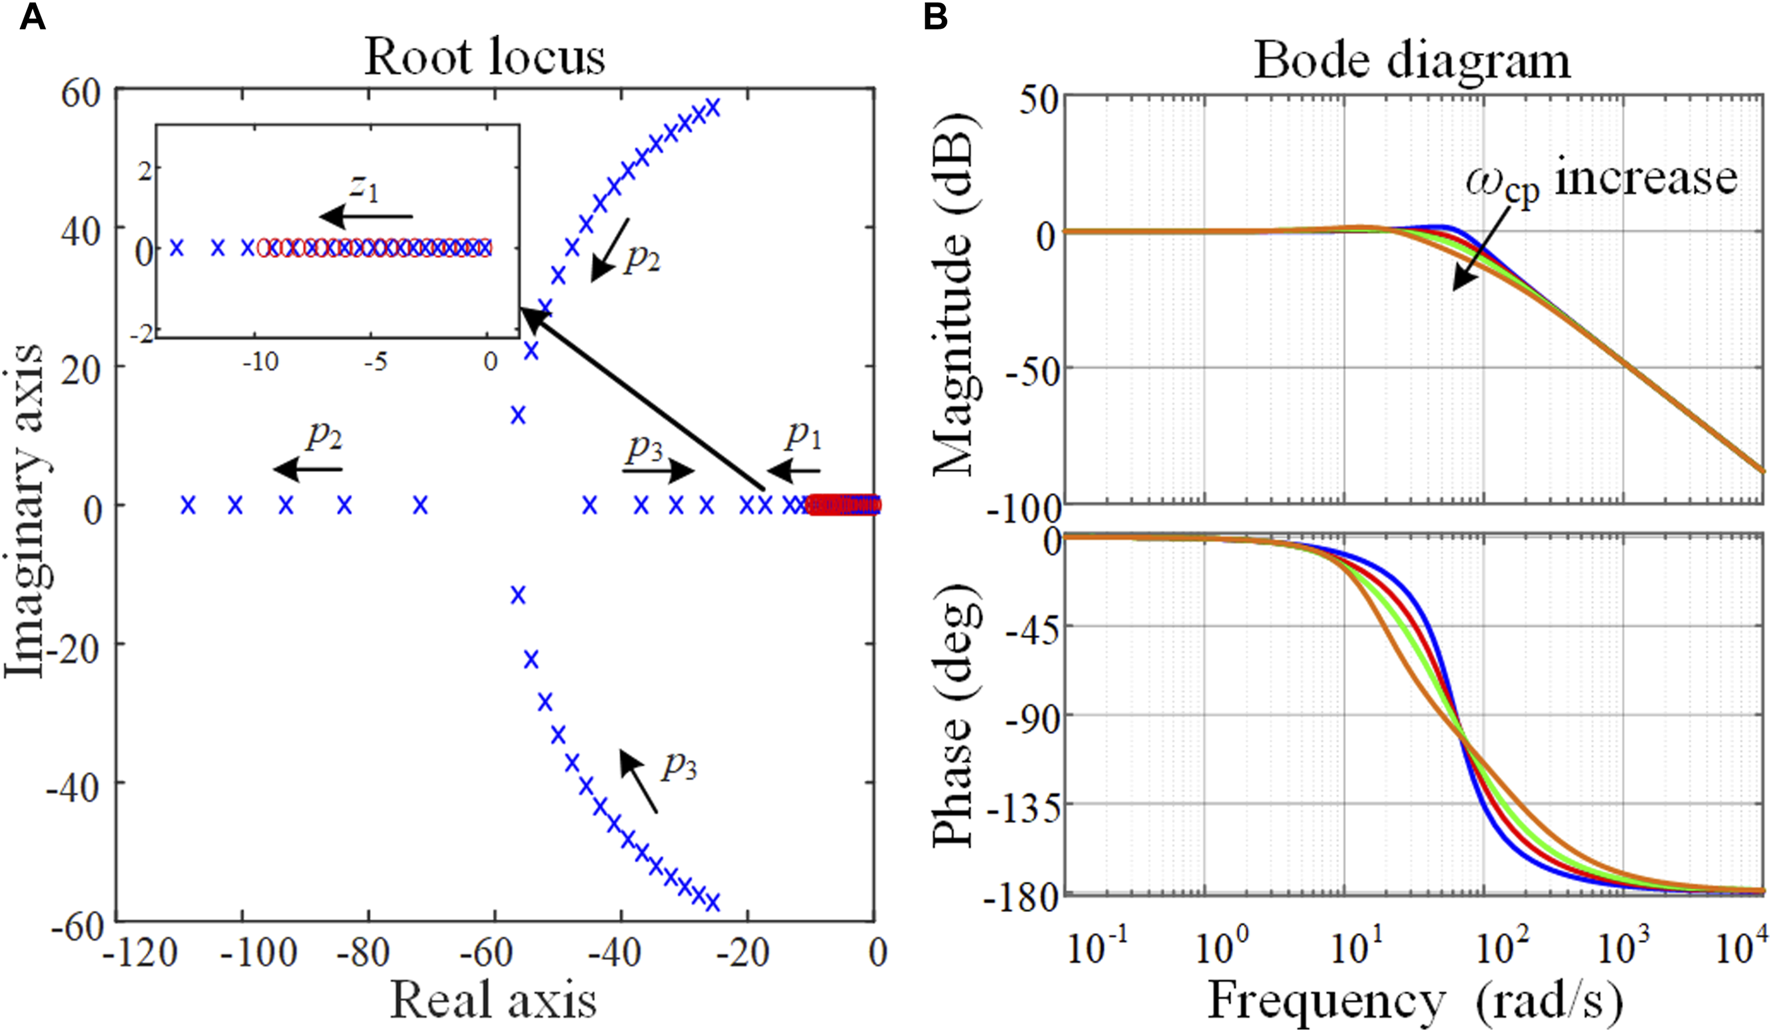
Closed-loop small-signal model when ωcp varies: (A) Zero-pole distribution; (B) Bode diagram.
FIGURE 8

Closed-loop small-signal model when ke varies: (A) Zero-pole distribution; (B) Bode diagram.
FIGURE 9
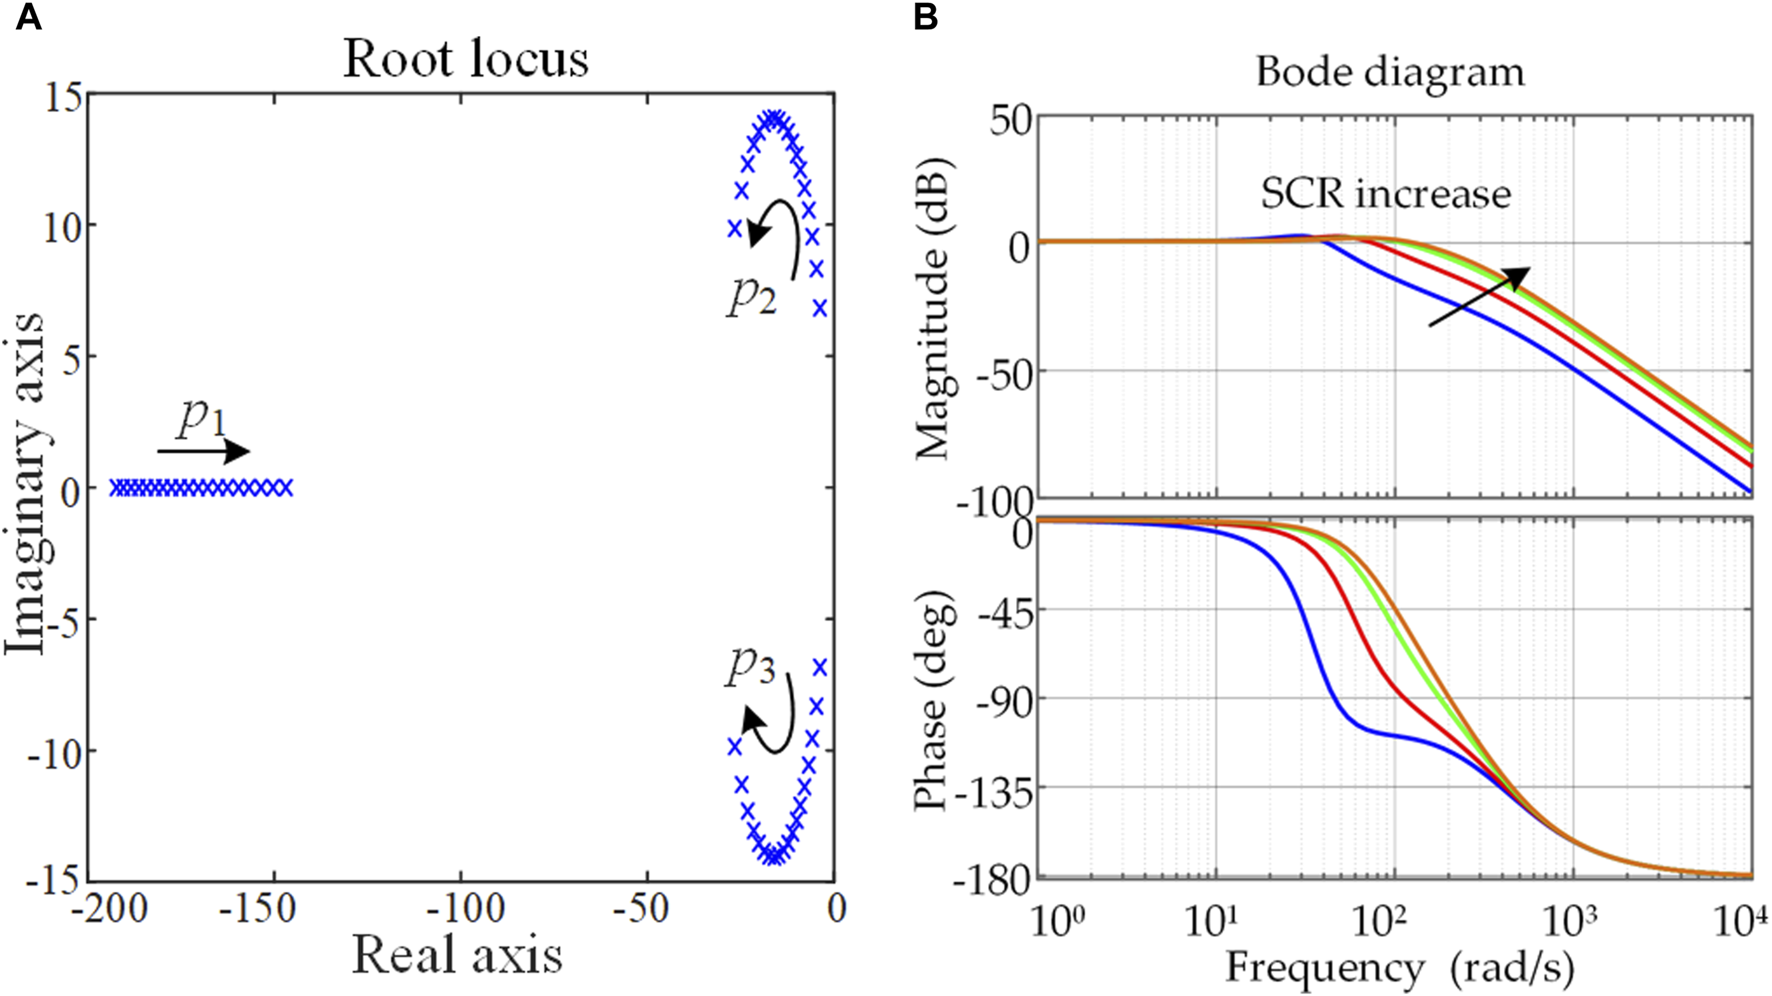
Closed-loop small-signal model when SCR varies: (A) Zero-pole distribution; (B) Bode diagram.
Figure 7A exhibits the zero-pole distribution of the TOPD-APCL system when ke is assumed to 10 and ωcp is increased from 1 to 100 at a step of 5. The zero z1 of the system can be obtained from Eq. 27. It is clearly observable from Figure 7A that the z1 gradually moves away from the imaginary axis with the increase of ωcp. It can also be observed from Figure 7A that the position of the z1 and one of the poles p1 are fairly close when ωcp is small. Hence, the effects of the two approximately counterbalance each other. At the meantime, the p2 is farther away from the imaginary axis and exerts little influence on the dynamic response characteristics of the system when ωcp is large. Figure 7B shows the Bode diagram under variation of ωcp. It is obvious that the control bandwidth of the system correlates negatively with ωcp. According to the above analysis, it can be found that ωcp affects the dynamic response of the system. When ωcp adopts an appropriate value, the response of the system is similar to that of a second-order system.
Figure 8A illustrates the zero-pole distribution of the TOPD-APCL with ωcp taken as 150 and ke increases from 1 to 30 at a step of 1. As can be seen from Figure 8A, p1 moves away from the imaginary axis and becomes the non-dominant pole as ke increases. The conjugate poles p2 and p3 mainly affect the dynamic response characteristics of the TOPD-APCL. They gradually move close to the real axis, implying that the overshoot will be reduced, with a slow response speed simultaneously. At the same time, noticing that the z1 keeps approaching the imaginary axis, then the z1 also affects the dynamic response. Also, as can be seen from Figure 8B, the system has a tendency to oscillate when the value of ke is small. It can be explained that increasing the value of ke can play a role in increasing damping. Based on the above analysis, ke affects the dynamic response and is related to the damping of the system.
When ωcp and ke are assumed to be constant, the zero-pole distribution and Bode diagram are shown in Figures 9A, B under variation of SCR, respectively. The conjugate poles p2 and p3 are the dominant poles. They gradually move away from the imaginary axis when SCR increases. They mainly affect the dynamic response characteristics while p1 is the non-dominant pole. It can be seen from Figure 9B that the active power response is fast when SCR increases, which is consistent with the above analysis given in Figure 9A. According to the above analysis, it can be found that the dynamic response of the system is different when SCR changes. In order to obtain a satisfactory dynamic response, it is necessary to adjust ωcp and ke when SCR varies.
3.2 Adjustable parameters-based control strategy for TOPD-APCL
The introduction of Gp(s) adds a pole and a zero to TOPD-APCL compared to the conventional control system, which changes the response characteristics of the system. The key parameters ke and ωcp should be tuned to guarantee that the response of VSG is satisfactory. The design of key parameters is based on the derived small-signal model.
Eq. 27 is transformed into the general form of a third-order system with a zero, which can be expressed aswhere ξ and ωn are damping ratio and natural oscillation frequency of a second-order system, respectively.
It can be observed that the characteristic equation includes three characteristic roots, which are a pair of conjugate complex roots and a real root. It is the real part −ξωn of the conjugate complex roots that determines their impact on the dynamic performance and stability of the system (Hu, 2013).
Assuming that the real root p0 = mξωn, and comparing (Eq. 27), three equivalent equations are given by Eq. 29.where m is relative distance between the real root p0 and the real part of the conjugate complex roots.
It can be solved from the three equations of Eq. 29
From Eq. 30, it can be seen that ωcp and ke can be automatically adjusted following the change of SCR since K0 is related to SCR. When the values of H and kω are fixed, m and ξ affects ωcp and ke as well. The following illustrates how the values of m and ξ are chosen.
It is clear from Eq. 28 that both the zero and the real pole p0 affect the dynamic response characteristics of the system. The effect of the p0 on the system response gradually decreases when the value of m is larger than a certain range. To reduce the system shown in Eq. 28 to a second-order system and simplify the subsequent analysis process, it is no harm to choose m = 10. In this case and based on Eqs 30, 28 can be rewritten as
The expression of standard second-order system is
Comparing Eqs 31 and 32, it is apparent that the transfer function includes an additional term after considering the zero, which can be expressed as
The step response of the system shown in Eq. 31 is expressed
It is evident in Eq. 34 that the existence of the zero results in the additional impulse response of Ge3(s) Eq. 33 in compared to standard second-order system. In other words, second-order system with a zero is the superposition of the step response of standard second-order system Ge2(s) and the impulse response of Ge3(s), as displayed in Figure 10.
FIGURE 10
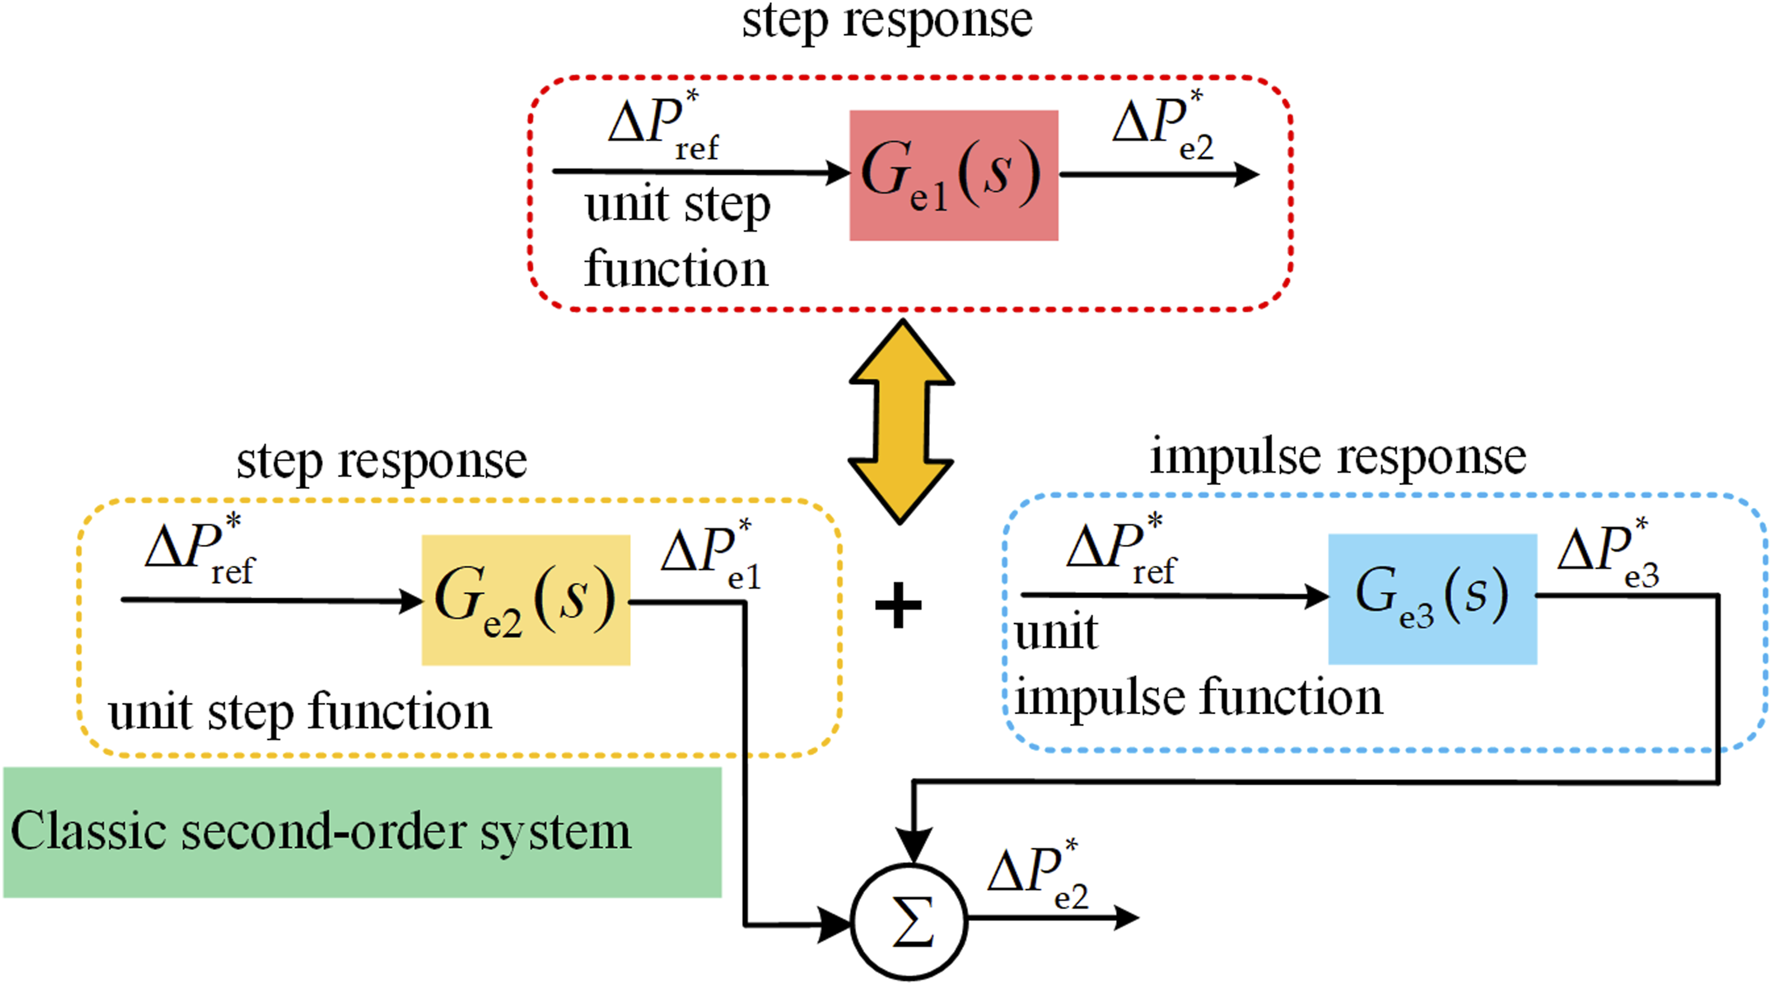
Comparison of the response between the reduced-order system with a zero and the standard second-order system.
According to the inverse Laplace transform, the step response of Eqs 31, 32 are obtained as
The output of the reduced-order system has a larger amount of overshoot potentially because the presence of the zero causes the output to superimpose a positive value. The partial derivation of (Eq. 35) yields
When the Eq. 36 is equal to 0, the peak time tm can be obtained as follows
Considering ke is 17.48 and ωcp is 151.73, Figure 11A shows the comparison of step responses between p1(t) and p2(t) when ξ is 0.7. It is obvious that the existence of the zero results in a considerable overshoot. The overshoot of p1(t) can be obtained from Eq. 37. Taking 0 < ξ < 1, for example, Figure 11B shows the change of the overshoot when ξ changes. It can be seen that the overshoot decreases when increasing ξ. Based on the above analysis, it can be obtained that ξ cannot be selected based on the response characteristics of the standard second-order system. Increasing ξ appropriately to attenuate the negative effects from the zero.
FIGURE 11

The change in the system response after considering the zero: (A) Comparison of step responses between p1(t) and p2(t); (B) The change of the overshoot when ξ changes.
3.3 Adjustable parameters-based control strategy for RPCL
This sub-section focuses on the parameters design of RPCL. Typically, the expression of kpq is expressed aswhere ΔQmax and ΔUmax are the max reactive power deviation and the maximum voltage deviation, respectively. For fixed parameters, the droop coefficient kpq in Eq. 38 is generally calculated and selected as 0.1pu (Pan et al., 2020), and the integration loop is usually added so that the reactive power can be controlled without steady-state error. The integral coefficient kiq is selected as 20 in this paper.
In order to simplify the analysis, and are assumed to 1.0. In comparison to the standard second-order close-loop transfer function, the closed-loop transfer function with a zero can be obtained as (Hu, 2013).where z is the zero, ωnq is the natural frequency. ζ is the damping ratio of the close-loop transfer function of standard second-order system, and ζd is the damping ratio of the second-order close-loop transfer function with a zero.
Comparing (Eqs 14 and 39), two equivalent equations are given by Eq. 40.
Then, the parameters of the PI controller can be calculated based on the following equation:
It is clearly seen that kpq and kiq can be obtained through the appropriately design of ζd, ωnq and ωcq to achieve satisfactory performance at different grid strength. The following illustrates how the values of ζd, ωnq and ωcq are chosen.
From Eq. 39, it can be found that if the system has a zero, its damping ratio ζd is larger than ζ, which is usually selected as 0.707. Thus, the system damping ratio ζd is set as 0.8 in this paper. To ensure the voltage stability of the system under the weak grid situation, the theoretical analysis is carried out under the condition of a weak grid (SCR = 1.2). The initial value of the ωnq = 34.3 rad/s and ωcq = 50 rad/s are obtained by substituting fixed PI parameters in Supplementary Table S1 into Eq. 41, and following analysis to acquire adjusted parameters is based on them. The influence of ωnq on the system response is illustrated in Figure 12 when ωnq increases from 20 rad/s to 90 rad/s at a step of 10 rad/s. When ωnq rises, the poles progressively move distant from the imaginary axis. To get a quick response and low overshoot, the value of ωnq adopts 60 rad/s in this paper.
FIGURE 12

The influence of the ωnq. (A) Root locus with different ωnq. (B) Step response with different ωn.
Since the position of zero also affects the response of RPCL, it is discussed below. If all the zeros lie in the left half complex plane (LHP), the system is classified as minimum phase (MP) system. Conversely, if more than a zero is in the right half complex plane, the system is categorized as a non-minimum phase (NMP) system. In a NMP system, a strictly proper transfer function with an odd number of positive zeros leads to an initial undershoot of the step response and causes time delay (Bose et al., 2018).
It is unacceptable for the reactive power response during grid voltage drops in the case of the NMP system. It causes the VSG to initially absorb reactive power, further leading to a voltage drop and detrimental effect on the grid. Therefore, the zero should be placed in the LHP, and the relationship equation in Eq. 42 is obtained.
The relationship among ωcq, ωnq and ζd can be obtained from Eq. 42
With the restriction obtained in Eq. 43, ωcq ought to be less than 96 rad/s, meaning the cut-off frequency of LPF is less than 15.3 Hz. Figure 13A shows the distribution of zeros and poles when ωcq varies from 3.14 rad/s to 87.92 rad/s at a step of 12.56 rad/s. With the relationship established in Eqs 41, 43, the poles do not change, and the zero gradually approaches the imaginary axis. Figure 13B shows the change of the zero leads to the step response becoming gradually slow and the overshoot becoming small. The selection of ωcq at 62.8 rad/s is intended to ensure system stability and reduce overshoot. Therefore, all the three parameters of the RPCL are chosen. As observed from Figure 14, the proposed strategy based on parameters adjustment can achieve the desired response and is unaffected by grid strength.
FIGURE 13

The influence of the ωcq: (A) Root locus with ωcq varies; (B) Step response with ωcq varies.
FIGURE 14
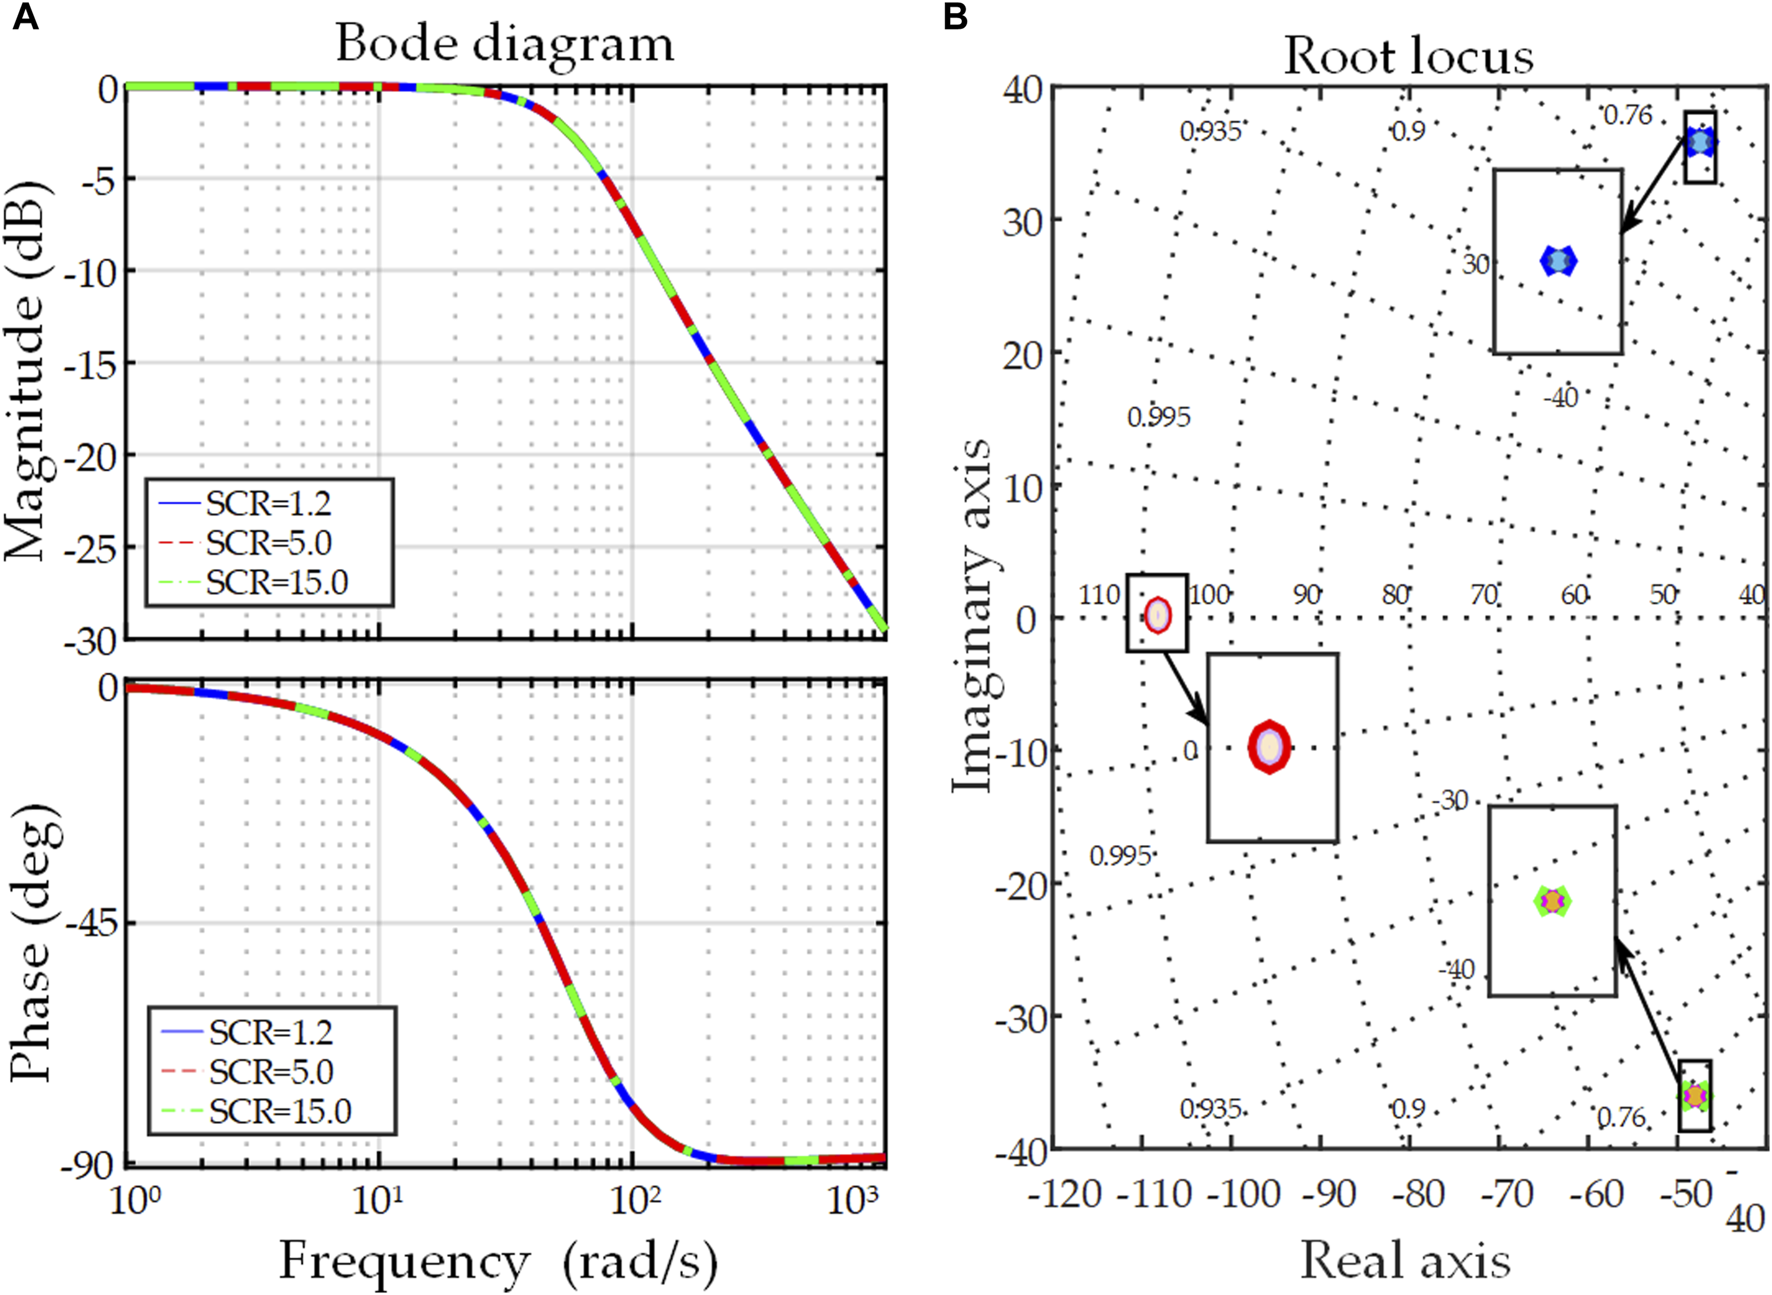
The analysis to the RPCL of the adjusted parameters under SCR changes: (A) Bode diagram; (B) Root locus.
4 Simulation and experimental results
To validate the effectiveness of the proposed method, simulations and experiments are performed using PSCAD/EMTDC and HIL platform based on Typhoon and real control devices. The simulation model and experiment model are established according to Figure 1. The average and detailed models of converter are employed in PSCAD and Typhoon, respectively. The parameters of the simulation and experiments are listed in Tables 1, 2.
TABLE 1
| Quantity | Symbol | Value | Units |
|---|---|---|---|
| Grid parameters | |||
| Rated voltage | U | 0.4 | kV |
| Rated angular frequency | ω 0 | 100π | rad/s |
| Strong gird (SCR = 15) | L g | 0.378 | mH |
| Middle gird (SCR = 5) | L g | 1.133 | mH |
| Weak grid (SCR = 1.2) | L g | 4.722 | mH |
| Inertia constant | H | 2.0 | s |
| Filter inductance | L f1, Lf2 | 0.1 | pu |
| Filter capacitance | C f | 0.05 | pu |
| Inverter parameters | |||
| Rated capacity | S n | 0.09 | MW |
| Virtual inductance | L v | 0.1 | pu |
| Virtual resistance | R v | 0.05 | pu |
| DC voltage | U dc | 1.1 | kV |
| Sample frequency | f s | 10 | kHz |
| Proportional gain of current loop | k pc | 0.2 | |
| Integral gain of current loop | kic | 15 | |
| Fixed parameters for simulation | |||
| Damping coefficient | D p | 5 | pu |
| coefficient of PFR | k ω | 20 | pu |
| Equivalent damping coefficient | k e | 20 | pu |
| APCL cut-off angular frequency | ω cp | 150 | rad/s |
| RPCL cut-off angular frequency | ω cq | 62.8 | rad/s |
| RPCL proportional coefficient | k pq | 0.1 | pu |
| RPCL integral coefficient | k iq | 20 | pu |
Parameters of the simulation.
TABLE 2
| Quantity | Symbol | Value | Units |
|---|---|---|---|
| Grid parameters | |||
| Rated voltage | U | 0.4 | kV |
| Rated angular frequency | ω 0 | 100π | rad/s |
| Strong gird (SCR = 15) | L g | 0.378 | mH |
| Middle gird (SCR = 5) | L g | 1.133 | mH |
| Weak grid (SCR = 1.2) | L g | 4.722 | mH |
| Inertia constant | H | 2.0 | s |
| Filter inductance | L f1, Lf2 | 0.1 | pu |
| Filter capacitance | C f | 0.05 | pu |
| Inverter parameters | |||
| Rated Capacity | S n | 0.09 | MW |
| Virtual Inductance | L v | 0.1 | pu |
| Virtual Resistance | R v | 0.05 | pu |
| DC voltage | U dc | 1.1 | kV |
| Sample frequency | f s | 10 | kHz |
| Proportional gain of Current Loop | k pc | 0.1 | |
| Integral gain of Current Loop | k ic | 10 | |
Parameters of the HIL experiment.
4.1 Test 1: comparisons between T-APCL and TOPD-APCL
In this sub-section, the fixed parameters listed in Table 1 is utilized, and the test is divided into two distinct parts. Taking the aim of the research into account, the first part compares the active power steady-state deviation of T-APCL and TOPD-APCL under frequency disturbance. In the second part, the active responses of TOPD-APCL and T-APCL are compared to validate the damping characteristic of the proposed strategy.
4.1.1 Decoupling of damping characteristic and PFR
For this test, the simulation scenario is set as follows. The middle grid strength with SCR = 5.0 is selected, and the active power reference is set to 0.8 pu. When t < 0.4 s, the grid frequency remains constant at 50Hz, and the VSG-type grid-forming converter operates stably in GCM. The grid frequency drops from 50 Hz to 49.9 Hz at t = 4 s, and subsequently returns to 50 Hz at t = 6 s. Figure 15 displays the waveforms of the active response using T-APCL and TOPD-APCL under grid frequency disturbance. It can be seen from Figure 15 that the steady-state deviation of the active power of the grid-forming converter using TOPD-APCL is significantly smaller than that using T-APCL when the grid frequency is reduced by 0.1 Hz. The steady-state deviations calculated by and are 0.04 and 0.05 pu, respectively, which is consistent with the analysis in the previous sections. It is evident that the proposed TOPD-APCL can precisely regulate the steady-state output of active power by PFR, and realize the decoupling between damping characteristic and PFR.
FIGURE 15

The comparison between T-VSG and TOPD-VSG during frequency drops.
4.1.2 Active power response differences
To further validate the damping characteristic of the proposed TOPD-APCL strategy, the difference in active power step response between T-APCL and TOPD-APCL is tested using the same fixed parameters. The active power reference steps from 0 to 0.4 pu at t = 0.5 s and from 0.4 pu to 0.6 pu at t = 2.5 s. The simulation results are displayed in Figures 16A, B.
FIGURE 16

Power response comparison between T-VSG and TOPD-VSG. (A) under strong grid condition (SCR = 15.0); (B) under weak grid condition (SCR = 1.2).
As visible in Figure 16A, the use of TOPD-APCL effectively mitigates the dynamic oscillations and reduces power overshoots of the active power under a strong grid. Figure 16B shows that TOPD-APCL exhibits a faster response and lower overshoots compared to T-APCL under weak grid. Through the comparison of the simulation results of T-APCL and TOPD-APCL with fixed parameters under strong and weak grids, it is evident that the proposed TOPD-APCL can provide damping. Meanwhile, it should be noted that for TOPD-APCL, the overshoot of active power is a little large under both the strong grid and weak grid. This is because the use of fixed parameters fails to demonstrate good dynamic responses at different grid strength. It will be solved in test two by using adjustable parameters.
The results in this test lead to a conclusion that TOPD-APCL can fulfill two control objectives when using the same fixed parameters. Firstly, it eliminates the negative effect of Dp on the steady-state error of the output active power under grid frequency perturbation. Secondly, it can suppress the oscillation of active power.
4.2 Test 2: testing for adaptability to different grid strength
From the analysis of RPCL in Section 2, the analysis of APCL in Section 3 and the simulation results of APCL in test 1, for TOPD-VSG, the problem of the adaptation to the grid strength remains unresolved when using the fixed parameters. This sub-section focuses on the simulation verification of the strategy proposed in Section 3 under different grid strength.
4.2.1 Strong grid condition
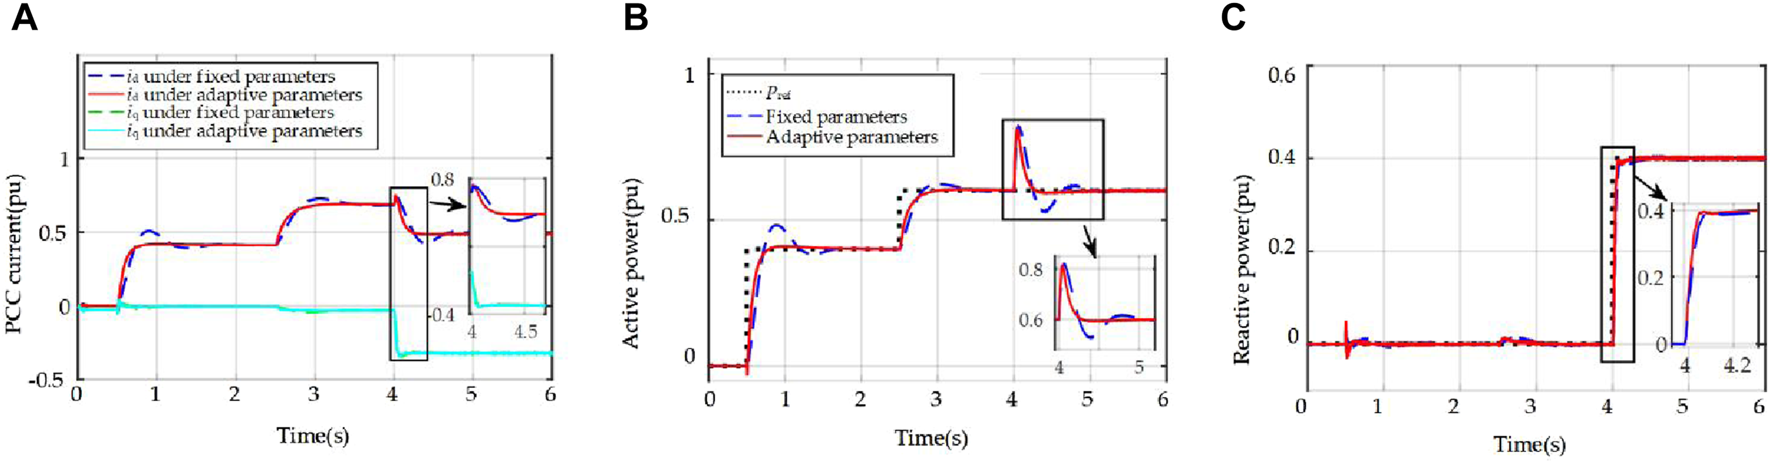
The grid impedance Lg is 0.378 mH, and SCR is set as 15. The results are shown in Figure 17 When t < 0.5 s, the controller is in a blocked state. When t = 0.5 s, the active power reference is set as 0.4 pu. At t = 2.5 s, the active power reference changes from 0.4 pu to 0.6 pu. At t = 4 s, the reactive power reference ramps up to 0.4 pu. Figure 17A shows the comparison of the PCC current in dq-frame of TOPD-VSG using fixed and adjustable parameters respectively. It can be seen that the current oscillates and there is a risk of overcurrent for the fixed parameter case, whereas there are no noticeable oscillations of the current for the adjustable parameters case. The zoomed-in view in Figure 17B shows that when the reactive power reference steps, the active power of the TOPD-VSG using fixed parameters experiences an overshoot of 57.03% with a regulation time of 328 ms. While, the active power exhibits no oscillations under the adjustable parameters, and the overshoot is only 6.7% with a regulation time of 88 ms. It can be seen that the oscillation of active power can be mitigated or even eliminated by using the adjustable parameters. The zoomed-in view of Figure 17C shows that the reactive power response of the TOPD-VSG using adjustable parameters reduces the overshoot from 46.53% to 0% and the settling time shortens from 358 ms to 168 ms. All the above simulation results validate the superiority of the proposed adjustable parameters strategy in the strong grid condition.
FIGURE 17

The simulation results of the fixed parameters and the adjustable parameters responses when power reference is changed under strong grid (SCR = 15.0): (A) PCC current in dq frame; (B) Active power; (C) Reactive power.
4.2.2 Weak grid condition
In this case, grid impedance Lg is chosen as 4.722 mH, which refers to SCR = 1.2, to simulate the very weak grid scenario. Similar to the test conditions under strong grid, the same power reference commands are assigned, and the control parameters are computed. The comparative waveforms of the PCC current in dq-frame, active and reactive power responses of the TOPD-VSG using fixed and adjustable parameters are shown in Figures 18A–C, respectively. The simulation results in Figures 18A, B show that the overshoot of the active power and the PCC current in d-axis can be eliminated by using the adjustable parameters and have a faster response than using the fixed parameters. In Figure 18C, the reactive power response using adjustable parameters is essentially identical to that with fixed parameters, which is due to the fact that the fixed parameters are designed for weak grid conditions to ensure system stability. Obviously, in the weak grid condition, the proposed strategy demonstrates its effectiveness.
FIGURE 18
The simulation results of the fixed parameters and the adjustable parameters responses when power reference is changed under weak grid (SCR = 1.2): (A) PCC current in dq-frame; (B) Active power; (C) Reactive power.
4.2.3 Changes in grid strength
Considering the dynamic fluctuations of the grid impedance, the simulation results of the proposed adjustable parameters control strategy of TOPD-VSG are given in this section under varying grid strength. The simulation results are demonstrated in Figure 19. The grid impedance is initially set to Lg = 0.378 mH (SCR = 15.0) before t = 2.5 s. At t = 2.5 s, it changes to 1.132 mH (SCR = 5.0). At t = 4.5 s, Lg is changed again to reach 4.722 mH (SCR = 1.2). Figures 19A, B demonstrate that the parameters (i.e., ke, ωn and ωcq) of APCL and parameters (i.e., kp, ki) of RPCL can be automatically adjusted according to the expressions in Eqs 30, 41 after a change in the grid impedance. It can be seen from Figures 19C, D that when grid impedance varies, the overshoots of the active and reactive power responses are both less than 10%. Based on the aforementioned results and analysis, there is no doubt that the adjustable parameters control strategy is effective.
FIGURE 19

The simulation results when grid strength is changed: (A) Adjustable parameters of APCL; (B) Adjustable parameters of RPCL; (C) Active power; (D) Reactive power.
4.3 Test 3: testing in a HIL platform
HIL experiments are carried out in sub-section. Figure 20 illustrates the HIL platform comprising the Typhoon HIL602, a digital signal processor TMS320F28335, an oscilloscope, a PC, and a monitor. The parameters for the HIL experiment are listed in Table 2. The proposed adjustable parameters strategy is tested in the strong grid case, weak grid case, and grid strength changes case.
FIGURE 20

Experimental setup of the TOPD-VSG.
4.3.1 Adaptability to various grid strength
The experimental results for the strong grid are shown in Figure 21A, and the results for the weak grid are illustrated in Figure 21B. The adjustable parameters strategy is triggered three times when the active and reactive reference are altered at t1, t2 and t3. Specifying the references of power as follows, Pref = 0.4 pu and Qref = 0.0, Pref = 0.6 pu and Qref = 0.1 pu, and Pref = 0.6 pu and Qref = 0.4 pu, respectively. According to Figures 21A, B, it is not difficult to find that the experimental verification and comparison results in both strong and weak grid are consistent with the validation of the simulation as shown in Figures 17, 18.
FIGURE 21
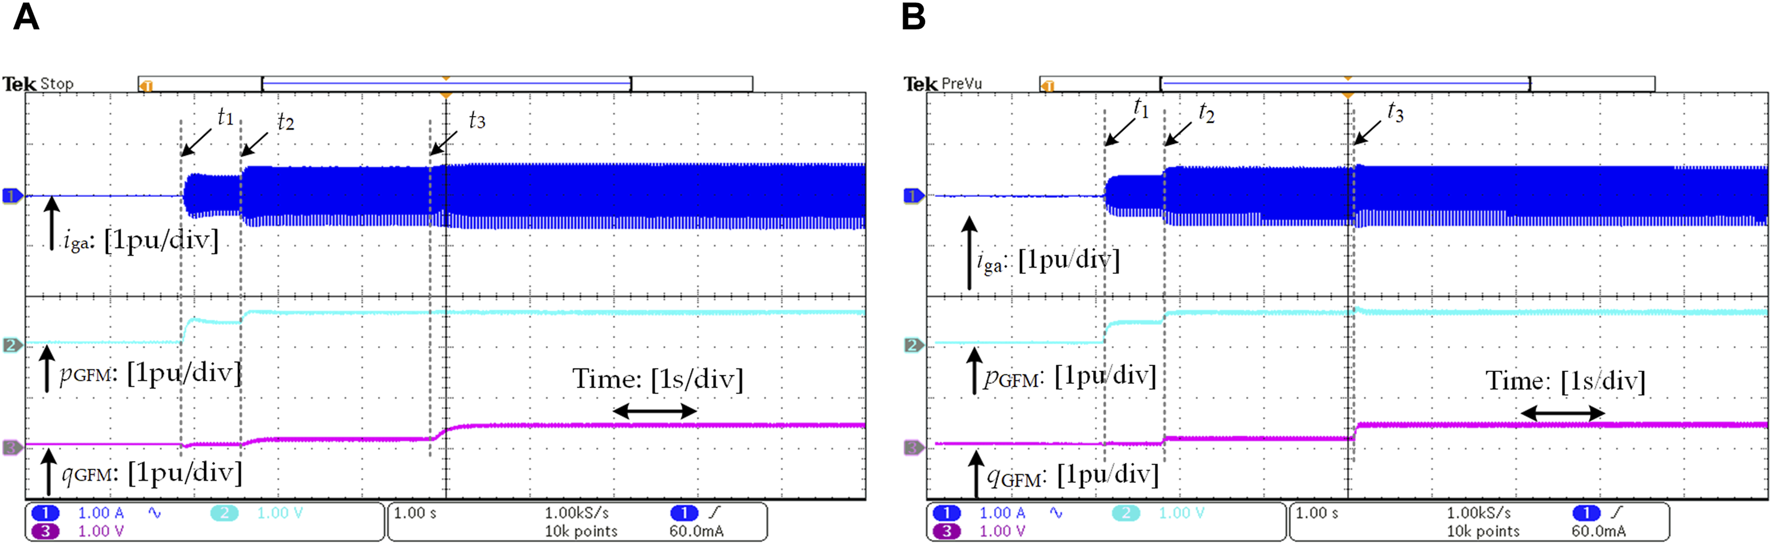
The experimental results when power reference is changed: (A) under strong grid (SCR = 15); (B) under weak grid (SCR = 1.2).
4.3.2 Grid strength changes case
In an effort to further appraise the effectiveness of the proposed adjustable parameters control strategy of TOPD-VSG, the HIL experiments on varying grid strength are also performed. At t1, t2 and t3, the active power and reactive power reference change, and their values are set the same as in the previous tests. The grid impedance changes at t4. Figures 22, 23 shows the waveforms of PCC current, active power and reactive power obtained in Typhoon. The former corresponds to the scenario when the system transitions from a strong grid to a medium grid. The latter reflects the transition from a medium grid to a weak grid. In comparison to the simulation results gained in Figure 19, the experiment results align closely with the simulation results. As the system strength decreases, the current also diminishes. It affirms the effectiveness of the proposed adjustable parameters control strategy.
FIGURE 22

The experimental results when SCR steps from 15.0 to 5.0.
FIGURE 23

The experimental results when SCR steps from 5.0 to 1.5.
5 Conclusion
Modern power system is characterized by low inertia and weak damping gradually due to the increasing proportion of renewable energy sources. VSG-type grid-forming converter is an effective solution under this background. After analyzing the shortcomings of conventional damping emulation strategies, a transient damping power strategy has been proposed in this article to obtain better performance from VSG. The proposed strategy utilizes the oscillation component of the difference of active power and provides a positive damping to suppress the fluctuation of active power during transient period. It also does not affect the governor characteristic and addresses the coupling problem between damping coefficient and PFR coefficient. Meanwhile, after analyzing the effect of key parameters of the proposed method through small-signal model, an adjustable parameters method is designed by using a reduced-order approach. The adjustable parameters can ensure the effectiveness of suppressing power oscillation when grid strength varies. Moreover, by analyzing the dynamic response of RPCL when grid strength varies and considering the effect of the zeros on RPCL, the key parameters of RPCL are designed appropriately to adapt to the varying grid strength. Both simulation and experimental results verify that VSG can reach a new steady state when the reference power steps without oscillation, and operate stably under different grid strength with designed controller parameters.
Statements
Data availability statement
The original contributions presented in the study are included in the article/Supplementary Material, further inquiries can be directed to the corresponding authors.
Author contributions
XH: Conceptualization, Formal Analysis, Funding acquisition, Methodology, Supervision, Writing–review and editing. ZL: Conceptualization, Investigation, Methodology, Project administration, Writing–review and editing. ZS: Formal Analysis, Investigation, Validation, Writing–original draft. YW: Formal Analysis, Investigation, Validation, Writing–original draft.
Funding
The author(s) declare that financial support was received for the research, authorship, and/or publication of this article. This work was supported by the science and technology project of State Grid Hebei Electric Power Co., LTD. Under Grant kj2023-069.
Conflict of interest
Authors XH and ZL were employed by State Grid Hebei Electric Power Co., Ltd.
The remaining authors declare that the research was conducted in the absence of any commercial or financial relationships that could be construed as a potential conflict of interest.
The authors declare that this study received funding from State Grid Hebei Electric Power Co., Ltd. The funder had the following involvement in the study: design, preparation of the manuscript, and the decision to submit it for publication.
Publisher’s note
All claims expressed in this article are solely those of the authors and do not necessarily represent those of their affiliated organizations, or those of the publisher, the editors and the reviewers. Any product that may be evaluated in this article, or claim that may be made by its manufacturer, is not guaranteed or endorsed by the publisher.
Supplementary material
The Supplementary Material for this article can be found online at: https://www.frontiersin.org/articles/10.3389/fenrg.2024.1403213/full#supplementary-material
References
1
Alipoor J. Miura Y. Ise T. (2015). Power system stabilization using virtual synchronous generator with alternating moment of Inertia. IEEE J. Emerg. Sel. Top. Power Electron.3 (2), 451–458. 10.1109/jestpe.2014.2362530
2
Bose S. Hote Y. V. Hanwate S. D. (2018). “Analysis of practical non-minimum phase systems by transfer function approach,” in Proceedings of 2018 4th international conference on electrical energy systems (ICEES) (Chennai, India: Institute of Electrical and Electronics Engineers), 500–505.
3
Chen M. Zhou D. Blaabjerg F. (2021). Active power oscillation damping based on acceleration control in paralleled virtual synchronous generators system. IEEE Trans. Power Electron.36 (8), 9501–9510. 10.1109/tpel.2021.3051272
4
Dong S. Chen Y. C. (2017). Adjusting synchronverter dynamic response speed via damping correction loop. IEEE Trans. Energy Convers.32 (2), 608–619. 10.1109/tec.2016.2645450
5
Driesen J. Visscher K. (2008). “Virtual synchronous generators,” in Proceedings of the 2008 IEEE power and energy society general meeting-conversion and delivery of electrical energy in the 21st century (Pittsburgh, PA, USA: Institute of Electrical and Electronics Engineers). 10.1109/PES.2008.4596800
6
Ebrahimi M. Khajehoddin S. A. Karimi-Ghartemani M. (2019). An improved damping method for virtual synchronous machines. IEEE Trans. Sustain. Energy10 (3), 1491–1500. 10.1109/tste.2019.2902033
7
Fang J. Deng H. Goetz S. M. (2021). Grid impedance estimation through grid-forming power converters. IEEE Trans. Power Electron.36 (2), 2094–2104. 10.1109/tpel.2020.3010874
8
Gao F. Iravani M. R. (2008). A control strategy for a distributed generation unit in grid-connected and autonomous modes of operation. IEEE Trans. Power Deliv.23 (2), 850–859. 10.1109/tpwrd.2007.915950
9
Golestan S. Guerrero J. M. Vasquez J. C. (2017). Three-phase plls: a review of recent advances. IEEE Trans. Power Electron.32 (3), 1894–1907. 10.1109/tpel.2016.2565642
10
Hu S. (2013). “Time domain analysis of high order systems,” in Principle of automatic control. 6th ed. (China: Science Press), 88–93.
11
Huang Y. Ma X. Zhang J. Liu J. Lu Y. Zhao Z. et al (2024). Study on the optimization of damping control strategy for grid-forming VSC-HVDC. Power Syst. Technol.48 (2), 889–897. 10.13335/j.1000-3673.pst.2023.0232
12
Khajehoddin S. A. Karimi-Ghartemani M. Ebrahimi M. (2019). Grid-supporting inverters with improved dynamics. IEEE Trans. Industrial Electron.66 (5), 3655–3667. 10.1109/tie.2018.2850002
13
Kundur P. (1994). “Introduction to the power system stability problem,” in Power system stability and control. 1th ed. (New York, USA: Mc Graw Hill, Inc.), 18–26.
14
Lan Z. Liu Z. He D. Zeng J. Yu X. Long Y. (2023). Active oscillation suppression strategy of paralleled virtual synchronous generators based on transient electromagnetic power compensation. Power Syst. Technol.47 (1), 23–33. 10.13335/j.1000-3673.pst.2022.0488
15
Li J. Wen B. Wang H. (2019). Adaptive virtual inertia control strategy of VSG for micro-grid based on improved bang-bang control strategy. IEEE Access7, 39509–39514. 10.1109/access.2019.2904943
16
Liu J. Miura Y. Ise T. (2016). Comparison of dynamic characteristics between virtual synchronous generator and droop control in inverter-based distributed generators. IEEE Trans. Power Electron.31 (5), 3600–3611. 10.1109/tpel.2015.2465852
17
Liu J. Miura Y. Ise T. (2019). Fixed-parameter damping methods of virtual synchronous generator control using state feedback. IEEE Access7, 99177–99190. 10.1109/access.2019.2930132
18
Mandrile F. Mallemaci V. Carpaneto E. Bojoi R. (2023). Lead-lag filter-based damping of virtual synchronous machines. IEEE Trans. Industry Appl.59 (6), 6900–6913. 10.1109/tia.2023.3293779
19
Mohamed Y. A.-R. I. El-Saadany E. F. (2008). Adaptive decentralized droop controller to preserve power sharing stability of paralleled inverters in distributed generation microgrids. IEEE Trans. Power Electron.23 (6), 2806–2816. 10.1109/tpel.2008.2005100
20
Mohammed N. Ravanji M. H. Zhou W. Bahrani B. (2023). Online grid impedance estimation-based adaptive control of virtual synchronous generators considering strong and weak grid conditions. IEEE Trans. Sustain. Energy14 (1), 673–687. 10.1109/tste.2022.3223976
21
Pan D. Wang X. Liu F. Shi R. (2020). Transient stability of voltage-source converters with grid-forming control: a design-oriented study. IEEE J. Emerg. Sel. Top. Power Electron.8 (2), 1019–1033. 10.1109/jestpe.2019.2946310
22
Rathnayake D. B. Akrami M. Phurailatpam C. Me S. P. Hadavi S. Jayasinghe G. et al (2021). Grid forming inverter modeling, control, and applications. IEEE Access9, 114781–114807. 10.1109/access.2021.3104617
23
Rocabert J. Luna A. Blaabjerg F. Rodriguez P. (2012). Control of power converters in AC microgrids. IEEE Trans. power Electron.27 (11), 4734–4749. 10.1109/tpel.2012.2199334
24
Shintai T. Miura Y. Ise T. (2014). Oscillation damping of a distributed generator using a virtual synchronous generator. IEEE Trans. Power Deliv.29 (2), 668–676. 10.1109/tpwrd.2013.2281359
25
Shuai Z. Huang W. Shen Z. Luo A. Tian Z. (2020). Active power oscillation and suppression techniques between two parallel synchronverters during load fluctuations. IEEE Trans. Power Electron.35 (4), 4127–4142. 10.1109/tpel.2019.2933628
26
Suul J. A. D'Arco S. Guidi G. (2016). Virtual synchronous machine-based control of a single-phase bi-directional battery charger for providing vehicle-to-grid services. IEEE Trans. Industry Appl.52 (4), 3234–3244. 10.1109/tia.2016.2550588
27
Thao H. V. Le Van T. Nguyen Thi T. M. Quan Duong M. Sava G. N. (2021). Improving the output of dc-dc converter by phase shift full bridge applied to renewable energy. Rev. Roum. Des. Sci. Tech.66 (3), 175–180.
28
Wang F. Zhang L. Feng X. Guo H. (2018). An adaptive control strategy for virtual synchronous generator. IEEE Trans. Industry Appl.54 (5), 5124–5133. 10.1109/tia.2018.2859384
29
Wang Z. Yu Y. Gao W. Davari M. Deng C. (2022). Adaptive, optimal, virtual synchronous generator control of three-phase grid-connected inverters under different grid conditions—an adaptive dynamic programming approach. IEEE Trans. Industrial Inf.18 (11), 7388–7399. 10.1109/tii.2021.3138893
30
Wen C. Chen D. Hu C. Piao Z. Zhou J. (2018). Self-adaptive control of rotational inertia and damping coefficient of VSG for converters in microgrid. Automation Electr. Power Syst.42 (17), 120–126+183. 10.7500/AEPS20180202001
31
Wen Y. Dai Y. Bi D. Guo R. Peng Z. (2017). A grid friendly PV/BESS distributed generation control strategy. Proc. CSEE37 (02), 464–476. 10.13334/j.0258-8013.pcsee.161660
32
Wu H. Ruan X. Yang D. Chen X. Zhao W. Lv Z. et al (2016). Small-signal modeling and parameters design for virtual synchronous generators. IEEE Trans. Industrial Electron.63 (7), 4292–4303. 10.1109/tie.2016.2543181
33
Yan X. Jia J. (2019). Decoupling control of primary frequency regulation and rotational speed damping of vsg. Power Syst. Technol.43 (4), 1566–1575. 10.13335/j.1000-3673.pst.2018.2302
34
Yu Y. Chaudhary S. K. Tinajero G. D. A. Xu L. Bakar N. N. B. A. Vasquez J. C. et al (2022). A reference-feedforward-based damping method for virtual synchronous generator control. IEEE Trans. Power Electron.37 (7), 7566–7571. 10.1109/tpel.2022.3152358
35
Yu Y. Tinajero G. D. A. Chaudhary S. K. Xu L. Bakar N. N. B. A. Guerrero J. M. et al (2021). “A comparison of fixed-parameter active-power-oscillation damping solutions for virtual synchronous generators,” in Proceedings of IECON 2021-47th annual conference of the (Toronto, ON, Canada: IEEE Industrial Electronics Society). 10.1109/IECON48115.2021.9589433
36
Zhang H. Xiang W. Lin W. Wen J. (2021). Grid forming converters in renewable energy sources dominated power grid: control strategy, Stability, Application, and Challenges. J. Mod. Power Syst. Clean Energy9 (6), 1239–1256. 10.35833/mpce.2021.000257
37
Zhong Q. Weiss G. (2011). Synchronverters: inverters that mimic synchronous generators. IEEE Trans. Industrial Electron.58 (4), 1259–1267. 10.1109/tie.2010.2048839
Summary
Keywords
transient damping, adjustable parameters, virtual synchronous generator (VSG), strong and weak grid, grid-forming converter
Citation
Hu X, Li Z, Shu Z and Wang Y (2024) Adjustable parameters-based control strategy for VSG-type grid forming converters considering grid strength. Front. Energy Res. 12:1403213. doi: 10.3389/fenrg.2024.1403213
Received
19 March 2024
Accepted
06 June 2024
Published
11 July 2024
Volume
12 - 2024
Edited by
Shuqing Zhang, Tsinghua University, China
Reviewed by
Minh Quan Duong, University of Science and Technology, The University of Danang, Vietnam
Rossano Musca, University of Palermo, Italy
Updates
Copyright
© 2024 Hu, Li, Shu and Wang.
This is an open-access article distributed under the terms of the Creative Commons Attribution License (CC BY). The use, distribution or reproduction in other forums is permitted, provided the original author(s) and the copyright owner(s) are credited and that the original publication in this journal is cited, in accordance with accepted academic practice. No use, distribution or reproduction is permitted which does not comply with these terms.
*Correspondence: Xuekai Hu, 719872361@qq.com; Zhipeng Shu, shushu0116@126.com
Disclaimer
All claims expressed in this article are solely those of the authors and do not necessarily represent those of their affiliated organizations, or those of the publisher, the editors and the reviewers. Any product that may be evaluated in this article or claim that may be made by its manufacturer is not guaranteed or endorsed by the publisher.