 Timothy Tibesigwa
 Peter W. Olupot
- Department of Mechanical Engineering, Makerere University, Kampala, Uganda
Sustainable energy sources are continually advocated as the globe strives to transition from non-renewable forms. Energy security risks associated with the gradual depletion of petroleum resources and the related climate change effects require remedies. Nations have enacted laws stipulating biofuel blending mandates to reverse these adverse effects. Using the Low Emissions Analysis Platform (LEAP) software, this study assessed the potential long-term impact on energy demand and CO2 emissions from implementing B10 (10% biodiesel and 90% conventional diesel blend) in Uganda’s petroleum sub-sector was assessed. Four scenarios were analysed from 2019 to 2050: baseline (100% fossil diesel), B10, B20 (20% biodiesel and 80% conventional diesel blend), and electric-powered transport, were analysed for 2019 to 2050. The analysis revealed that replacing fossil diesel with B10 reduces fossil-derived energy demand by 3.52% and projects an 8.38% reduction in CO2 emissions compared to the baseline scenario. The B20 and electric vehicle scenarios offer an even greater reduction. Specifically, the B20 scenario shows an 8.46% decrease, and the electric scenario shows a 9.98% decrease in fossil-derived energy demand. These reductions are attributed to the lower proportion of fossil fuels in biodiesel blends and the higher energy efficiency of electric vehicles. B10 use as a substitute fuel for diesel-powered vehicles is expected to mitigate transport sector emissions in Uganda with minimal impact on final energy demand. B20 and electrification scenarios with lower final energy demand and higher environmental impact reductions are more advantageous relative to the B10 and baseline scenarios. Future analyses should establish the optimal renewable fuel and vehicular technologies mix for a net zero scenario by 2050 for Uganda’s transport sector.
1 Introduction
Global energy use is projected to grow to about 50% by 2050, mainly due to gross domestic product (GDP) and population growth in non-OECD countries (EIA, 2021). The continued dominance of fossil fuels and the resultant emissions deter the attainment of the goal of keeping the global temperature rise below 2°C (Renewable Energy Agency, 2018). The transport sector accounts for over 20% of global energy consumption and mainly relies on petroleum products (Yu et al., 2022). The transport sector generates 15% (8.7 GtCO2-eq) of global total net anthropogenic GHG emissions (IPCC, 2022). Annual imports of oil products by Uganda’s downstream petroleum sub-sector stand at about two billion litres, almost all of which are used for transport (MEMD, 2018c). Diesel consumption of one billion litres per annum constitutes the largest share (47%) of oil imports. Reliance on these petroleum products for road transportation affects the country’s meagre foreign currency earnings and energy security and contributes about 3% of the country’s total emissions (MoWE, 2019).
Firm action is needed to reverse the devastating impacts on global climate, energy security, and economic growth resulting from oil use. Research on the decarbonization of transport through the production and use of cleaner energy sources is being prioritised by many nations. Increased renewable energy supply is crucial for meeting global energy transition and emission reduction goals (IEA, 2021). Governments are advocating for policies that promote the use of alternative energy forms. These could enable them to meet their Nationally Determined Commitments (NDCs) for reducing greenhouse gas emissions in compliance with the 2015 Paris Agreement. Liquid biofuels, renewable substitutes for transportation fuels, have attracted global interest. These form part of different nations’ commitments to climatic change mitigation (Sandesh and Ujwal, 2021). The other critical arguments for their production and use are energy security and their contribution to rural development (Popp et al., 2014). Biofuel deployment by different nations is supported by policy and legal frameworks with specified blending thresholds for fossil fuels with biofuels (Tibesigwa et al., 2021). The European Commission set a target of 15% renewable energy use within the European Union (EU) transport sector by 2030 (Baudry et al., 2017). The Uganda biofuels bill (MEMD, 2016a), which advocated for the mandatory blending of fossil fuels with up to 10% of biofuels, was passed into law in 2018 (MEMD, 2018a). Earlier in the Renewable Energy Policy of Uganda (MEMD, 2008), a B20 blend had been recommended. B20 would exacerbate the challenge of availing biodiesel feedstocks as the required quantity doubles that of B10. The second-generation feedstocks considered for biodiesel production in Uganda include castor (ricinus communis), croton megalocarpus, and jatropha curcas (MEMD and NOVI Energy, 2011). The government of Uganda is also championing other sustainable mobility options, including the recent establishment of a local electric vehicle manufacturing company. Implementation of sustainable alternatives in the transport sector is impeded by high investment costs, a non-comprehensive regulatory framework, and inadequate e-mobility infrastructure (Okello and Reynolds, 2022).
Energy demand and environmental impacts due to renewable energy forms have been evaluated for different geographies. These included future energy demand and environmental emissions forecasting studies with the main focus on i) energy consumption and gaseous emissions projection in Malaysia (Azam et al., 2016), ii) analysis of the energy demand consumption in road transport in China (Hu et al., 2010), iii) impacts of palm oil-based biofuel utilisation policies in the Thai transport sector (Wattana et al., 2022), and analysis of the possible pathways for energy transition toward carbon neutrality in China (Yang et al., 2022). These studies have varied approaches to show the energy and emissions implications of different fuel types in the transport sector. Methodologies for analysing energy and environmental systems include MARKAL/TIMES, MESSAGE, EnergyPLAN, LCA, CGE, Input-Output (I-O) analysis, and LEAP (Wattana et al., 2022). The Low Emissions Analysis Platform (LEAP), a powerful, versatile software system for integrated energy planning and climate change mitigation assessment, has been used in many sustainable energy planning studies. It was chosen because it can perform long-term energy, environmental, and cost analyses based on scenarios representing various energy production and consumption cases from different sources. It can also account for sources and sinks of gas (GHG) emissions in both the energy and non-energy sectors (Stockholm Environment Institute, 2022).
Transitioning to electricity-based cleaner energy for automobiles in the medium to long term to mitigate climate change effects is being promoted globally. This, however, needs to be complemented by other appropriate, clean, and sustainable energy forms, mainly for developing countries like Uganda. These shall enable a gradual shift or replacement of the existing fossil-diesel-powered vehicles fleet to or with electric vehicles, with minimal environmental damage and socio-economic ramifications. For example, the B10 biodiesel blend advocated for by Uganda’s biofuels law as a potential substitute for fossil diesel is expected to impact energy demand and reduce greenhouse gas emissions when used in combustion engines. However, the sustainability of B10 use a transport fuel viz other energy options is unknown. The potential impacts of B10 use need to be quantified and compared with the other transportation fuel options, including fossil diesel, B20 stipulated by Uganda’s Renewable Energy, and the use of electric vehicles. This study, therefore, applied the Low Emissions Analysis Platform (LEAP) to investigate the effect on energy demand and CO2 emissions within Uganda’s transport sector that would result from implementing a B10 policy. B10 use impacts were compared with those of fossil diesel, B20, and Electric vehicles.
2 Methodology
The Low Emissions Analysis Platform (LEAP) was applied to the assessment done in this study. LEAP is an integrated software tool used to simulate and optimise energy systems. It can perform long-term energy, environmental, and cost analyses based on scenarios representing various energy production and consumption cases from different sources. It considers sources and sinks of gas (GHG) emissions in the energy and non-energy sectors. Many studies have used LEAP to perform long-range forecasts of energy demand (Rivera-Gonzalez et al., 2019) and analyses of the environmental impacts of energy systems (Fondazione Eni et al., 2021). This study assessed the potential impact on energy demand and CO2 emissions in Uganda’s transport by substituting petroleum diesel in internal combustion engines (ICEs) with cleaner energy. The assessment focused on the following alternatives: B10, B20, and electric vehicles. The B10 blend advocated for by Uganda’s biofuels bill, as a potential substitute for use in diesel-powered ICEs, was compared against these cleaner energy forms and fossil diesel.
2.1 Scenario development and biodiesel projections
2.1.1 Scenario development
In this study, four different scenarios were developed to assess the impacts on energy demand and emissions: baseline (fossil diesel), B10, B20, and electric vehicle scenarios. These scenarios, depicted in Figure 1; Table 1, enabled the investigation of the energy and environmental impacts of various biodiesel blends and electricity as alternatives to petroleum diesel for use in internal combustion engines (ICEs) over 30 years. Current diesel consumption demand and emissions trends in Uganda were compared with projected trends for these scenarios. The demand for B10 and B20 was projected using the LEAP software based on Uganda’s current and future transportation fuel requirements. For B10, the biodiesel demand was calculated as 10% of the total diesel consumption, while for B20, it was 20%. The annual diesel consumption of Uganda is 1 billion liters. Therefore the annual biodiesel demand for B10 would be 100 million liters, and for B20, it would be 200 million liters (MEMD, 2022).
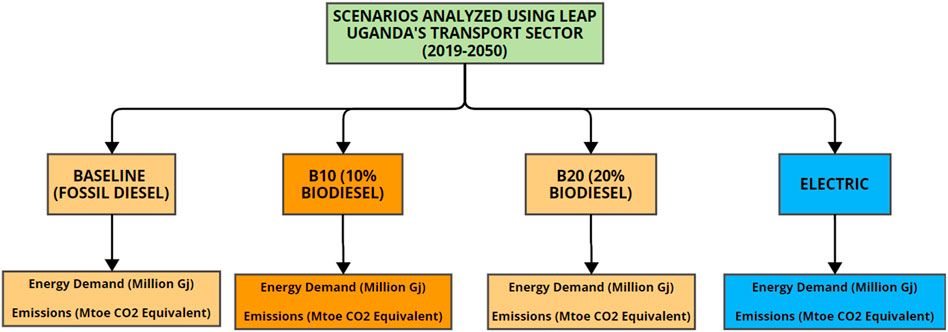
Figure 1. Structure showing different types of scenarios analysed in LEAP.
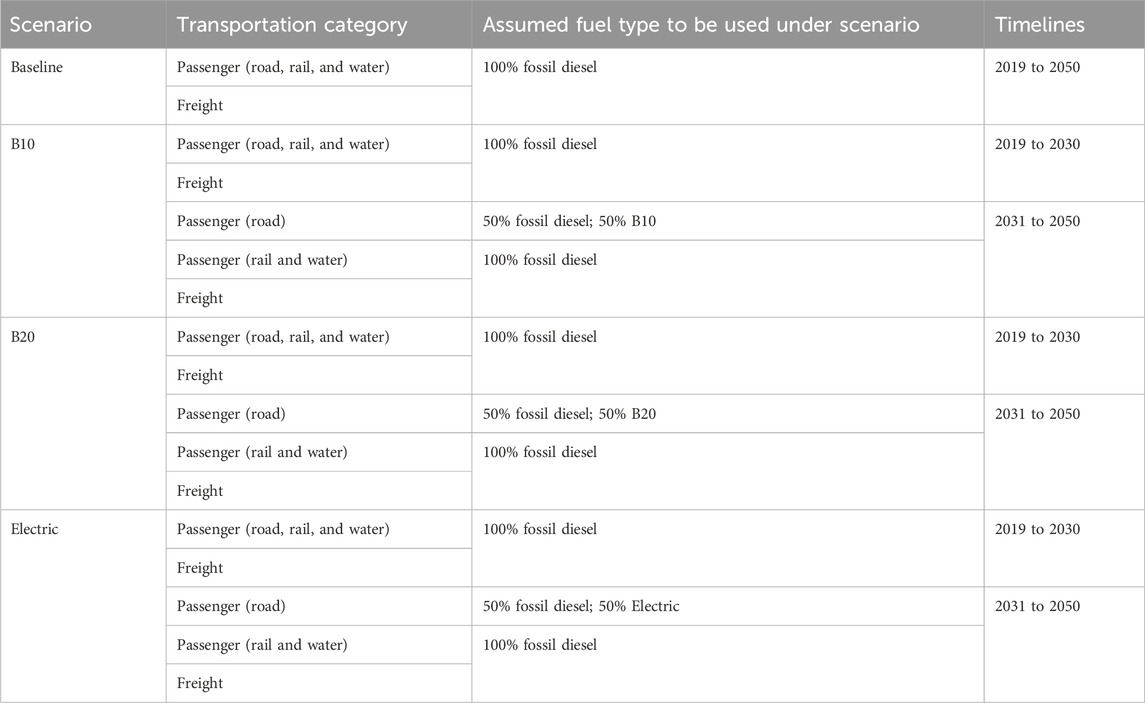
Table 1. Scenario development by transportation category, fuel type, and period.
2.1.2 Trade-off analysis
The trade-off between fossil diesel and biodiesel involves considerations of cost, energy density, and environmental impact. Biodiesel has a lower energy content (around 10% less) than fossil diesel, which may slightly increase the volume of fuel needed (Knothe et al., 2010). However, biodiesel’s renewable nature and potential for reducing CO2 emissions make it a favourable alternative (Hill et al., 2006). The shift to B10 and B20 can reduce Uganda’s reliance on imported fossil diesel, thereby improving energy security and reducing the trade deficit (Popp et al., 2014).
2.1.3 Feedstock CO2 emissions analysis
The CO2 emissions from biodiesel production depend on the feedstock used. Life Cycle Assessment (LCA) of castor, croton, and jatropha reveals varying impacts on emissions. Castor produces moderate CO2 emissions due to its higher oil yield per hectare and lower fertiliser requirement (Roy et al., 2016). Croton yields low CO2 emissions because it can grow on marginal lands with minimal inputs (Nyamai et al., 2015). Jatropha generates the lowest CO2 emissions among the three, attributed to its drought resistance and high oil content (Achten et al., 2010). Based on these analyses, jatropha appears to be the most sustainable feedstock for minimising CO2 emissions in biodiesel production.
2.1.4 Differences between EVs and ICEs
Electric vehicles (EVs) use electric motors, which are fundamentally different from the internal combustion engines (ICEs) found in conventional vehicles. This difference has significant implications for energy efficiency, emissions, and overall vehicle performance. Electric motors are considerably more efficient than ICEs, which can convert over 85% of electrical energy from the battery to power the wheels. In contrast, ICEs only convert about 20%–30% of the energy from fuel to power the vehicle (DOE and EPA, 2022). This higher efficiency in electric motors results in reduced energy demand for EVs compared to vehicles with ICEs. Additionally, EVs produce zero tailpipe emissions, whereas ICEs emit CO2 and other pollutants during fuel combustion, contributing to greenhouse gas emissions and air pollution (IEA, 2021). Therefore, The use of EVs presents a significant advantage in reducing emissions and improving air quality.
Moreover, electric motors have fewer moving parts than ICEs, leading to lower maintenance requirements and costs. EVs also provide instant torque, which results in quick acceleration and a smoother driving experience (Ehsani et al., 2018). The LEAP software models these differences by incorporating the higher energy efficiency of electric motors and the absence of tailpipe emissions in the EV scenario. Consequently, the projected energy demand and emissions reductions in the EV scenario are based on these inherent advantages of electric motors over ICEs.
2.1.5 System boundary for CO2 emission analysis
In a related earlier study, Tibesigwa et al. (2021) evaluated CO2 emissions from biodiesel production across the entire lifecycle: plant farming, oil extraction, biodiesel conversion, and distribution and use. The study compared these stages to petroleum diesel, focusing on feedstocks like castor, croton, and jatropha, with jatropha resulting in lower emissions due to minimal input requirements. Differences in efficiency and emissions were noted between oil extraction methods, such as mechanical pressing and chemical solvent extraction. The energy-intensive transesterification process significantly contributed to the carbon footprint, especially for oils with higher free fatty acid content. Distribution and use included emissions from transportation and combustion, which were lower for biodiesel due to its renewable feedstock. The life cycle assessment (LCA), adhering to ISO 14040 standards and using Umberto LCA software, demonstrated the environmental benefits of biodiesel blends compared to fossil diesel.
2.2 Modelling in the LEAP system
In the LEAP system’s design configuration, the base year parameters (scenario: current accounts) were determined, defined, and modelled following a hierarchical tree illustrated in Figure 2. The hierarchical tree comprised the following two modules:
i) “Key Assumptions” where socio-economic variables were entered, and
ii) “Demand” module, where data on the final energy consumption of each sub-sector with the respective branches was entered. In this case, vehicular classes and their respective types of fuel consumed were represented as shown in Figure 2.
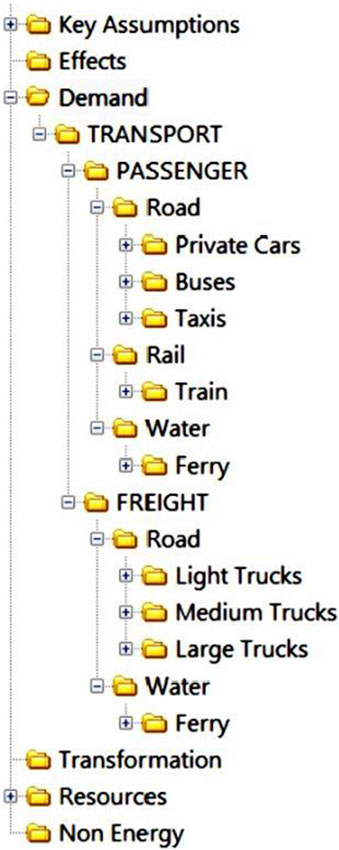
Figure 2. Hierarchical tree for design modules.
The various branches of the hierarchical tree were built with the available data for the base year. Figure 3 shows Uganda’s transportation categories and vehicle fleets grouped within the LEAP model under this assessment.
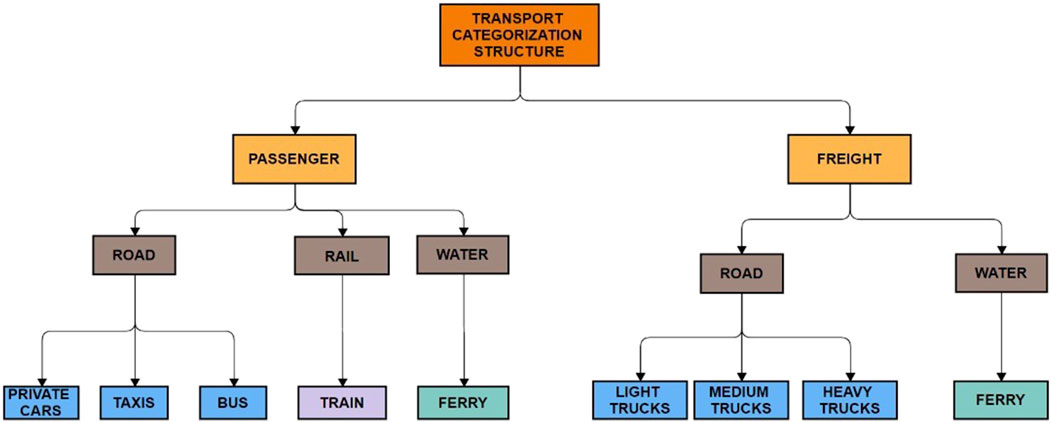
Figure 3. Transport categorization structure of Uganda modelled in LEAP.
2.3 Data considerations
A broad range of information on various aspects of energy demand and environmental emissions was obtained from Ugandan primary data/socio-economic statistics and secondary sources to assess scenario impacts. Energy demand projections for 2019–2050 were calculated in LEAP based on transportation data from the Ministry of Works and Transport (MoWT, 2022). The National Integrated Transport Master Plan developed by this Ministry provided critical primary baseline data on Uganda’s Transport Sector (MoWT, 2022) and energy consumption/supply data from the Ministry of Energy and Mineral Development (MEMD, 2022). The environmental emissions data required for calculating projected CO2 emissions were obtained from the Ministry of Water and Environment (MoWE, 2019). In addition, the Energy Policy of Uganda (MEMD, 2002), Renewable Energy Policy (MEMD, 2008), Biofuels Act (MEMD, 2018b), Biofuels Bill (MEMD, 2016b), and the Works and Transport Sector Development Plan (MoWT, 2017) provided vital information for this assessment. Other parameters, assumptions, and data sources used in modelling within LEAP are listed in Table 2.
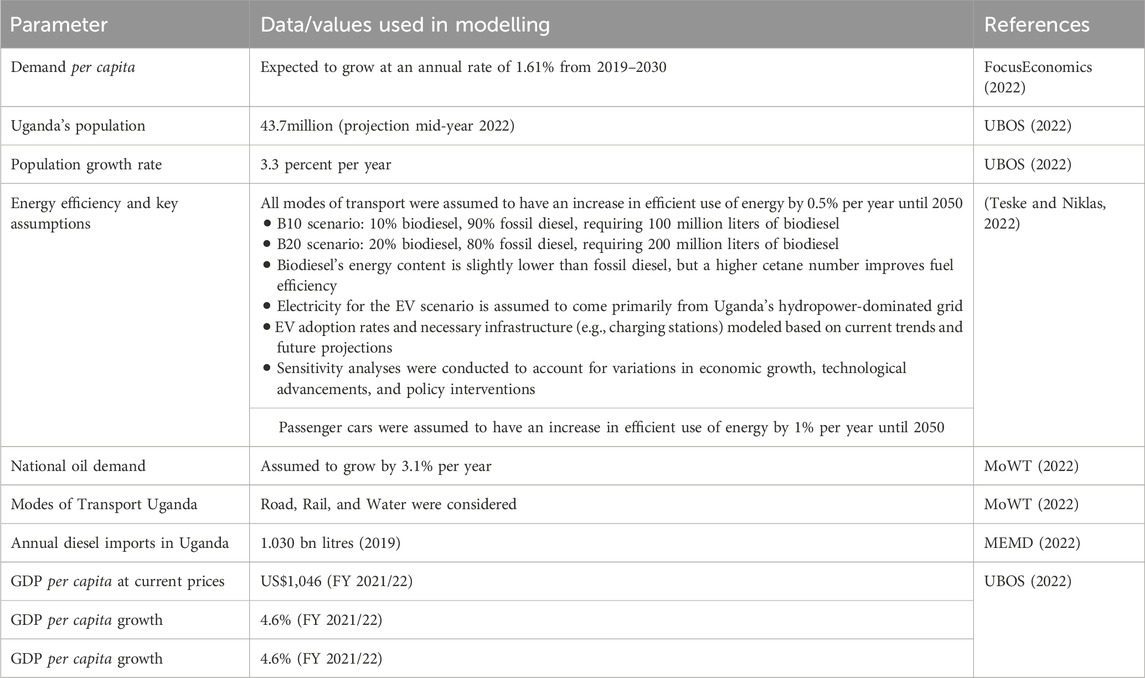
Table 2. Parameters used in modelling within LEAP.
2.3.1 Passenger transport category
Under this category, the modes of transport considered included road, rail, and water. Vehicle types for road transport were private cars, buses, taxis, rail transport trains, and ferries for water transport. Road transport is the dominant mode of transport in Uganda, with other modes like air, water, and rail still growing with limited utilisation (Atlassian/WFP, 2013). Therefore, in this analysis, road transport was assumed to comprise 96% of Uganda’s transport, with road and water transport taking 2% each. A summary of the percentage share of vehicle km under the passenger transport category is shown in Table 3.
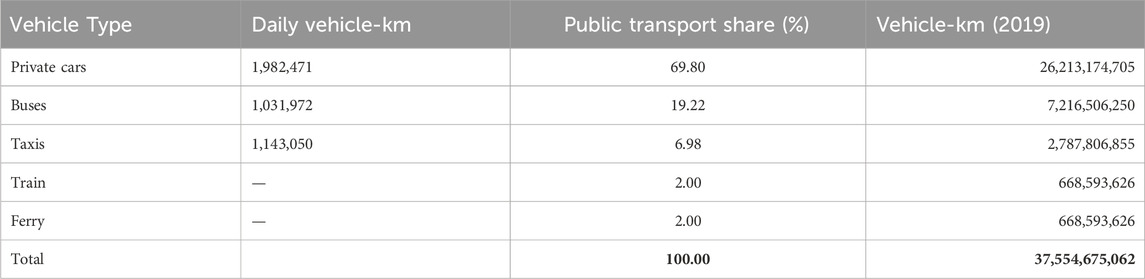
Table 3. Summary of the percentage share of vehicle-km under the passenger transport category.
2.3.2 Freight transport category- data considerations
Table 4 summarises the vehicle kilometerskilometerskilometers for freight transport (small, medium, and large trucks) for the base year 2019 (MoWT, 2022). It also contains data used for modeling the four different energy scenarios. Small trucks account for about half of the freight vehicle kilometers, with large and medium trucks taking the other half.
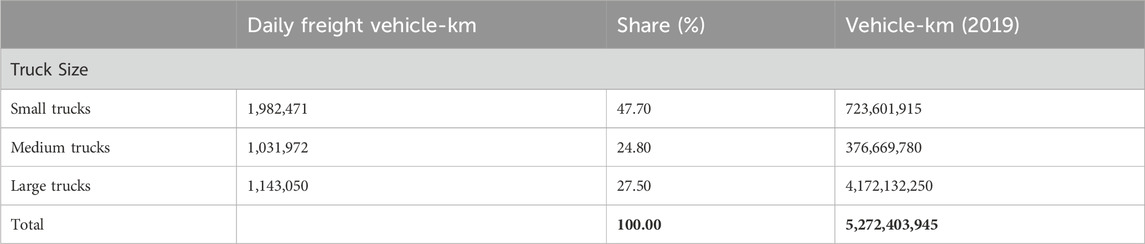
Table 4. Summary of the vehicle-km for freight transport category.
2.3.3 Liquid fuel properties
Three liquid fuels were considered when developing the different scenarios modeled by the LEAP software. These included B10, B20, and petroleum diesel. Information regarding the chemical properties of these biodiesel blends was not available in the LEAP software. These were obtained from literature sources as listed in Table 5.
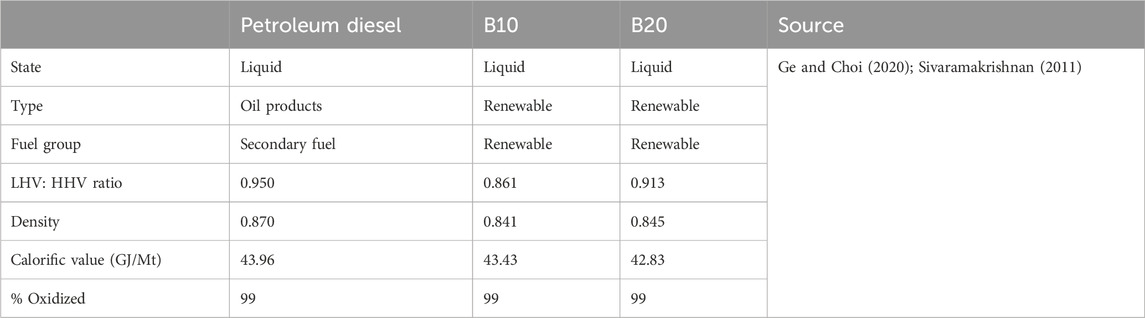
Table 5. Chemical properties of fuels.
2.3.4 Environmental effect/GHG emissions data considerations
GHG emissions for the base year were calculated using emission factors generated from the Technology and Environmental Database (TED), which is an integral tool in the LEAP software used to calculate environmental loadings of different energy scenarios. Emissions of different pollutants are computed as the product of fuel combustion and an emission factor, considering the corresponding characterization factors following the IPCC methodology. A summary of the non-biogenic emission factors for all the emission categories is shown in Table 6.
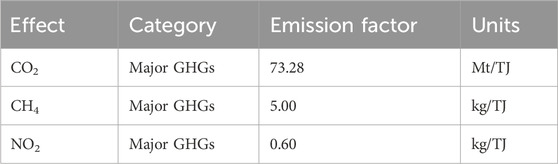
Table 6. Non-biogenic emission factors.
The energy demand estimate captures all non-biogenic emissions. Non-biogenic emissions are emissions from fuels of non-biological origin and include emissions from fossil fuels used in transport and other sectors such as industry and agriculture. The analysis uses a simple accounting methodology in which the energy transformation or conversion estimate captures the non-biogenic emissions from using fossil fuels to generate electricity, using the generation fuel sources of the individual generation plants. Biogenic emissions, which are emissions from biofuels (e.g., burning wood and charcoal), were not calculated in this study.
2.4 Scenario analysis in LEAP—energy demand and GHG emission assessments
Based on the above scenarios that were developed and modelled in LEAP, the following assessments were carried out under this study:
i) Projections of petroleum diesel demand from 2019 to 2050- Baseline Scenario.
ii) Analysis and comparison of Energy demand forecasts (2019–2050) for B10 versus the Baseline, B20, and electric scenarios.
iii) Analysis of energy demand (2019–2050) for Passenger and Freight Transport Categories for B10 versus the Baseline, B20, and electric scenarios.
iv) Analysis and comparison of Greenhouse Gas emissions for B10 versus the Baseline, B20, and electric scenarios.
v) The LEAP software analysis was validated using verified data from reliable sources like the IEA, IPCC. Uganda’s NDCs, and Ministry of Water and Environment ensure accuracy. Comparison with historical data confirmed the model’s reliability, and sensitivity analysis tested its robustness, ensuring resilient projections for various scenarios.
3 Results and discussion
3.1 Projection in petroleum diesel demand from 2019 to 2050- baseline scenario
Fossil diesel consumption in Uganda in 2019 stood at approximately 1.03 billion litres (MEMD, 2022). As illustrated in Figure 4, LEAP modelling projects diesel consumption to grow by 91.59% from 2019 to 2050. This trend is based on the assumption that the status quo remains, with no alternative fuels used in the transport sector during this period. The adverse effects of reliance on petroleum products will still prevail. In the absence of cleaner alternatives under this scenario, deceleration in the depletion of Uganda’s oil reserves, once production commences, will not be favoured by such projected diesel demand.
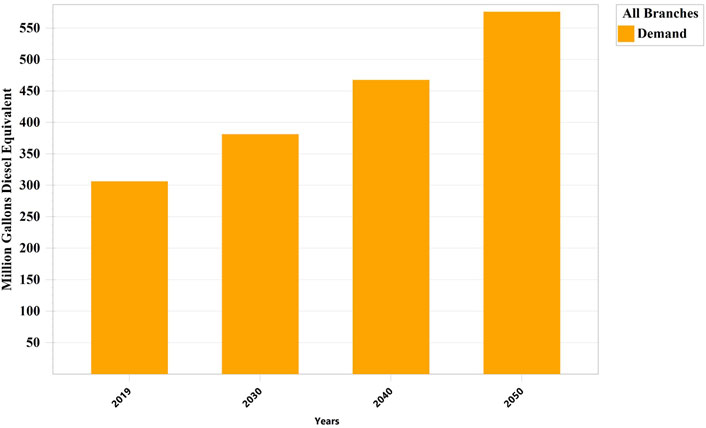
Figure 4. Projection in petroleum diesel demand 2019–2050 (million liters).
3.2 Scenario comparison of energy demand forecasts (2019–2050)
Total Energy demand projections for 2019 to 2050 for each of the four scenarios, as calculated in LEAP, are represented in Figure 5. Results show that the total energy demand for each scenario is similar from 2019 to 2030. This is due to the insignificant quantities of cleaner fuels expected to be used as fossil diesel substitutes during that period. After 2031, energy demand is forecasted to grow differently for each scenario. For example, in the baseline scenario, which has 100% fossil diesel as the fuel type, energy demand will rise by 49.79% from 49.81 million Gj in 2031 to 74.61 million Gj in 2050. Projected total energy demands obtained for the B10, B20, and electric scenarios up to 2050 were 71.98, 68.38, and 64.63 million Gj, respectively. These corresponded to forecasted total energy demand growths of 48.65%, 41.44%, and 30.28%, respectively. The partial replacement of fossil diesel with proportions of biodiesel and electricity for electric vehicles showed reduction in total energy demand compared to the baseline scenario. By 2050, the B20 and electric scenarios showed energy demand reductions of 8.46% and 9.98%, respectively. The lower growth rates of the B10 and B20 scenarios can be attributed to a higher percentage of biodiesel in the diesel mix, which would lead to a decrease in primary energy requirements. The reduced crude oil requirements for the blends relative to the baseline scenario are vital for enhancing the country’s energy security (Wattana et al., 2022). The electric vehicle scenario had the most significant reduction in total energy demand relative to the Baseline Scenario. It was occasioned by the assumed replacement of 50% of diesel-powered passenger vehicles by purely electric vehicles from 2031 to 2050. The relatively lower total energy demand for the electric vehicle scenario compared with the baseline, B10, and B20 scenarios is also attributed to their relatively higher energy efficiency (Yang et al., 2022).
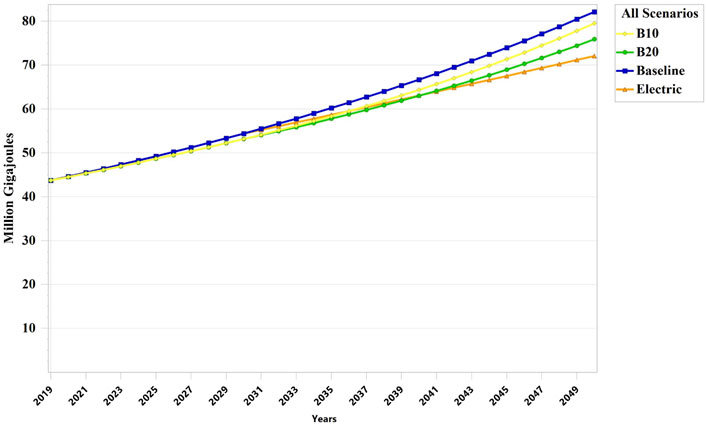
Figure 5. Total projected energy demand for each scenario from 2019 to 2050.
3.3 Scenario analysis of energy demand (2019–2050) for passenger and freight transport categories
The projected energy demand for the transport sector in Uganda was analysed over a 30-year time horizon (2019–2050). Comparisons were made for the passenger and freight categories for each scenario. Due to limited baseline data, passenger category analysis focused only on the road, rail, and water transport modes. For the freight category, the available data on vehicle types (light, medium, and heavy trucks) for road transport and ferries for water transport was applied in LEAP for the scenario analysis presented and discussed below.
3.3.1 Baseline scenario–analysis of energy demand for passenger and freight transportation categories
Figure 6 compares the projected energy demand for the passenger transport category, including the rail, road, and water transport modes for 2019 to 2050. Results show that energy demand will grow by 171%, 180%, and 159% for the rail, road, and water modes, respectively, by 2050. Under this scenario, total energy demand for the passenger transport category is forecasted to grow from 8.42 million Gigajoules in 2019 to 22.74 million Gigajoules in 2050. This growth is attributed to the projected increase in population and GDP per capita (World Bank, 2021), resulting from the anticipated demand for transport mobility. The highest growth (180%) is observed under the road transport mode. This validates the assertion that road Transport will continue to be the dominant mode in Uganda for passenger transportation for years to come as a result of the projected rapid urban population increase, the national economic growth, and rapid traffic increase over the next few decades.
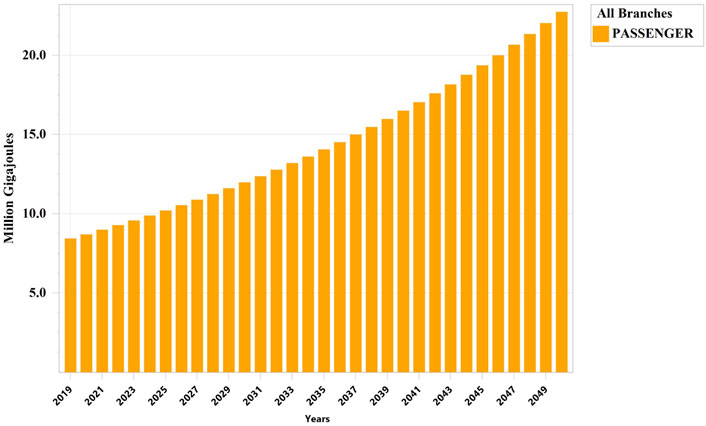
Figure 6. Total projected energy demand by passenger transport type for the baseline scenario (2019–2050).
Figure 7 shows the energy demand from 2019 to 2050 under the freight category, where small, medium, and large trucks are used to carry cargo. The total energy demand under the freight category is forecasted to rise by 68.38% (from 35.29 million GJ to 59.42 million GJ). The rise in freight volumes can be attributed to the projected population growth rate of 3% from 2023 and the corresponding projected economic growth of 4.2% per year (World Bank, 2021), which will lead to an eventual increase in demand for local and regional transportation of shipping goods. This validates the reported predicted growth in freight volumes of 560% in Uganda from 2019 to 2040 (MoWT, 2022).
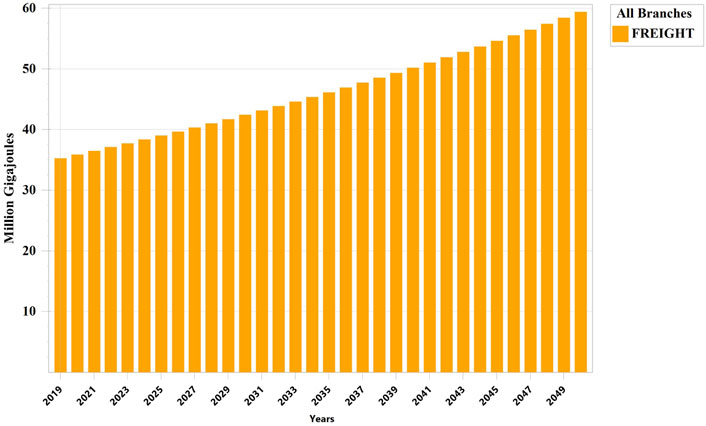
Figure 7. Total projected energy demand by freight transport type for the baseline scenario (2019–2050).
3.3.2 B10 and B20 scenarios–analysis of energy demand for passenger and freight transportation categories
Figure 8 compares the baseline, B10, and B20 scenarios under the passenger transportation category for 2019 to 2050. The projected total energy demand for B10 and B20 is lower than that for the baseline scenario by 13% and 38%, respectively. This is attributed to an increase in the proportion of biodiesel in the diesel blend from 2031 to 2050, which will result in a corresponding reduction in diesel demand (Wattana et al., 2022). For the freight transport category, as shown in Figure 9, the projected total energy demand for B10 and B20 is lower than that for the baseline scenario by 12% and 34%, respectively. These values are higher than those for passenger transport, which can be attributed to the difference in energy consumption between passenger and freight vehicles. Freight vehicles have lower fuel economy than passenger vehicles and thus require larger fuel volumes to cover similar distances (ATC and EPHC, 2008).
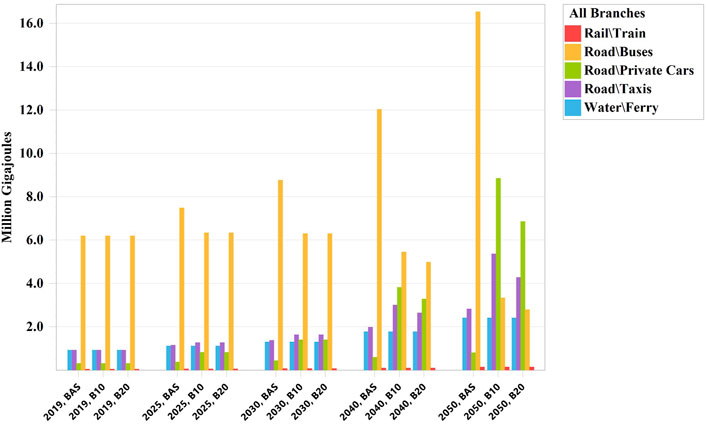
Figure 8. Comparison of Total projected energy demand by passenger transport category for the Baseline, B10, and B20 scenarios (2019–2050).
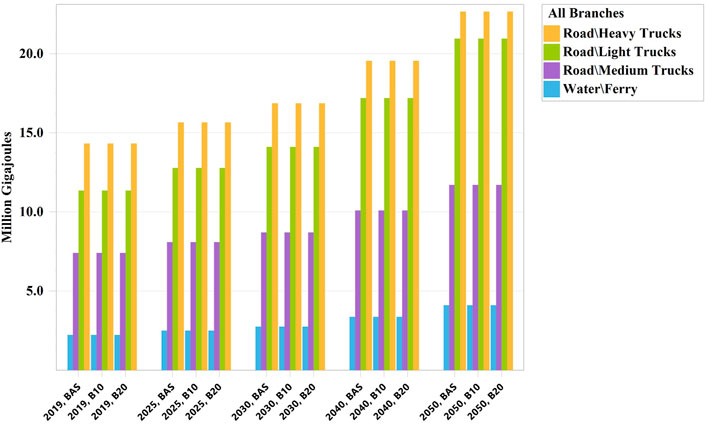
Figure 9. Comparison of Total projected energy demand by freight transport category for the Baseline, B10, and B20 scenarios (2019–2050).
3.3.3 Electric scenario
The electric scenario evaluates the impact of adopting electric vehicles (EVs) in Uganda’s transport sector, focusing primarily on the passenger transportation category. The assumptions and energy demand projections are based on the following:
The electric scenario assumes a significant penetration of electric vehicles in the passenger transport category, with the replacement of 50% of diesel-powered passenger vehicles by purely electric vehicles from 2031 to 2050. The electricity for these EVs is assumed to come from Uganda’s grid, which is projected to increasingly rely on renewable energy sources, such as hydropower, solar, and wind, as part of the country’s efforts to diversify its energy mix and reduce reliance on fossil fuels (MEMD, 2022). In the electric scenario, the freight utility continues to use 100% fossil diesel. This is because the current infrastructure and technology for electric freight vehicles are not yet viable in Uganda for the projected period. Thus, no electricity is used for freight transport in this scenario.
Figure 10 compares the baseline, B10, B20, and electric vehicle scenarios under the passenger transportation category for 2019 to 2050. The projected total energy demand for B10, B20, and electric scenarios is lower than that for the baseline scenario by 13%, 38%, and 80%, respectively. The increase in biodiesel proportion in these blends results in reduced diesel demand from 2031 to 2050.
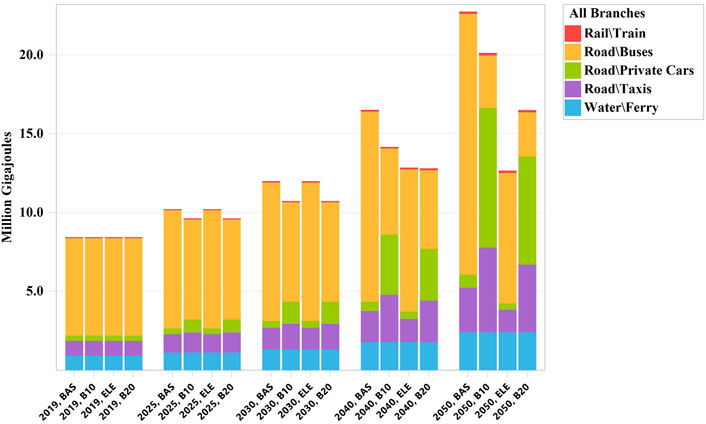
Figure 10. Comparison of Total projected energy demand by passenger transport category for the Baseline, B10, B20, and electric scenarios (2019–2050).
For the freight transport category, as shown in Figure 11, the projected total energy demand for B10, B20, and electric scenarios are lower than that for the baseline scenario by 12%, 34%, and 76%, respectively. This is attributed to the fact that freight transport vehicles have a lower fuel economy than passenger transport vehicles (ATC and EPHC, 2008). However, it should be noted that these reductions in energy demand for the electric scenario apply only to passenger vehicles. The continued use of fossil diesel in freight transport highlights the need for further technological advancements and infrastructure development to support electric freight vehicles in the future.
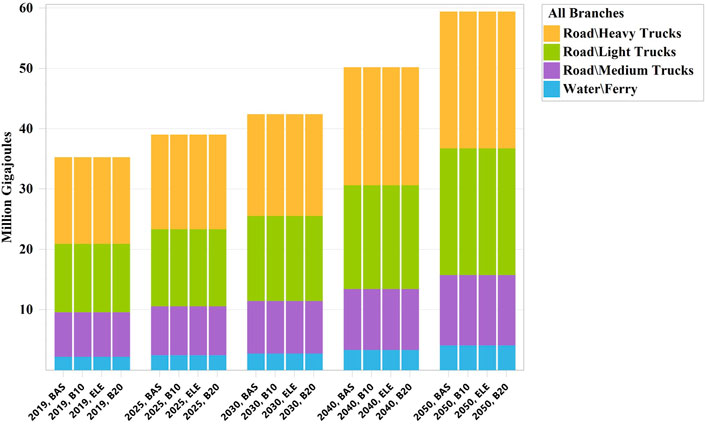
Figure 11. Comparison of Total projected energy demand by freight transport category for the Baseline, B10, B20, and electric scenarios (2019–2050).
The electric scenario’s projected total energy demand for each transportation category is the lowest since electric vehicles can achieve 65% higher energy conversion efficiency than fossil fuel-powered vehicles, which leads to a corresponding reduction in energy demand (DoE and EPA, 2022). Source of Electricity for EVs: The electricity required for charging passenger EVs in this scenario is assumed to be sourced from Uganda’s national grid. As Uganda continues to invest in renewable energy projects, the grid’s reliance on hydropower, solar, and wind energy is expected to increase, reducing the carbon footprint of electricity generation (MEMD, 2022).
3.4 Scenario analysis for greenhouse gas emissions
3.4.1 Projected total GHG for all scenarios
Estimates of greenhouse gas emissions in units of CO2 equivalent are presented in Figure 12 for all scenarios. Compared to the baseline scenario, B10, B20, and Electric, cumulative greenhouse gas emissions will decrease by 8.38%, 25.13%, and 38.35%, respectively, in the years 2030–2050. The reduction in CO2 emissions can be attributed to the decrease in diesel demand due to the decreased proportion of diesel in the transportation fuel mix. Results for B10 and B20 agree with previous findings by (Raheman et al., 2013), who found reductions in GHG emissions by 10.97% and 21.16%, respectively, relative to fossil diesel when used in a high-speed internal combustion engine. GHG emissions were the lowest for the electric vehicle scenario. These findings agree with (Kosai et al., 2022), who obtained a similar trend for GHG emissions for electric vehicles versus biodiesel ICE vehicles. Due to the expected zero CO2 emissions for fully electric cars, a 100% reduction in emissions during the running of the vehicles would have been expected relative to fossil diesel. However, as indicated during scenario development, a 100% shift to the use of electric vehicles in place of diesel vehicles will not be tenable under the electric scenario.
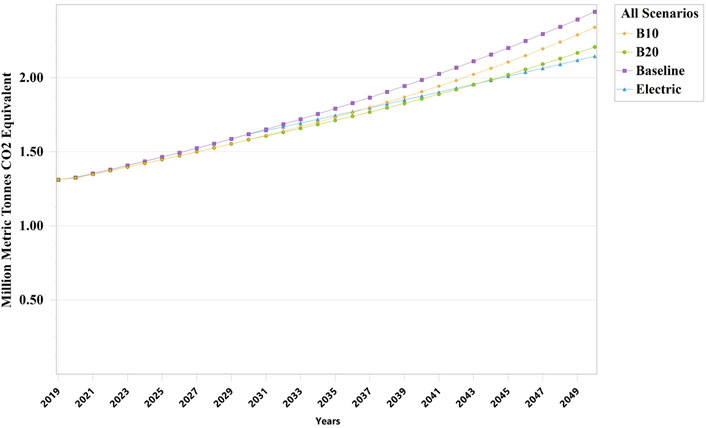
Figure 12. Total Greenhouse gases emissions 100-Year GWP for all scenarios (2019–2050).
3.4.2 Comparison of total projected total GHG–passenger versus freight transportation categories 2019 to 2050
As shown in Figure 13, passenger and freight transport categories are expected to have their CO2 emissions increase substantially from 2019 to 2050 if the status quo that depends on fossil diesel is maintained. The projected GDP per capita and population growth for Uganda (World Bank, 2021) are major contributing factors to the increase in transport mobility and the resulting emissions. Therefore, the use of cleaner fuels is critical in the reduction of transport-related emissions. Very important too is for vehicle designs to be made more energy-efficient.
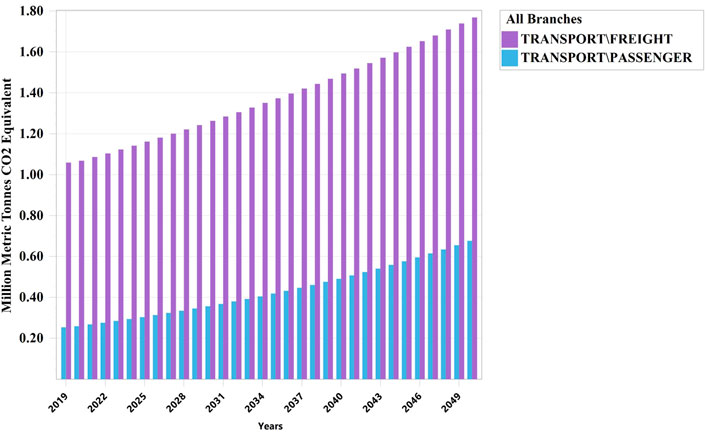
Figure 13. Comparison of total projected GHG—Passenger versus freight transportation categories 2019 to 2050.
3.4.3 Comparison of total projected total GHG–road, rail water modes under the passenger transportation category–2019 to 2050
CO2 emissions from road transport for the baseline scenario, as illustrated by Figure 14, are expected to increase at a much faster rate than for rail and water for 2019–2050. This is collaborated by the fact that over 95% of passengers and goods are transported on the road. Efforts by the Government of Uganda include plans to strengthen multimodal transport, Bus-Rapid Train (BRT) system, and non-motorized transport (MoWT, 2022).
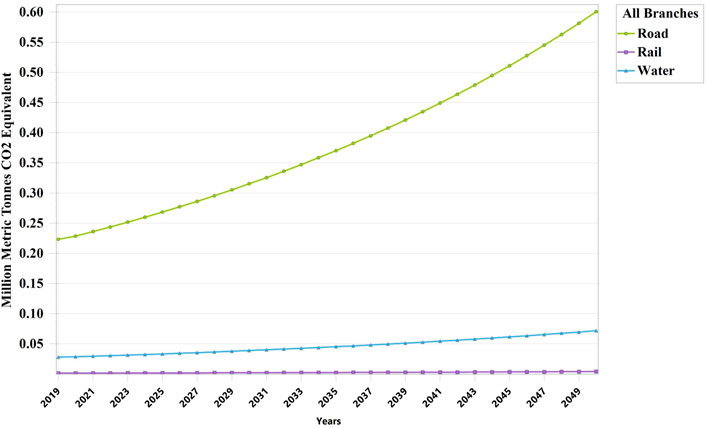
Figure 14. Comparison of total projected GHG—Road, Rail, and Water categories under Passenger transport category 2019 to 2050.
4 Conclusion
This paper assessed the potential long-term impact on energy demand and CO2 emissions from implementing a B10 biodiesel blend in Uganda’s downstream petroleum sub-sector. Four scenarios—baseline (fossil diesel), B10, B20, and electric-powered transport—were developed, modelled, analysed, and compared for the period from 2019 to 2050. As nations strive to implement clean energy policies, laws, and mandates, evaluating these impacts is critical. The comparison of B10 with B20, electric, and fossil diesel use in vehicles provides vital data for the subsequent operationalization of these policies.
Results revealed that in the baseline scenario, energy demand is forecasted to grow by 91.59% (from 1,033.04 to 1979.24 million litres) by 2050, leading to a 91% increase in CO2 emissions from the combustion of fossil diesel in internal combustion engines. The cleaner alternative energy forms assessed show significant potential to mitigate these impacts. B10 use is projected to reduce energy demand and CO2 emissions by 3.52% and 8.38%, respectively. The B20 and electric scenarios demonstrate even better performance relative to the baseline, with reductions in energy demand of 8.46% and 9.98%, respectively, by 2050. Their use in place of diesel-powered internal combustion engines is projected to reduce CO2 emissions by 18.56% and 23.41%, respectively.
Similar trends were observed in the analysis of impacts on passenger and freight transport categories in Uganda. The displacement of fossil diesel by B10, B20, and electric energy is expected to mitigate projected adverse impacts on Uganda’s transport sector. This study highlights the transformative potential of these alternatives in enhancing energy security, reducing greenhouse gas emissions, and fostering sustainable development.
Future analyses should establish the optimal mix of renewable fuels and vehicular technologies to achieve a net-zero scenario by 2050 for Uganda’s transport sector. This research provides a robust framework for policymakers and stakeholders to make informed decisions for a sustainable energy future in Uganda.
Data availability statement
The raw data supporting the conclusions of this article will be made available by the authors, without undue reservation.
Author contributions
TT: Conceptualization, Data curation, Formal Analysis, Funding acquisition, Investigation, Methodology, Project administration, Resources, Software, Supervision, Validation, Visualization, Writing–original draft, Writing–review and editing. PO: Supervision, Writing–review and editing. JK: Supervision, Writing–review and editing.
Funding
The author(s) declare that no financial support was received for the research, authorship, and/or publication of this article.
Acknowledgments
The authors would like to express their sincere gratitude to the Stockholm Environment Institute (SEI) for providing a free academic license for the LEAP (Low Emissions Analysis Platform) software. We also extend our heartfelt thanks to the team of Research Assistants and Chemical Engineers—Achileo Kivumbi, Serwadda Joseph, and Kasule Hannah Talinda—for their valuable contributions during this study.
Conflict of interest
The authors declare that the research was conducted in the absence of any commercial or financial relationships that could be construed as a potential conflict of interest.
Publisher’s note
All claims expressed in this article are solely those of the authors and do not necessarily represent those of their affiliated organizations, or those of the publisher, the editors and the reviewers. Any product that may be evaluated in this article, or claim that may be made by its manufacturer, is not guaranteed or endorsed by the publisher.
References
Achten, W., Almeida, J., Vandenbempt, P., Bolle, E., Fobelets, V., Singh, V. P., et al. (2010). Life cycle assessments of biodiesels: Jatropha versus palm oil. Proceedings of the 7th International Conference on LCA in the Agri-Food Sector. Universita Degli Stui Di Bari, 113–118.
ATC and EPHC (2008). Vehicle Fuel Efficiency: potential measures to encourage the uptake of more efficient fuel-efficient, low-carbon emission vehicles. Available at: http://www.ag.gov.au/cca.
Atlassian/WFP (2013). Logistics capacity assessment- Uganda road network. Available at: https://dlca.logcluster.org/display/public/DLCA/2.3+Uganda+Road+Network.
Azam, M., Othman, J., Begum, R. A., Abdullah, S. M. S., and Nor, N. G. M. (2016). Energy consumption and emission projection for the road transport sector in Malaysia: an application of the LEAP model. Environ. Dev. Sustain. 18 (4), 1027–1047. doi:10.1007/s10668-015-9684-4
Baudry, G., Delrue, F., Legrand, J., Pruvost, J., and Vallée, T. (2017). The challenge of measuring biofuel sustainability: a stakeholder-driven approach applied to the French case. Renew. Sustain. Energy Rev. 69 (January 2016), 933–947. doi:10.1016/j.rser.2016.11.022
DoE and EPA (2022). Fuel economy information. Available at: https://www.fueleconomy.gov/feg/evtech.shtml.
EIA (2021). International energy outlook. Available at: www.eia.gov/ieo.
Ehsani, M., Gao, Y., Gay, S. E., and Emadi, A. (2018). Modern electric, hybrid electric, and fuel cell vehicles: fundamentals, theory, and design. 2nd edn. CRC Press.
FocusEconomics (2022). Economic forecasts from the world's leading economists. Available at: https://www.focus-economics.com/country-indicator/uganda/gdp-per-capita-USD.
Ge, J. C., and Choi, N. J. (2020). Soot particle size distribution, regulated and unregulated emissions of a diesel engine fueled with palm oil biodiesel blends. Energies 13 (21), 5736. doi:10.3390/en13215736
Hill, J., Nelson, E., Tilman, D., Polasky, S., and Tiffany, D. (2006). Environmental, economic, and energetic costs and benefits of biodiesel and ethanol biofuels. Proc. Natl. Acad. Sci. U. S. A. 103 (Issue 30), 11206–11210. doi:10.1073/pnas.0604600103
Hu, X., Chang, S., Li, J., and Qin, Y. (2010). Energy for sustainable road transportation in China: challenges, initiatives and policy implications. Energy 35 (11), 4289–4301. doi:10.1016/j.energy.2009.05.024
IEA (2021). Global Energy Review: CO2 Emissions in 2021 Global emissions rebound sharply to highest ever level. Available at: www.iea.org/t&c/.
IPCC (2022). Climate change 2022 - mitigation of climate change working. Available at: www.ipcc.ch.
Kosai, S., Zakaria, S., Che, H. S., Hasanuzzaman, M., Rahim, N. A., Tan, C., et al. (2022). Estimation of greenhouse gas emissions of petrol, biodiesel and battery electric vehicles in Malaysia based on life cycle approach. Sustain. Switz. 14 (10), 5783. doi:10.3390/su14105783
MoWE (2019). Republic of Uganda: Uganda's FIRST biennal update report to the united nations framework convention on climate change.
MoWT (2017). Works and transport sector development plan. Available at: http://npa.go.ug/wp-content/uploads/2018/01/W_T-Sector-Development-Plan-Final.pdf.
Okello, G., and Reynolds, J. (2022). Pathways to e-mobility in Uganda the university of cambridge Institute for sustainability leadership citing this report acknowledgements.
Popp, J., Lakner, Z., Harangi-rákos, M., and Fári, M. (2014). The effect of bioenergy expansion: food, energy, and environment. Renew. Sustain. Energy Rev. 32, 559–578. doi:10.1016/j.rser.2014.01.056
Raheman, H., Jena, P. C., and Jadav, S. S. (2013). Performance of a diesel engine with blends of biodiesel (from a mixture of oils) and high-speed diesel. Int. J. Energy Environ. Eng. 4 (1), 6. doi:10.1186/2251-6832-4-6
Renewable Energy Agency (2018). Global energy transformation: a roadmap to 2050, executive summary. Available at: www.irena.org.
Rivera-Gonzalez, L., Bolonio, D., Mazadiego, L. F., and Valencia -Chapi, R. (2019). Long-term electricity supply and demand forecast (2018-2040): a LEAP model application towards a sustainable power generation system in ecuador. J. Sustain. 11 (19), 5316. doi:10.3390/su11195316
Roy, A. S., Chingkheihunba, A., and Pakshirajan, K. (2016). “An overview of production, properties, and uses of biodiesel from vegetable oil,” Green Fuels Technology. Editors C. Soccol, S. Brar, C. Faulds, and L. Ramos (Springer, Cham: Green Energy and Technology). doi:10.1007/978-3-319-30205-8_4
Sandesh, K., and Ujwal, P. (2021). Energy Conversion and Management: X Trends and perspectives of liquid biofuel – process and industrial viability. Energy Convers. Manag. X 10, 100075. doi:10.1016/j.ecmx.2020.100075
Stockholm Environment Institute (2022). Low emissions analysis Platform (LEAP). Available at: https://leap.sei.org/default.asp?action=introduction.
Teske, S., and Niklas, S. (2022). Achieving the paris climate agreement goals: science-based target setting for the finance industry – net-zero sectoral 1.5°c pathways for real economy sectors. University of Technology Sydney, Institute for Sustainable Futures.
Tibesigwa, T., Olupot, P. W., and Kirabira, J. B. (2021). The critical techno-economic aspects for production of B10 biodiesel from second generation feedstocks: a review. Int. J. Sustain. Energy 41, 751–771. doi:10.1080/14786451.2021.1976181
UBOS (2022). Demographic statistics. Available at: https://www.ubos.org/uganda-profile/.
Wattana, S., Wattana, B., and Purathanung, T. (2022). Impacts of palm oil-based biofuel utilization promotion policy in the Thai transport sector. Environ. Res. Eng. Manag. 78 (2), 7–18. doi:10.5755/j01.erem.78.2.30745
World Bank (2021). Population, total - Uganda _ data. Available at: https://data.worldbank.org/indicator/SP.POP.TOTL?locations=UG.
Yang, Y., Wang, H., Löschel, A., and Zhou, P. (2022). Energy transition toward carbon-neutrality in China: pathways, implications and uncertainties. Front. Eng. Manag. 9, 358–372. doi:10.1007/s42524-022-0202-8
Yu, Z., Zia-ul-haq, H. M., Irshad, A. ur R., Tanveer, M., Jameel, K., and Janjua, L. R. (2022). Nexuses between crude oil imports, renewable energy, transport services, and technological innovation: a fresh insight from Germany. J. Petroleum Explor. Prod. Technol. 12 (11), 2887–2897. doi:10.1007/s13202-022-01487-0
Keywords: biodiesel, clean transport fuels, energy demand, emissions, LEAP
Citation: Tibesigwa T, Olupot PW and Kirabira JB (2024) Scenario analysis of the long-term impact on energy demand and emissions of B10 use as a clean transport fuel. Front. Energy Res. 12:1403014. doi: 10.3389/fenrg.2024.1403014
Received: 18 March 2024; Accepted: 30 July 2024;
Published: 19 August 2024.
Edited by:
Sachin Kumar, Sardar Swaran Singh National Institute of Bio-Energy, IndiaReviewed by:
Ming Hsun Cheng, University of Idaho, United StatesBheru Lal Salvi, Maharana Pratap University of Agriculture and Technology, India
Copyright © 2024 Tibesigwa, Olupot and Kirabira. This is an open-access article distributed under the terms of the Creative Commons Attribution License (CC BY). The use, distribution or reproduction in other forums is permitted, provided the original author(s) and the copyright owner(s) are credited and that the original publication in this journal is cited, in accordance with accepted academic practice. No use, distribution or reproduction is permitted which does not comply with these terms.
*Correspondence: Timothy Tibesigwa, dGltb3RoeS50aWJlc2lnd2FAc3R1ZGVudHMubWFrLmFjLnVn