 Amal H. Alharbi1
 Doaa Sami Khafaga1
 El-Sayed M. El-kenawy2*
 Marwa M. Eid2,3
 Abdelhameed Ibrahim4
 Laith Abualigah5,6,7,8
 Nima Khodadadi9
 Abdelaziz A. Abdelhamid10,11*
- 1Department of Computer Sciences, College of Computer and Information Sciences, Princess Nourah bint Abdulrahman University, Riyadh, Saudi Arabia
- 2Department of Communications and Electronics, Delta Higher Institute of Engineering and Technology, Mansoura, Egypt
- 3Faculty of Artificial Intelligence, Delta University for Science and Technology, Mansoura, Egypt
- 4School of ICT, Faculty of Engineering, Design and Information & Communications Technology (EDICT), Bahrain Polytechnic, Isa Town, Bahrain
- 5Computer Science Department, Al al-Bayt University, Mafraq, Jordan
- 6MEU Research Unit, Middle East University, Amman, Jordan
- 7Applied Science Research Center, Applied Science Private University, Amman, Jordan
- 8Jadara Research Center, Jadara University, Irbid, Jordan
- 9Department of Civil and Architectural Engineering, University of Miami, Coral Gables, FL, United States
- 10Department of Computer Science, College of Computing and Information Technology, Shaqra University, Shaqra, Saudi Arabia
- 11Department of Computer Science, Faculty of Computer and Information Sciences, Ain Shams University, Cairo, Egypt
As the number of individuals who drive electric vehicles increases, it is becoming increasingly important to ensure that charging infrastructure is both dependable and conveniently accessible. Methodology: In this paper, a recommendation system is proposed with the purpose of assisting users of electric vehicles in locating charging stations that are closer to them, improving the charging experience, and lowering range anxiety. The proposed method is based on restricted Boltzmann machine learning to collect and evaluate real-time data on a variety of aspects, including the availability of charging stations and historical patterns of consumption. To optimize the parameters of the restricted Boltzmann machine, a new optimization algorithm is proposed and referred to as parallel greylag goose (PGGO) algorithm. The recommendation algorithm takes into consideration a variety of user preferences. These preferences include charging speed, cost, network compatibility, amenities, and proximity to the user’s present location. By addressing these preferences, the proposed approach reduces the amount of irritation experienced by users, improves charging performance, and increases customer satisfaction. Results: The findings demonstrate that the method is effective in recommending charging stations that are close to drivers of electric vehicles. On the other hand, the Wilcoxon rank-sum and Analysis of Variance tests are utilized in this work to investigate the statistical significance of the proposed parallel greylag goose optimization method and restricted Boltzmann machine model. The proposed methodology could achieve a recommendation accuracy of 99% when tested on the adopted dataset. Conclusion: Based on the achieved results, the proposed method is effective in recommending systems for the best charging stations for electric vehicles.
1 Introduction
The global automotive industry is experiencing a journey of change, as noted by the increasing rate of electric vehicle transition (EVs) (Yao et al., 2020). This movement is due to the increasing awareness of environmental problems, a demand for sustainable solutions for transport, and the invention of better battery technologies (Sdoukopoulos et al., 2019). However, the widespread use of electric vehicles marks a step in the right direction towards a greener future. However, challenges lying ahead must be addressed, and innovative approaches must be used. Another important task is to look for the best ways to charge electric vehicles (Hasan et al., 2021; Babanezhad et al., 2022). In addition, electric vehicles appear more common, and essential and reliable charging networks are required (Kumar and Alok, 2020). In contrast to conventional vehicles that are refueled by a well-defined system of stations, the charging infrastructure is in a transitional state for electric vehicles (El-kenawy et al., 2022a; Golla et al., 2023). Ensuring that electric vehicles can be charged conveniently, affordably and in an energy-efficient manner by the public is critical to establishing widespread adoption (Aurangzeb et al., 2023; Rizk et al., 2023). The optimization of charging paths is offered as a strategic approach to this challenge that would streamline the charging experience and make it more convenient for all owners of electric vehicles (M El-kenawy et al., 2022; Djaafari et al., 2022).
By the year 2035, electric cars (EVs) would account for at least 54% of the total number of automobiles sold worldwide (Liberatore, 2022). Despite the fact that battery-powered vehicles accounted for less than 8% of global sales in the previous year and just 10% in the first quarter of 2022, these optimistic estimates are still to be expected. As a result of this, numerous nations around the world have made commitments to transition away from automobiles that burn a significant amount of fossil fuel and toward electric vehicles by the year 2030. This is due to the fact that numerous nations have either enacted new laws in this area or established ambitious plans for the purpose of achieving this goal. In addition to this, it makes a significant contribution to the pace of pollution and carbon emissions reduction in these countries. However, despite all of these benefits, two key challenges could prevent the general people from adopting electric vehicles: the limited number of charging stations or facilities for electric vehicles and the high cost of electric vehicles. The cost of charging electric vehicles at home will be quite expensive due to the existing worldwide demand for energy and the high pricing of electric vehicles. As a result, they typically charge their automobiles at charging stations that are owned and operated by the government. However, this option is not ideal when it comes to the infrastructure of electric power distribution networks because it has resulted in a number of challenges. For the past 10 years, scientific research has been focusing on finding ways to mitigate the adverse impacts of the proliferation of electric vehicles (EVs) in distribution networks. This has been accomplished by selecting the most suitable location for charging stations and developing technology that can change rapidly, with a time frame of no more than 30 minutes (Zeb et al., 2020; Mohamed et al., 2021). A few nations have utilized dispersed renewable energy resources (DER) in recent times to assist the utility in the process of electrifying charging stations.
A number of studies have investigated various ways to do this from the perspective of an electric vehicle owner or distribution network controller. The distribution network aims to accomplish a number of core goals, including lowering the bus voltage, minimizing power loss, and boosting the availability of the distribution system. The owners of charging stations and the problems that affect them were supported by a few additional scientists, with money being the most significant of these problems or the maximum profit being the most vital of these matters. Within the context of government initiatives aimed at lowering emissions of greenhouse gases, the rapid deployment of charging stations for electric vehicles all over the world is becoming an increasingly critical factor in order to satisfy the growing demand. On the other hand, the rapid adoption of electric vehicles is not hindered by the absence of public charging infrastructure. To reach a total of 16.5 million units, sales of electric vehicles increased by 6.6 million units in 2021. This growth is expected to accelerate as more charging spots are established. As a potential link between electric cars and the utility (also known as V2G) or net benefit, the charging stations can operate as a link.
Electric vehicles are able to contribute energy to the grid through existing stations when there is a significant demand for it due to the Vehicle-to-Grid (V2G) technology. One potential goal function that might contribute to the design of V2G is the attainment of the greatest possible net benefit. Without the need for constant recharging for such a lengthy time, the vast majority of vehicles remain parked for an average of approximately 6 hours per day in the same designated area. While parking electric vehicles for extended periods, it is a good idea to use the batteries of the vehicles to store the energy that is created when the demand is higher than the amount of power that is produced and then to re-enter it into the network when the demand is higher than the quantity that is produced. V2G is a key component in the fight against climate change since it makes it possible for our power grid to accommodate an ever-increasing quantity of renewable energy. For the energy and transportation sectors to be able to confront the climate disaster successfully, three things need to take place: decarbonization, energy efficiency, and electrification.
Optimization strategies are necessary for training and improving machine learning models. Computers are able to learn from data and make predictions or judgments without being programmed due to the algorithms that are used in machine learning. The parameters are fine-tuned, and the performance of the machine learning model is optimized using optimization approaches. The learning task is optimized by these methods, which locate the optimal model parameters in order to increase performance while minimizing error (El-Kenawy et al., 2022c; El-kenawy et al., 2022b). There are several different types of machine learning algorithms, including Bayesian optimization, evolutionary algorithms, stochastic gradient descent, and gradient descent. These algorithms make adjustments to the parameters of the model iteratively, taking into account the training data, which results in improved accuracy and prediction. Image recognition (Abdelhamid et al., 2022; Khafaga et al., 2022a), keystroke dynamics (El-Kenawy et al., 2022d), medical applications (Abdel Samee et al., 2022; Sami Khafaga et al., 2022), and recommender systems are all areas in which researchers and practitioners can create powerful and adaptive models that can learn from complex datasets, extract meaningful patterns, and make accurate predictions. These models can be created by combining machine learning with optimization algorithms (Khafaga et al., 2022b; Afzal et al., 2023; Dharavat et al., 2023). By utilizing homomorphic encryption, secure protocols, and federated learning strategies, the research presented in (Mohammed et al., 2023) presented a revolutionary pedestrian detection system that was given the name HMFLS. A base station (BS) and a homogenous federated learning server with weights, surveillance, and traffic light components are the components that make up the Hybrid Mobile Federated Learning System (HMFLS).
As a result of the research presented in (Wang et al., 2022), a fuzzy-based energy-efficient decision support system (FBEES) was developed. This system cuts down on energy use, delays, and expenses while simultaneously enhancing scheduling accuracy for environmentally friendly applications. Vehicles that are connected to the internet transmit data to fog servers located in a variety of data centers for processing. Using a mobility-aware multi-scenario offloading phase (MAMSOP) to manage mobility and offloading expenses, the authors of (Lakhan et al., 2022) described a VFCN that utilized a cost-efficient and secure approach. A fully homomorphism encryption-based security strategy that encrypts and decrypts data locally and computes encrypted data rather than decrypting it was proposed as the solution to the problem. The objective was to ensure that application execution occurred with minimal delays and expenditures. The work presented in (Mohammad et al., 2020) is the year that saw the introduction of machine learning techniques that have the potential to assist the aviation industry in estimating the future flow of air passengers, so enhancing the value of stakeholders and the outcomes for consumers. Machine learning algorithms, neural networks, and learning methodologies were discussed, along with the difficulties that have been, are currently, and will be in the aviation industry in the future.
The fact that charging stations have a few negatives is something that everyone cannot deny. One of these problems is the fact that these stations are not uniform because there is no standard for them. There is no way to deny the existence of this problem. In addition to the extremely high costs of construction, they also include the expenditures of operation and maintenance. This results in a loss or, at best, a small profit, despite the fact that considerable investments were made in the costs of development. As a result of this, a lot of companies have recently started investigating the prospect of utilizing renewable and environmentally friendly sources of energy, such as solar cells, in order to either reduce expenses or increase revenues in addition to the several additional programs that V2G has to offer. In order to describe the broad framework for the challenge of finding the optimal site for the electric vehicle charging station in Figure 1, we might make use of the information that was offered in the preceding narrative.
• In order to achieve the goal of creating a recommendation system for individuals who drive electric vehicles, it is necessary to make available for use approaches that are based on machine learning.
• The optimization-based Parallel Greylag Goose Optimization Algorithm and Restricted Boltzmann Machines (PGGO-RBM) algorithm have been suggested for use.
• In order to achieve the objective of enhancing the precision of the forecasts generated by the dataset that has been reviewed, an optimized PGGO-RBM-based regression model is currently being created.
• It is vital to conduct a comparison of the outcomes produced by the various algorithms in order to ascertain which algorithm produces the consequences that are the most advantageous of the bunch.
• By utilizing Wilcoxon rank-sum and Analysis of Variance (ANOVA) tests, it is possible to investigate the potential statistical significance between the improved PGGO-RBM-based model. This is made possible by the utilization of these tests.
• PGGO-RBM-based regression models are able to be tested and updated to fit a wide range of datasets due to the malleability of the model itself. Because the model is so flexible, this is something that can be accomplished.

Figure 1. Illustration of potential paths to charging stations for three cars and based on five electric stations. The distances show the path lengths.
This paper is structured in the following: Section II explains the various technologies that are utilized by charging stations for electric vehicles. Within Section III of this study, the materials and methods that were utilized are dissected in detail. Detailed information regarding the analysis of the data is provided in Section IV, which also includes the numerical applications. A conclusion is presented in Section V of the paper.
2 Literature review
Efficiency optimization in transportation and logistics is the crucial element wherein vehicle paths and routes are accordingly optimized so that organizations can achieve lower costs and improvements and minimize environmental impacts. In the wake of the growing global demand for effective and streamlined networks, researchers and practitioners are moving towards new technologies and means that would be of great help in the allocation of vehicular paths. The present review paper dives into the multifaceted and versatile field of research into maximizing vehicle paths, considering the different methodologies, algorithms, and practical implications in actual instances that play a role in the development of this discipline. The review of current optimization strategies for vehicle paths will be synthesized. It will strive to provide a comprehensive picture of the available approach and point out the areas for future exploration.
In view of the increasing environmental problems and energy deficiency, electric vehicles (EVs) have gained high acceptance as the next viable option. However, the need for more infrastructure for charging is the main challenge. In (Sun et al., 2020) that tackles this barrier, IoT technology will be used to make the already existing EV charging system more efficient. The proposed real-time server-based forecasting application utilizes IoT sensors and broadcasting tools in a way that offers a dynamic view of the physical world, making it possible to have such features as scheduling management to decrease waiting time or real-time CS recommendations (CS stands for charging station) on the basis of economic cost and shorter charging time. This system is built on the PHP programming language of the Linux UBUNTU 16.04 LTS operating system and is managed through CSQL on the Google Cloud platform. Phase ensures user privacy, third-party intervention and information exchange. The effectiveness of the application is validated by achieving low-cost tests with LTC4150, ESP8266 Wi-Fi module, and Arduino. With the latest developments in battery technology and the shortening of charging times for Electric Vehicles (EVs), public charging stations have become more likely.
In (Savari et al., 2020), we deploy recently developed technology for tracking locations utilizing mobile phones or wearables; the study proposes an optimization approach using data to determine the best charging station locations. The problem is stated as a network design problem in which demand for goods in a specific geographical area is to be covered by carrying as few drivers as possible with the least amount of energy overhead and the lowest number of charging stations. Because of the calculative problems, the genetic algorithm can be presented as a proper remedy. This methodology is applied to Boston’s EV charging station to utilize 1 million users’ CDR, which provides a statistically significant decrease in excess driving distance, energy waste, and required charging stations as compared to the current or local solutions. Furthermore, the research explores the flexibility of the proposed solution by analyzing periodic human activity patterns, showing performance improvement in the longer term. This investigation thereby highlights the capability of data-driven approaches with a view to achieving optimal distribution of public charging in the urban environment.
In the desire to lower the emissions coming from traditional vehicles, it becomes necessary to put the Electric Vehicle Charging Stations (EVCS) in a strategic place where the charging demand is met without harming the power system network. THe work presented in (Vazifeh et al., 2019) is on the design of EVCS installation in a radial distribution network interlaced with a road network. The distribution or weight of points of charging demand is being taken into account in various urban areas such as supermarkets, road junctions and residences. The objectives comprise the reduction of the amount of energy lost during transmission, stabilization of the system voltages in the network, and minimization of land cost with maximum priority given to a number of EVs served at the least amount of establishment cost. The area is divided into three zones so that EVCS can be set up in a distributed manner. Uncertainties linked with EVs are dealt with the aid of the deployment of the 2 m Point Estimation method (2 m PEM). The optimization problem is considered using DE (Differential Evolution) and HHO (Harris Hawks Optimization) techniques.
Many aspects will influence the development of electric vehicles (EVs). These include acquisition costs, autonomy, charging processes, and charging infrastructure. The latter topic is focused on in (Pal et al., 2021), and precisely, the design of a fast-charging station for EVs. The station aims to increase profitability and build resilience by using a renewable generation (wind and photovoltaic) and battery system. A key point of this paper is the use of a charging process model that embodies characteristics like arrival time and the electric vehicle’s state of charge. The Monte Carlo method is used in the first step to simulate the EV demand and the renewable generation, which are then optimized by the use of the genetic algorithm (GA) in the second step regarding the installation and operation of the EV fast-charging station. GA searches for the non-dominated solution(s) that optimize profitability (NPV). A lot of future scenarios are analyzed to evaluate the effect of renewable energy integration and storage systems. The results emphasize that renewable electricity secured by storage provides the most economically advantageous solution.
EVs, which have already seen widespread adoption due to their ability to deal with local pollution and noise emissions efficiently, have a bright future in the realm of sustainable transportation. Nevertheless, the shortfall in the adoption of EVs all over the world is attributable to the need for more suitable charging infrastructure, which is defined by the absence of stations and inappropriate locations in various regions. Hence, the placement of strategic charging stations becomes of utmost importance. The work presented in (Domínguez-Navarro et al., 2019) is about the creation of a charging station finding method consisting of two stages. The weighted multicriteria method is responsible for assessing segments of territory and distributing charging stations within a segment; this is done with a hexagon-based approach. The distinguishing factor of this method is the all-encompassing assessment of electric vehicle potential on a broader scale and the detection of charging station locations and land use problems on a regional scale. The methodology is utilized in the case of Hungary for a macro-level evaluation and a district situated in the capital city of Budapest for a micro-level assessment. The results show a pattern showing that there is a high preference for public charging at P + R facilities, near concentrations of services and high-density areas, and over gas stations for urban public charging demand.
Accordingly, in an EV world, the future of the infrastructure for charging electric vehicles is more critical because of the shift in the trend of electric mobility. Author in (Csiszár et al., 2019) presents a new agent-based simulation framework that is technology-coupled with spatial reference data of the built structure of the city. The framework is modeled on EV user charging behaviors and the distribution areas of electric vehicles. That is why around 2,500 electrical mobility transition scenarios from a small Swiss town were evaluated. The findings of the study indicate that the time to receive the return on EV charging infrastructure can be as much as 50% shorter if customers are charged according to the parking prices rather than selling electricity. On the contrary, the first one details the fact that income from parking rates is more reactive to the users’ behaviors and choices. The viability of charging infrastructure could be better under the existing low level of EV adoption, being a crucial concern for new market entrants. However, after the EV penetration reaches 10%, the situation will improve. In addition, the research shows that load shedding at selected transformers is between 78% and 128% higher than during the peak hour if public charging is enabled. This is, however, critical to the required upgrades of the grid in the city as a whole, compared to increases on average in a city as a whole. Thus, the novel simulation framework can be used as a significant planning aid for the organization of the EV charging infrastructure alongside a successful transition to the new electric mobility regime.
The appropriate selection of locations for EV Charging Stations (EVCS) is crucial for the considerable expansion of electric vehicles. The goal of (Pagani et al., 2019) is to achieve the optimal EV site selection problem using the sustainability criteria while understanding the uncertainty of the information used in the process. As a degree basis, fuzzy sets picture (PFS), which comprises positive, neutral and negative membership degrees, is suggested as a comprehensive framework for evaluating and choosing the best EVCS site. This work starts with the identification of the main criteria and the associated sub-criteria, founded on the existing literature and expert views. The operational laws for Picture Fuzzy Number (PFN) are defined, and a group introductory of Picture Fuzzy Weighted Interaction Geometric (PFWIG) operator is brought forth. The Fuzzy Analytic Hierarchy Process (FAHP), which is next used to determine criteria weights and local weights for sub-criteria, gives the Picture of a Fuzzy Decision Matrix: the weighted average matrix by the PFWIG operator. Later, the Grey Relational Projection (GRP) method is further improved by the relative grey relational projection to assess the suitability of different sites for placement of EVCS, thus enabling ranking and selection based on how good they are for deployment. An empirical case study of EVCS site selection in Beijing is given, which shows that the proposed framework is useful and practical when identifying suitable EVCS from all possible charging stations.
Installation of electric vehicle (EV) public charging stations may indeed mitigate range anxiety among EV drivers due to the smooth EV driving experience comparable to that of internal combustion engine vehicles. Author in (Ju et al., 2019) provides a framework for location planning on how to place EV public charging stations strategically for the purpose of maintaining or preserving the existing activities by the EV drivers. The model is based on a deterministic process that simulates EV driver charging patterns, taking into account factors like activity theorem, remaining trip energy, charging point availability, and range anxiety. Finally, the service location model is formulated, with the primary objective of maximizing either the number of visitors or the number of stations in the location by minimizing the first and second charges, respectively. The model is applied to the case study of Beijing, China, which sheds light on the drivers’ trip characteristics and the influential factors. Our findings show that a large number of drivers may need more energy storage to meet the needs of their EV batteries during weekdays. Some of the best solutions are that the charging network should be reasonably and properly distributed to satisfy the travel demands of 90% of EV drivers without destabilizing lives. The planning of fast-charging stations is mainly focused on tech hubs and financial centers. Statistics reported for drivers’ miss-trip behaviors are disparate profiles with long-distance travel and lack of home chargers. This study provides crucial information, which, in turn, helps plan strategically in the roll-out of public charging infrastructures that will support the proliferation of the EV.
While transport electrification can act as a solution to carbon emissions, the growing EV fleet raises concerns due to the unknown impact on the electrical networks. The EV loads must be forecasted with precision, as the downside of the grid can be avoided by doing the same. Describes a unique methodology for stochastic EV load forecasting on the spatial level with different geographies (Pan et al., 2020). The hierarchical method combines the least problems into sub-problems at low-level regions. This is done using standard probabilistic models such as gradient-boosted regression trees, quantile regression forests and quantile regression neural networks. Considering the fact that principal component analysis can be used to reduce the sub-problem dimensionality, it is included in the method. Then, the hierarchical perspective method is used to predict the aggregate load at a high geographic level through an ensemble method based on penalized linear quantile regression. These systematic reviews encompass the development of the hierarchical probabilistic forecasting framework, the difference in comparison with the non-hierarchical analogs, and the effect of the data dimensionality reduction. Numerous experiments done on the basis of real EV load data confirm the fact that the hierarchical approaches enhance the performance of these probabilistic forecasts up to 9.5% more than the non-hierarchical methods. The researchers here present their findings on improving the accuracy of EV load forecasting across diverse regions.
As shown in (Buzna et al., 2021), The transformation of the global transportation sector by major emissions cuts into the future relies on the large-scale conversion of conventional vehicles into electricity. This change is especially critical in urban areas where the EV range matches the driving, and non-motorized vehicles could result in lower local emissions. In British Columbia (BC), Canada, where the accessibility of cleaner renewable electricity enhances the flexibility of EV deployment, the conspicuous challenge particularly is that most of the residents are in MURBs evaluating inadequate EV charging infrastructure. Leveraging from the findings of the related study by Lopez-Behar et al. (in advance), which examines the challenges and decision-making processes associated with extending the EV charging system to the MURBs in BC, we develop a Causal Loop Diagram (CLD) to explore and analyze these feedback loops. These findings can be built upon supply-side intervention policies that are divided into financial/fiscal, regulatory, and information/awareness-based measures. Financial policies that target EV owners and building owners with incentives and help with building retrofitting costs are measures of the purpose. Policies on regulation are the definition of the rights of stakeholders and the compulsion of installation of charging stations in new MURBs. Information/awareness policies encompass developing further existing guidelines and the promotion of the charging infrastructure design through the process of infrastructure planning. These policy recommendations are designed to instruct and support governmental interventions at both the municipal and provincial levels in BC, providing insights that may prove to be used in urban EV markets worldwide.
The optimization of vehicle paths is indeed a dynamic and complex research area in which its impacts on transportation systems all over the world are pervasive and pronounced. The current literature review puts the readers in the right perspective: researchers have invested considerable efforts in crafting smart algorithms, using cutting-edge technologies, and taking a number of factors into account to find the perfect paths for vehicles to follow. Despite these advances, some challenges remain, encompassing, among others, real-time data integration as well as environmental sustainability. Looking into the future, we expect there to be greater collaboration between academia and industry, as well as improvements in data analytic techniques and artificial intelligence systems, which will consequently pave the way for new inventions in the optimization of vehicle routes. This review would stretch out the frontiers and inspire future researchers to examine the subject from a fresh angle or even to look at new areas in this significant field. A summary of the literature review on electric vehicle charging station optimization is presented in Table 1.
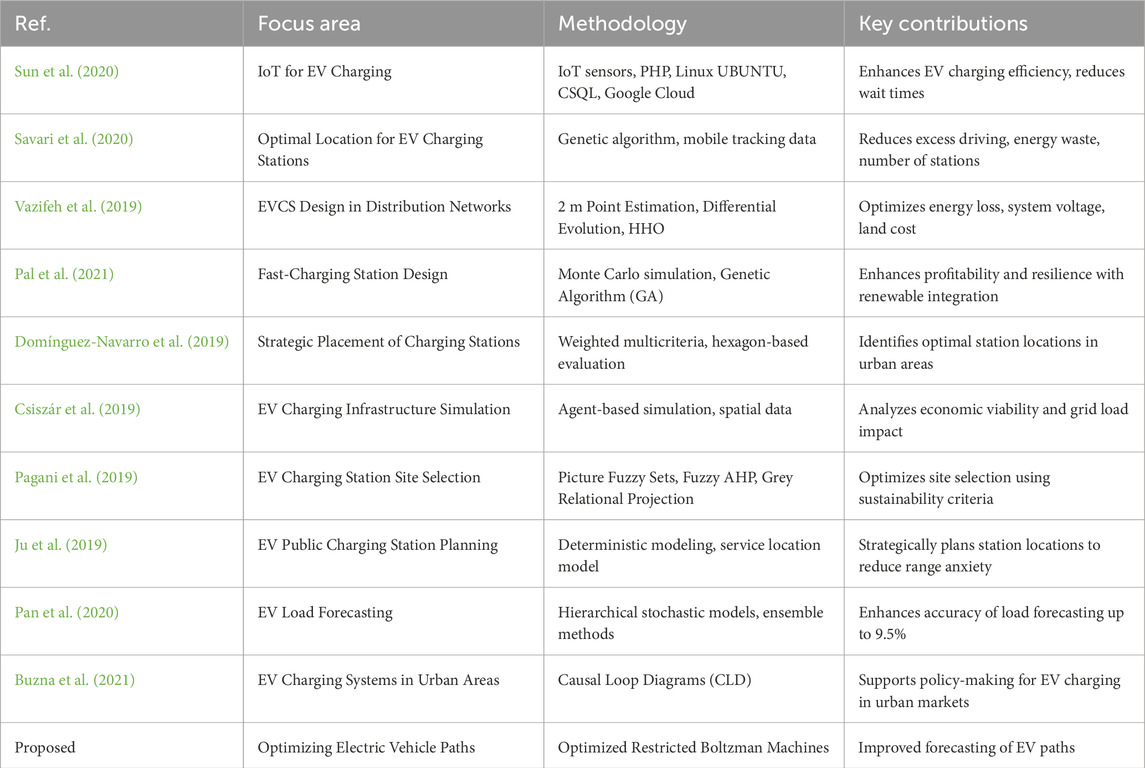
Table 1. Summary of literature review on EV charging stations optimization.
3 The proposed methodology
The essence of the proposed methodology can be categorized into the following areas:
* Dataset Preprocessing: The technical process first consists of a comprehensive investigation of the Electric Vehicle Charging Dataset. The dataset, consisting of the source, structure, and variables, is described in detail. As precisely stated, preprocessing steps include data cleaning, normalization, and feature engineering to make the dataset fit for subsequent manipulations.
* Recommendation Systems Studied: The research evaluates three prominent recommendation systems: Markov Chain, Neural Autoregressive Distribution Estimation (NADE) and Restricted Boltzmann Machine (RBM). Each system is introduced with a statement of its convincing theory, a demonstration of its application, and a description of its role in EV charging path optimization.
* Performance Metrics: Multiple performance metrics are commonly used to assess the performance of recommendation systems. These measures, however, are useful indicators for evaluating the efficiency of these systems in correctly assigning the correct paths for charging vehicles with electricity. The marking criteria for the system include accuracy, sensitivity, specificity, precision, recall, F-score, optimum solution, standard deviation of the optimal solution, and average response time of various system performance levels.
* Comparative Analysis - Accuracy: The system of each recommendation system is compared based on the accuracy that is measured from the experimental results. In terms of the NADE, Markov Chain, or RBM, diverse accuracy percentages are achieved, which gives a glimpse into their relative efficiency in designing optimal charging paths for electric vehicles.
* Statistical Analysis - ANOVA: A specific analysis of variance (ANOVA) is made to detect the variances between the recommendation systems. The statistical parameters, including the sum of squares (SS), degrees of freedom (DF), mean squares (MS), F-statistic, and p-value, are among those reported. The ANOVA outcomes mapped out the significance of the discrepancy in the level of accuracy across recommendation systems.
* Pairwise Comparison - Wilcoxon Signed Rank Test: Also, on the basis of a pairwise comparison made using the Wilcoxon Signed Rank Test, the features differentiating the recommendation systems are scrutinized. This exact non-parametric test checks for statistically significant differences in the accuracy of Markov Chain, NADE, and RBM. Consequently, the results offer valuable points of view about these recommendation systems.
* Feature Selection Techniques: The research investigates how feature selection can influence the performance of recommendation systems. Parameter Optimization algorithms, which include parallel Binary Greylag Goose Optimization (bPGGO), Binary Greylag Goose Optimization (bGGO), Binary Particle Swarm Optimization (bPSO), Binary Grey Wolf Optimizer (bGWO), and Binary Genetic Algorithm (bGA), are studied depending on several metrics such as average error, number of clones, fitness, best.
* ANOVA for Feature Selection: The Analysis of the Recommendation system is very similar to the feature selection technique. Statistically significant, the difference of means indicates the performance comparisons between bPGGO, bGGO, bPSO, bGWO and bGA. Such Analysis produces the most efficient Bayesian models and feature selection techniques for the optimization of electric vehicle charging paths.
* Post-Feature Selection System Performance: The effect of feature selection on the performance of recommendation systems is examined after the post-feature-selection analyses. Markov Chain, NADE and RBM systems are also revisited in terms of the selected features to comprehend the manner in which feature selection either boosts or alters their applicability in improving electric vehicle charging routes.
* Hybrid Models (Combined with RBM): To capitalize on the individual aspects of recommendation systems and feature selection methodologies, this paper proposes a novel hybrid model. The effectiveness of RBM for the electric vehicle charging paths is analyzed by comparing the quality of all the RBM structures, which are studied as PGGO-RBM, GGO-RBM, PSO-RBM, GWO-RBM, and GA-RBM.
* Statistical Analysis - ANOVA for Hybrid Models: The hybrid model means are exposed to ANOVA in order to detect any statistically significant differences by using it as a statistical hypothesis rejection tool. From this analysis, hybrid models’ behavior as a feature selection technique is well understood, along with response systems.
* Pairwise Comparison - Wilcoxon Signed Rank Test for Hybrid Models: Like that two-way model hyper comparison, hybrid models are subjected to the Wilcoxon Signed Rank Test, too. This research examines whether the extent of the difference between the performance of the models of PGGO-RBM, GGO-RBM, PSO-RBM, GWO-RBM, and GA-RBM is considerable or not. The outcomes provide a benchmark and allow for further recommendations.
The following sections are modeled to present the exhaustive exploration of the technical process that has been identified in the following part. This part will provide a detailed analysis of the held dataset, recommendation system, performance indicators and the results of all the analyses carried out. The process from dataset preprocessing to the evaluation of the hybrid models will be shown and then discussed, and implications for the optimization of electric vehicle paths will be drawn depending on the findings of this research.
3.1 Recommendation systems for optimizing electric vehicle paths
In this section, we delve into the intricacies of the recommendation systems selected for optimizing electric vehicle (EV) paths (Lopez-Behar et al., 2019). These systems play a crucial role in shaping the efficiency and effectiveness of EV charging, impacting factors such as charging time, cost, and overall user experience (Xing et al., 2021). We explore three distinct approaches: Markov Chain, Neural Autoregressive Distribution Estimation (NADE), and Restricted Boltzmann Machine (RBM) (Mohamed and Worku, 2020; Wang et al., 2020; Nogay, 2022). Each system offers unique insights and methodologies, contributing to the overarching goal of optimizing EV charging paths.
3.1.1 Markov Chain
To start the journey, we navigate through time using the Markov Chain, a coveted stochastic model that takes its name from the esteemed Russian mathematician Andrey Markov. Many branches have adopted this model as its overwhelming simplicity and efficiency in modeling sequential data are its main features. In the context of the EV charging paths, the Markov chain is a chain of events that occurs each time in a given state based on the state obtained in the previous event. Mathematically, a Markov Chain is defined by the probability distribution of transitioning from one state to another. Let Xn represent the state at time n, and Pij denote the probability of transitioning from state i to state j. The transition probability matrix P encapsulates these probabilities, enabling the prediction of future states based on historical patterns.
The implementation of Markov Chains employs the historical patterns of EV drivers’ charging usage. The model is able to analyze past charging sections to discover recurring events, which is the basis for the construction of a probabilistic framework to forecast the next stage in the charging sequence. This simplicity is a double-edged sword as it treats the future charging behavior completely as dependent on the current state, forgetting the other interdependencies present in the printed data. The advantage of the Markov Chain model being a simple structure is that it is computationally efficient and easy to interpret. It may feature simple charge patterns and trend recognition. Therefore, the load curve can be easily compared against it. Nevertheless, its current status determination leads to problems with such things as the inability to reveal long-term dependencies and more complex charging patterns. Further, the efficiency of the AI model heavily depends on the quality and representativeness of the historical data.
3.1.2 NADE (Neural Autoregressive Distribution Estimation)
Now passing over the border of the neural networks, the Neural Autoregressive Distribution Estimation (NADE) appears to be a very capable opponent. NADE exploits the versatility of deep learning neural networks to represent the nature of charging behaviors. NADE tends to be more sophisticated than the Markov Chain model as it can capture complex dependencies and patterns in the data set, thus offering a better probabilistic modeling approach for EV charging optimization. The NADE is built on the conditional probability of a charging session depending on the current state of the system, which is determined by features that came before. The network is trained to maximize the product of these probabilities, which are conditional according to this training scheme, thus learning complex relationships in the data.
Implementation: To operate the NADE, the network is trained to capture the conditional probability distribution of charging sessions. With backpropagation and optimization techniques like stochastic gradient descent, network parameters are adjusted in a way that would make it more likely to see actual charging sequences while observing them. It is this method that helps NADE detect multi-level patterns, thus making even the most sophisticated Markov Chain models look amateurish. Our ability to model the EV charging behavior based on the NADE algorithm is good due to its functionality in capturing complex dependencies and patterns. It can learn from diverse datasets, with the capability to adapt to variable charging patterns. Nevertheless, neural network training may be a computationally intensive process requiring large amounts of data and resources. NADE’s result would also be affected by hyperparameters and training data quality.
3.1.3 RBM (restricted Boltzmann Machine)
The restricted Boltzmann machine (RBM) incorporates probabilistic graphical models and machine learning, enriching the optimization of EV paths. RBM is characterized by its two layers of nodes: Invisible, visible and Hidden. It picks up a probability distribution over the visible units, which forms the basis for learning complex patterns in data. The energy function E(v, h) of an RBM with visible vector v and hidden vector h is defined as:
Where ai and bj are biases, wij represents weights between visible and hidden units, and Nv and Nh are the numbers of visible and hidden units, respectively. The Boltzmann distribution gives the probability distribution over visible units.
The realization of RBM means creating a model that can learn the hidden probability distribution of demand patterns for charging. Using models like the contrastive divergence approach, an RBM can learn to represent complex dependencies and patterns in the data, which in turn allows it to generate accurate recommendations on EV charging paths. RBM’s ability to capture the complex interactions between features makes it a perfect model for comprehending EV charging behavior. The fact that it uses unlabeled data to learn, with no need for supervision, makes this model flexible enough to handle multiple types of data. Besides, the computational cost can be a drawback of RBM due to the training process, and it may need fixing, such as overfitting and vanishing gradients in deep architectures. Besides, interpreting the learned representations of RBM is complicated because it is of a black-box nature.
3.2 GGO (greylag goose optimization)
The GGO algorithm mainly imitates social action and coordination, which is characteristic of the migration patterns of geese. Moreover, it also expresses the imitation behavioral dynamics of geese (Savitha et al., 2020). Social Behavior of Geese: Geese, when in united flocks, have a strong loyalty; they pair once with the same mate and remain so till their lives. The bond between them, the parental care, and a huge appreciation for their offspring and their survival even in adverse changing environments are beyond description, highlighting the strength of their unity, resilience, and loyalty. Interestingly, the survival of solitary geese among their kind becomes a challenge in the post-death mates’ search for new partners. Geese are found to have remarkable foraging devotion as they collect foliage for their nests and maintain their strong dedication to their chicks. Examples of the temporal dimension of ants can be seen in their reproductive cycles, e.g., the male ants guard the nest, and the female ones take care of the colony growth. The multifamily unit serving as the shared home of the geese family is actually a fine example of collective behavior. ”Sentinel” societies are involved as a community activity to watch out for possible perils. They serve in pairs, alternately, thus patrolling the archipelago with a watchbird dress code preventing enemy ships from invading the shores. The healing process, however, does not stop only among the settled geese; some of them also look after the ill, forming a solid community fellowship. Geese, however, only move a little while hens replace each other quite often with migrations that travel delineable distances. Through their V-shaped flight formation, they avoid air resistance, thus achieving a higher velocity. Geese possess some form of adaptive intelligence, which includes the use of long-term memory and landmark-based navigation.
The GGO algorithm initiates by creating individuals generating random candidate solutions to the problem. Each individual represents a candidate solution, denoted as GGO (Xi, i = 1, 2, …, n), with ′n′ indicating the population size (El-kenawy et al., 2024; Kleindorfer et al., 2024). The group’s objective function, Fn, is utilized, and the best solution (leader) is F(P). The group behavior in GGO dynamically allocates individuals to the exploration group (n1) and the exploitation group (n-2). Group sizes increase based on the best choice after each iteration. The algorithm starts with a 50% exploration and 50% exploitation balance, adjusting group sizes subsequently. If the best solution maintains the same objective function value for three consecutive iterations, the algorithm expands the exploration group size (n1) to address alternative solutions and prevent limit cycles. Figure 2 outlines the exploitation and exploration phases of the Grey Lag Goose Optimization (GLGO) algorithm. This way of visualizing the dynamics of GGO connects the solution space with its essence by optimizing the exploration (searching for new better solutions) and exploitation (deepening of existing solutions.) The picture has a motion for representing GGO’s iterative process, highlighting which algorithm is capable of balancing exploration and exploitation strategies for optimized finding the best solutions.
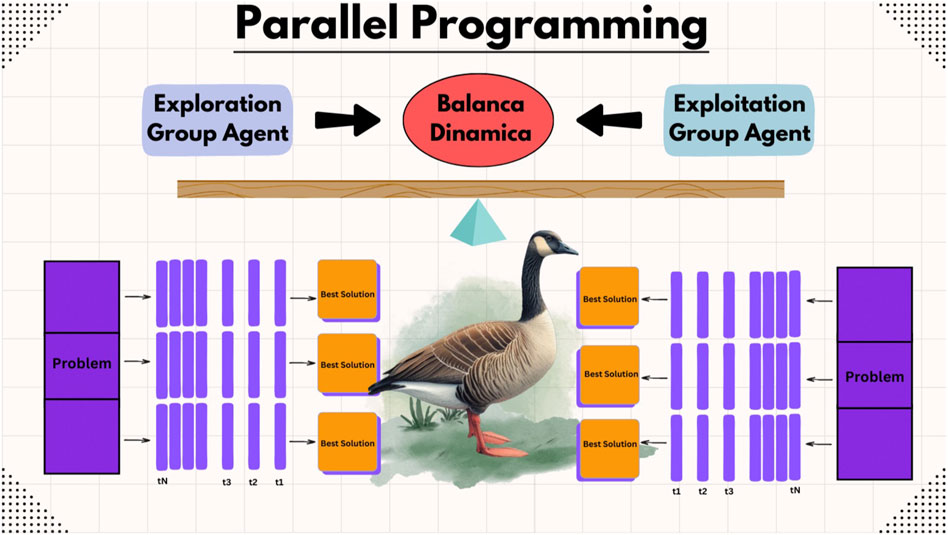
Figure 2. The exploration and exploitation of the proposed parallel GGO (PGGO).
3.2.1 Exploration operation
The exploration process is a key element in the GGO; in particular, this is a process of looking into the search space for the best possible solutions to prevent local optimal solutions and arrive at the global optima. By the action of explorer geese, which would select spots favorable to current ones, we obtain the optimum solution Towards the Best Solution. Equations for updating vectors A and C during iterations are employed, where A = 2a ⋅ r1 − a and C = 2.r2. The parameter ’a’ linearly changes from 2 to 0:
where X(t) represents the agent’s position at iteration t, X*(t) denotes the leader’s position, and r1 and r2 are random values within [0, 1]. To enhance exploration further, the algorithm incorporates an equation considering three randomly chosen search agents (X”Paddle1”, X”Paddle2”, and X”Paddle3”):
where w1, w2, and w3 update within [0, 2], z decreases exponentially according to
where b is a constant, l is a random value in [−1, 1], w4 updates within [0, 2], and r4 and r5 update within [0,1].
3.2.2 Exploitation operation
: The exploitative aspect of GGO is concentrated on improving the existing points of development, as shown in Figure 2. At the close of each cycle, the one with the highest fitness is recognized by GGO. Extractive procedures are realized through two strategies. Moving Towards the Best Solution involves guiding individuals (X”NonSentry”) toward the estimated position of the prey under the guidance of sentry solutions (X”Sentry1”, X”Sentry2”, and X”Sentry3”):
Here, A1, A2, A3 are calculated as A = 2a ⋅ r1 − a and C1, C2, C3 are calculated as C = 2r2. The updated positions for the population, X(t + 1), are expressed as the average of the three solutions X1, X2, and X3:
Searching the Area Around the Best Solution involves exploring regions near the optimal response (leader), denoted as X”Flock1”. The equation formulates this exploration process:
where D, z, and w contribute to the exploration process, with z calculated according to
The initial configuration supplies GGO with vital parameters, including the size of the population, mutation rate, and the total number of iterations. The participants are dynamically assigned into exploration and exploitation groups, prompting the evolution to occur recursively as the search for the best solution resolves. GGO incorporates the uncertain feature through randomness such that solution components can switch roles between groups for exploration and exploitation. As for using the Elitist approach, the guarantor of the presence of the enlightener throughout the whole process is ensured. The sequential application of steps in the GGO algorithm involves updating the positions of the exploration group (n1) and the exploitation group (n2). The parameter r1 undergoes dynamic updating during iterations, defined as r1 = c(1 − t/tmax), where t represents the current iteration, c is a constant, and tmax is the total number of iterations. At the end of each iteration, GGO updates agents in the search space, randomly altering their order to interchange their roles within the exploration and exploitation groups. In the final step, GGO returns the optimal solution.
3.3 The PGGO-RBM
This proposed optimization algorithm, the Parallel Greylag Goose Optimization (PGGO) algorithm, has garnered a lot of attention due to the fact that it is excellent at handling difficult optimization problems, as shown in Figure 2. Restricted Boltzmann Machines (RBMs) will be optimized using PGGO in this work. This will be the application of PGGO. RBM is a probabilistic graphical model that can be interpreted as a stochastic neural network according to one’s perspective. You are able to improve the performance of the model by fine-tuning the RBM parameters, such as weights and biases, by making use of PGGO. When it comes to finding ideal solutions, the iterative process of the algorithm mimics the behavior of a graylag goose, which is characterized by a combination of exploitation and exploration. In order to successfully model the underlying probability distribution of the data that is provided, RBMs can be tuned to make use of the power of PGGO. This gives them the ability to learn complicated patterns and produce high-quality outputs.
By first establishing an aim to reduce across all training set examples, ClassRBM can be trained to tackle a wide variety of classification problems. Such training can be accomplished. ”Dtrain = (xt, yt) Beginning with the most common training goal, the generative training goal, we will examine the many training goals that will be taken into consideration in the next section. When we have a model that defines a value for the joint probability as p(y, x), a generative training objective is a useful alternative to consider.
Due to the fact that it is the most widely used training objective for RBMs, a significant amount of effort has been taken to improve estimates for its gradient. In point of fact, as was mentioned earlier, it is often impossible to compute p(yt, xt) for some example (xt, yt), as well as logp(yt, xt) and its gradient with respect to any value of the ClassRBM parameter.
In particular, the first expectation is manageable, but the second expectation is not. A lot of different approaches have been proposed to estimate this second expectation. Among these methods, the contrastive divergence estimator has proven to be suitable for practical application. In this approximation, point estimates are utilized rather than expectations, and the starting state of the sampler for the observable variables is set to the training example consisting of the coordinates (xt, yt).
Algorithm 1.Proposed PGGO Algorithm.
1: Initialize PGGO population Xi(i = 1, 2, …, n), size n, iterations tmax, objective function Fn.
2: Initialize PGGO parameters a, A, C, b, l, c, r1, r2, r3, r4, r5, w, w1, w2, w3, w4, A1, A2, A3, C1, C2, C3, t = 1
3: Calculate objective function Fn for each agents Xi
4: Set P = best agent position
5: Update Solutions in exploration group (n1) and exploitation group (n2) for each agent Xi
6: Compare each agent objective function
7: while t ≤ tmax do
8: for (i = 1: i < n1 + 1) do
9: if (t%2 == 0) then
10: if (r3 < 0.5) then
11: if (|A| < 1) then
12: Update position of current search agent as X(t + 1) = X*(t) − A.|C.X*(t) − X(t)|
13: else
14: Select the best position search agents
15: Update (z) by the exponential form of
16: Update position of current search agent as X(t + 1) = w1*XPaddle1 + z*w2*(XPaddle2 − XPaddle3) + (1 − z)*w3*(X − XPaddle1)
17: end if
18: else
19: Update position of current search agent as X(t + 1) = w4*|X*(t) − X(t)|.ebl.cos(2πl) + [2w1(r4 + r5)] *X*(t)
20: end if
21: else
22: Update individual positions as X(t + 1) = X(t) + D(1 + z)*w*(X − XFlock1)
23: end if
24: end for
25: for (i = 1: i < n2 + 1) do
26: if (t%2 == 0) then
27: Calculate X1 = XSentry1 − A1.|C1.XSentry1 − X|, X2 = XSentry2 − A2.|C2.XSentry2 − X|, X3 = XSentry3 − A3.|C3.XSentry3 − X|
28: Update individual positions as
29: else
30: Update position of current search agent as X(t + 1) = X(t) + D(1 + z)*w*(X − XFlock1)
31: end if
32: end for
33: Calculate objective function Fn for each agent Xi
34: Update parameters
35: Set t = t + 1
36: Adjust beyond the search space solutions
37: end while
38: Return best agent P
In order to acquire an accurate representation of the data, it is customary to use only a single iteration of the Gibbs sampling technique. A training method known as stochastic gradient descent can make use of the estimated gradient information. Introducing approaches that are based on machine learning in order to construct a recommendation system that is specifically adapted to this user group is one of the ways in which this work has the potential to make a substantial contribution to machine learning and recommendation systems for drivers of electric vehicles. The suggested approach makes use of the PGGO-RBM approach. In order to improve the accuracy of predictions made with the evaluated dataset, the study is centered on the development of an optimized PGGO-RBM-based regression model. This paper provides a comparative analysis of the results that were generated by several algorithms in order to determine which of the findings produced the most desirable outcomes. A further investigation into statistical significance is carried out by employing the Wilcoxon rank-sum and analysis of variance (ANOVA) tests. PGGO-RBM-based regression models are noted for their adaptability and potential for wider applicability because they can be evaluated and altered to fit a variety of datasets. This demonstrates the model’s versatility.
3.3.1 Complexity analysis
Analyzing the complexity of the proposed algorithm involves understanding the computational cost of the operations within each iteration and their repetition over multiple iterations. In the following, the steps and the complexity analysis are presented:
• Steps in the Algorithm:
1. Initialization: Parameters and a population of agents are initialized.
2. Objective Function Calculation: Computed for each agent.
3. While Loop: Repeats until the maximum number of iterations (’tmax’) is reached.
• For Loop for Group1 (”n1” agents): Includes conditions and updates based on different parameters.
• For Loop for Group2 (”n2” agents): Similar to the first group but with different update mechanisms.
• Parameter Update and Objective Function Recalculation: This is performed for each iteration.
• Complexity Analysis:
1. Initialization Complexity: O(n) where n is the number of agents, assuming initialization of each agent is O(1).
2. Objective Function Calculation: O(n) for calculating the function across all agents once per iteration.
3. Update Mechanisms:
• The complexity of updating each agent can vary, but assuming O(1) for the operations like arithmetic calculations, conditional checks, and updates.
• The update loops run for n1 and n2 agents respectively within each iteration. Assuming the worst-case scenario where n1 + n2 = n, the complexity within the while loop for these operations is O(n).
• Total Complexity:
• Within Each Iteration: O(n) for objective function calculations and O(n) for the updates in the two groups.
• Overall Complexity: Since the while loop runs for tmax iterations, the total computational complexity is O(tmax ⋅ n).
4 Experimental results
A thorough testing procedure was carried out to determine whether or not the PGGO-RBM algorithm is superior and beneficial. Working on an Intel(R) Core(TM) i5 CPU working at 3.00 GHz, the tests were carried out on a machine that was running Windows 10 and Python 3.9. In the context of a case study, the experiments were carried out with the primary purpose of contrasting the results obtained from the PGGO-RBM approach with the results obtained from other models that were based on the RBM technique. Other optimization strategies included in the conducted experiments, such as the binary particle swarm optimizer (bPSO) (Awange et al., 2018; Martínez-Rodríguez et al., 2023), the binary whale optimization algorithm (bWOA) (Mirjalili and Lewis, 2016), the binary grey wolf optimizer (bGWO) (Mirjalili et al., 2014; Liu et al., 2023), the binary multiverse optimizer (bMVO) (Mirjalili et al., 2016), and the binary satin bowerbird optimizer (bSBO) (Samareh Moosavi and Khatibi Bardsiri, 2017), the binary firefly algorithm (bFA) (Fister et al., 2013), the binary genetic algorithm (bGA) (Immanuel and Chakraborty, 2019).
4.1 Dataset
Electric vehicles (EVs) are a significant breakthrough that marks the transition in modern mobility into more environment-friendly and environment-conscious innovation. Nonetheless, the extensive implementation of EVs is subject to diverse challenges, of which overnight charging stations play a crucial role. In order to disentangle various complexities of EV charging dynamics and create the right strategies for it, the availability of a comprehensive and sound dataset is irreplaceable (Varga et al., 2019). Here, we start a meticulous analysis of the Electric Vehicle Charging Dataset with the following objectives:
• Revealing the peculiarities of the dataset.
• Unraveling the mysteries of the data preprocessing pipeline.
• Taking a deep dive into descriptive statistics.
The detailed explication creates a presupposition for thorough and profound research, which will keep the dataset intact and multifaceted enough for us to pursue our research objectives. The field experiment conducted by Professor Omar Asensio’s team has managed to record a variety of charging behaviors among 85 EV (electric vehicle) drivers. According to the dataset, the network covers 105 charging stations located in 25 different places, covering the time framework from November 2014 to October 2015; as a whole, the number of charging sessions was 3395. It shows the period of transition in EV technology development, which is a complex process, to capture the depth of users’ behavior in reaction to charging infrastructure development and technological advancements. The records from dataset allocation are an inexhaustible source of information that condenses the key features of the charging experience. Between times, timestamps present the date and duration of each charging session, calling for insights into temporal patterns. The amount of power consumed in EVs, associated costs, and all aspects of charging locations as appropriate contextual attributes come together to construct a holistic narrative of EV charging behaviors (Arif et al., 2021).
4.2 Preliminary results
Table 2 and Figure 3 compare Markov chain, NADE, and RBM for electric vehicle path recommendation. Each algorithm’s performance is measured with 100 iterations and 10 agents across multiple metrics. RBM has the highest predictive accuracy at 0.94, followed by NADE at 0.93 and Markov chain at 0.92. RBM regularly has the highest sensitivity, specificity, p-value, N-value, and F-score metrics, proving its ability to forecast ideal electric vehicle trajectories. In addition to predicted accuracy, the table shows algorithm computational efficiency. RBM again has the lowest ideal solution of 5136.36 with a standard deviation of 61.75, indicating great consistency in its suggestions. RBM has the fastest average response time of 20.35 s, suggesting it can deliver optimal solutions quickly. These results demonstrate RBM’s advantages in predicted accuracy and computational efficiency for electric vehicle path recommendation. However, the performance differences between the algorithms are small. Thus, all three are feasible solutions based on requirements and limits. Further investigation may be needed to understand RBM’s better performance and to optimize or adjust the algorithms to improve their capabilities. This comparison helps electric vehicle stakeholders find the best path recommendation solutions.
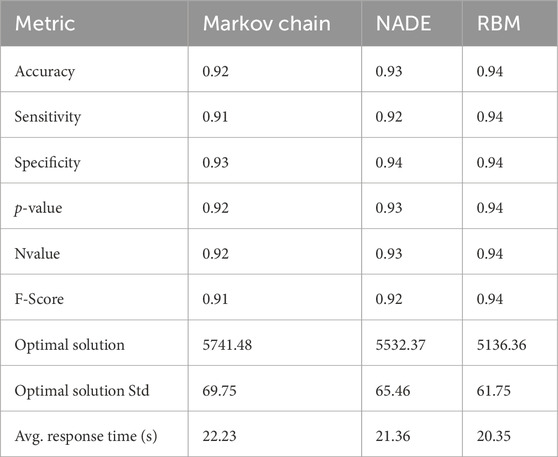
Table 2. The preliminary results of the recommendation based on the basic methods.
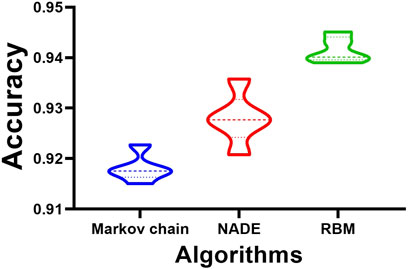
Figure 3. The preliminary accuracy of the recommendation results.
Table 3 provides a statistical analysis of preliminary results from three algorithms—Markov chain, NADE, and RBM—for electric vehicle path recommendation. The analysis includes data-driven indicators that reveal algorithm performance and distribution. The measurements show that all three algorithms were assessed using the same five values. Including minimum, 25th percentile, median, 75th percentile, and maximum numbers gives a good summary of the results range and distribution. RBM outperforms the other algorithms with a minimum accuracy of 0.94, a maximum of 0.95, and a small range of 0.01. Markov chain, NADE, and RBM have mean accuracy values of 0.92, 0.93, and 0.94, respectively, with RBM having slightly greater accuracy. Standard deviation values, which measure accuracy value dispersion from the mean, are low across all algorithms, showing consistent performance.
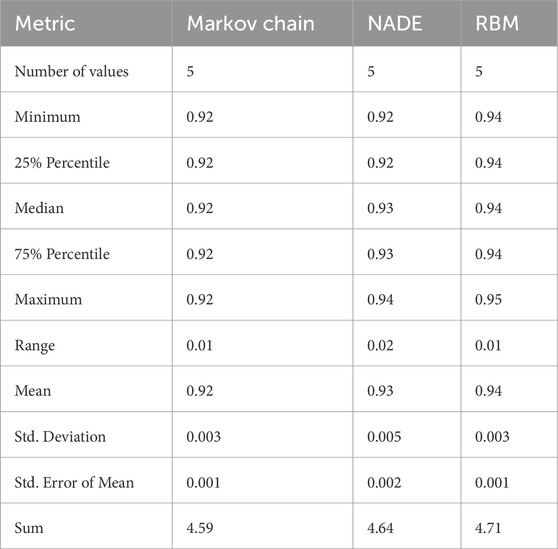
Table 3. Statistical analysis of the preliminary results.
RBM has the lowest standard deviation of 0.003, demonstrating its accuracy in recommendations. Additionally, each algorithm’s accuracy sum measures its performance over the examined dataset. RBM has the greatest sum of 4.71, proving its superiority over the Markov chain and NADE in predicting electric car optimal pathways. This statistical research sheds light on electric vehicle path suggestion method dispersion and performance. While all algorithms are precise and consistent, RBM performs best across metrics, proving its reliability in making suggestions. To better understand each algorithm’s real-world capabilities and limits, these results may need further investigation and validation.
Table 4 shows the results of an ANOVA test on preliminary data from electric vehicle path suggestion algorithm evaluation. The ANOVA test compares sample group means. The ANOVA test determines whether the accuracy values of the Markov chain, NADE, and RBM algorithms show statistically significant differences. The ANOVA test findings are divided into Treatment, Residual, and Total. The Treatment section describes algorithm variations. Sums of squares, degrees of freedom, mean squares, F-statistic, and p-value are included. The treatment SS is 0.0014 with 2 degrees of freedom, yielding an MS of 0.0007. The F-statistic (F(2,12) = 48.64) reveals a substantial difference in accuracy between methods (p < 0.0001). After treatment differences, the Residual section shows algorithm group variability. For residual variance, it comprises SS, DF, and MS. With 12 degrees of freedom, the residual SS is 0.0002, and the MS is 0.00001. This residual variance explains the unexplained accuracy variation within algorithm groups. The Total part summarizes data variability, including treatment (algorithm differences) and residual variability. The overall SS is 0.0016 with 14 degrees of freedom. ANOVA test results show a statistically significant difference in accuracy between the three methods. This shows that one algorithm recommends optimal electric car paths better than the others. Post-hoc analyses like pairwise comparisons may be performed to discover algorithms with significant performance differences. The ANOVA test also emphasizes the relevance of algorithm selection in electric vehicle path recommendation systems for best performance.
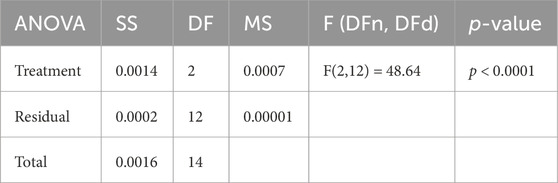
Table 4. Analysis of Variance (ANOVA) test results based on the preliminary results.
Table 5 shows the Wilcoxon signed-rank test results from preliminary electric car path suggestion algorithm evaluation data. The non-parametric Wilcoxon signed-rank test compares matched samples to determine if their distributions differ significantly. Based on accuracy results, the test seeks to assess whether Markov chain, NADE, and RBM algorithms perform statistically differently. The Wilcoxon signed-rank test results are categorized to provide rank distributions and p-values for each algorithm pair comparison. The theoretical median for each method pair is 0, reflecting the null hypothesis that the two algorithms perform similarly. The medians for Markov chain vs NADE, RBM, and NADE vs RBM are 0.9176, 0.9277, and 0.9401, respectively, rejecting the null hypothesis for all comparisons. Every algorithm pair comparison considers 5 values, reflecting the size of the paired samples. For each algorithm pair comparison, the sum of signed rankings, positive ranks, and negative ranks equals 15, confirming rank symmetry and no significant deviations from the null hypothesis. The Wilcoxon signed-rank test results’ p-values, which assess the statistical significance of algorithm pair performance differences, are the most important. In this scenario, all p-values for Markov chain vs NADE, RBM, and NADE vs RBM comparisons are 0.00625, strongly rejecting the null hypothesis and indicating that each pair of algorithms performs differently. Wilcoxon signed-rank test findings show considerable disparities in algorithm performance when selecting ideal electric vehicle paths. These findings emphasize the necessity of carefully selecting the best electric vehicle path selection algorithm for optimal performance and user happiness.
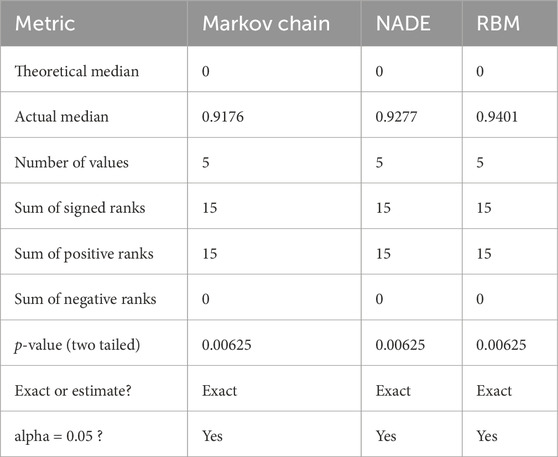
Table 5. Wilcoxon signed rank test results based on the preliminary results.
4.3 Feature selection results
Table 6 and Figure 4 compare feature selection results using the proposed bPGGO (binary parallel greylag goose optimization) algorithm to other optimization algorithms like bGGO, bPSO, bGWO, and bGA. Model building requires feature selection to determine the most important subset of features that improve predicted performance. Compared to competing algorithms, bPGGO performs well across all measures. Its lowest average error of 0.29 indicates its ability to select a feature subset that improves forecast accuracy. The bPGGO has the lowest average selected feature size of 0.28, indicating that it can identify a compact subset of highly useful characteristics for electric vehicle path suggestion. The average fitness for bPGGO is 0.39, showing that the selected feature subset produces models with superior overall performance than other algorithms. The standard deviation of fitness for bPGGO is 0.21, indicating improved stability in feature subset quality across optimization iterations. Although bPGGO performs well, bGWO and bGA also perform well in some criteria. The lowest worst fitness value of 0.46 is for bGWO, indicating that its feature subset is effective even in the worst case. At 0.22, bGA has the lowest fitness standard deviation, indicating strong consistency in developing feature subsets with good performance. The comparative analysis in the table shows that many optimization techniques are needed to find appropriate feature subsets for electric vehicle path suggestions, even though bPGGO looks promising. This study and validation may be needed to determine the robustness and generalizability of these findings across datasets and application domains.

Table 6. Feature selection results using the proposed bPGGO algorithm.
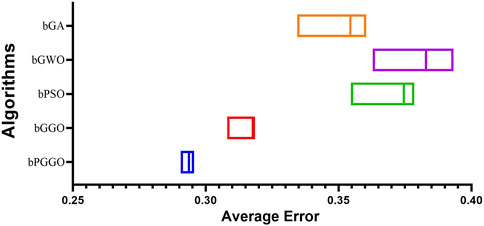
Figure 4. Average error of the feature selection results.
The ANOVA test results, in Table 7, reveal the efficacy of feature selection approaches for electric vehicle path suggestion, including the suggested binary parallel greylag goose optimization (bPGGO) algorithm. The ANOVA test determines if feature selection approaches perform statistically differently based on observed metrics. The outcomes are separated into Treatment, Residual, and Total. The Treatment section describes feature selection technique variations. The sum of squares (SS) for treatment is 0.04 with 4 degrees of freedom (DF), yielding a mean square (MS) of 0.0099. The F-statistic (F(4, 30) = 210.8) suggests a substantial difference in efficacy among feature selection approaches (p < 0.0001). After treatment differences, the Residual section shows variability within each feature selection method group. For residual variance, it comprises SS, DF, and MS. The residual SS is 0.001, with 30 degrees of freedom, yielding 4.68E-05 MS. This residual variance explains the inexplicable variation in feature selection technique performance. The Total part summarizes data variability, including treatment (feature selection methods) and residual variability. The overall SS is 0.041 with 34 degrees of freedom. ANOVA test findings show a statistically significant difference in feature selection method performance based on observed metrics. This shows that at least one technique selects informative features for electric car path suggestions better than the others. Post-hoc analysis, like pairwise comparisons, may be performed to discover approaches with significant performance differences. These findings emphasize the relevance of feature selection for electric vehicle path recommendation system accuracy and efficiency.
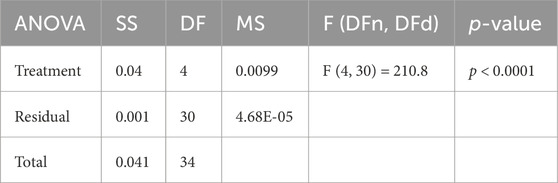
Table 7. ANOVA test results for the proposed feature selection method.
Table 8 shows the Wilcoxon signed-rank test results for feature selection methods used for electric vehicle path recommendation, including the proposed binary parallel greylag goose optimization (bPGGO) algorithm and its comparison with bGGO, bPSO, bGWO, and bGA. The non-parametric Wilcoxon signed-rank test compares matched samples to determine if their distributions differ significantly. Statistics for each feature selection approach are shown in each row. The null hypothesis that all methods perform similarly is represented by the theoretical median of 0. The median values for bPGGO, bGGO, bPSO, bGWO, and bGA are 0.29, 0.32, 0.37, 0.38, and 0.35, respectively, rejecting the null hypothesis for all comparisons. Each technique comparison uses 7 numbers, indicating a matched sample size. For each technique comparison, the sum of signed rankings, positive ranks, and negative ranks equals 28, confirming rank symmetry and no significant deviations from the null hypothesis. Each technique comparison’s p-values are 0.02, below the significance level (alpha) of 0.05, showing statistical significance. This shows large performance disparities between each set of feature selection approaches. The table also shows the difference between each method’s theoretical and actual medians, highlighting performance discrepancies. Wilcoxon signed-rank test findings indicate that the bPGGO algorithm outperforms alternative feature selection methods for electric vehicle path suggestions. These findings demonstrate bPGGO’s ability to choose informative attributes for electric vehicle path recommendation.
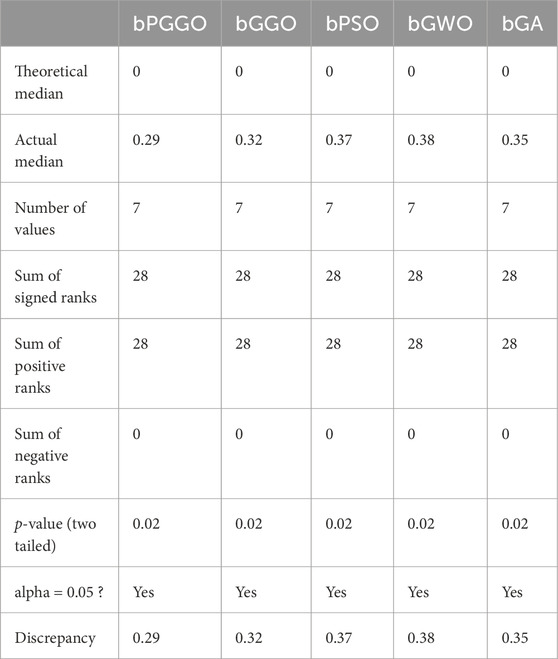
Table 8. Wilcoxon signed rank test results for the proposed feature selection method.
4.4 Evaluation of recommendation results
Table 9 shows the accuracy of recommendation systems for electric vehicle charging station selection after feature selection (FS) using the binary parallel greylag goose optimization (bPGGO) algorithm. The Markov chain, NADE, and RBM models were tested for optimal charging station recommendations. After feature selection, each model’s accuracy metrics were calculated. RBM had the greatest accuracy of 0.96, followed by Markov chain at 0.93 and NADE at 0.95. Each model’s accuracy rate shows how well it guides electric vehicle owners to the best charging stations. The table offers additional metrics needed to evaluate recommendation systems. The ”Optimal solution” metric measures each model’s average recommended charging station distance. Lower values indicate better travel distance suggestions since optimal recharge stations are closer. The ”Optimal solution Std” (standard deviation) shows the variability of the optimal solution distances around the mean value. Smaller standard deviation values indicate more consistent and accurate recommendations across circumstances, strengthening recommendation systems. Additionally, the ”Avg. response time” indicator shows how long each model takes to make recommendations. Shorter response times reflect faster decision-making, making recommendation systems more useful. The RBM model had the highest accuracy post-feature selection, suggesting it can recommend electric vehicle charging stations. RBM also performs well in optimal solution distance and response time, making it suitable for real-world use in guiding electric vehicle customers to ideal charging options.
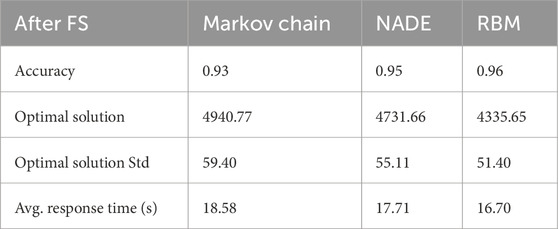
Table 9. Recommendation accuracy results after feature selection.
Table 10, Figures 5, 6 shows electric vehicle path recommendation accuracy using improved models from various optimization strategies. Each column represents an optimization method paired with RBM, including PGGO, GGO, PSO, GWO, and GA. The improved models perform well across all techniques, with accuracy values between 0.96 and 0.99. The most accurate electric vehicle path recommendation model is the PGGO-RBM model at 0.99. The GGO-RBM and PSO-RBM models perform well in path recommendation tasks with accuracy values of 0.98 each. The table also shows how objective function values affect optimal solution quality. The objective function—the proposed paths’ quality or cost—is minimized by optimization methods. Low objective function values imply good pathways. The optimal solutions (Opt. solution) from PGGO-RBM, GGO-RBM, PSO-RBM, GWO-RBM, and GA-RBM have objective function values of 3219.0, 3358.3, 3680.3, 4076.3, and 4285.4. The PGGO-RBM model produces the best pathways among the algorithms. The table also shows the optimized solutions’ standard deviation (Std.), revealing each algorithm’s unpredictability or stability. Lower standard deviations indicate optimization stability. The PGGO-RBM model consistently has the lowest standard deviation (37.01), indicating a more stable optimization process. Finally, each optimized model’s computational efficiency is shown by its average reaction time (Avg. response). The PGGO-RBM model has the fastest average response time at 9.12 s, followed by GGO, PSO, GWO, and GA. This shows that PGGO-RBM is a good candidate for real-time electric vehicle path recommendation systems since it has higher accuracy and solution quality and a lower processing time. The PGGO algorithm outperforms existing optimization algorithms in electric vehicle path suggestion accuracy, solution quality, stability, and computing efficiency.
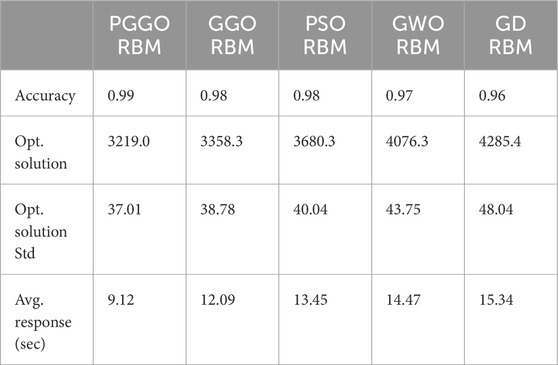
Table 10. Recommendation accuracy using the optimized models.
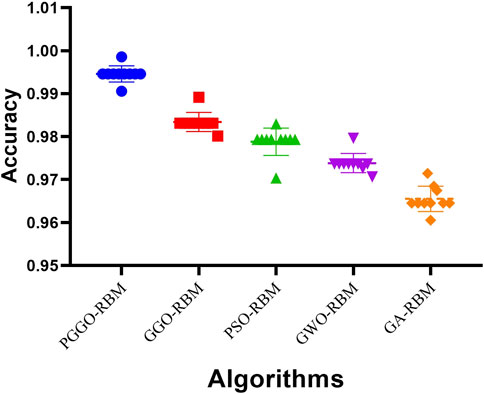
Figure 5. Recommendation accuracy based on the optimized models.
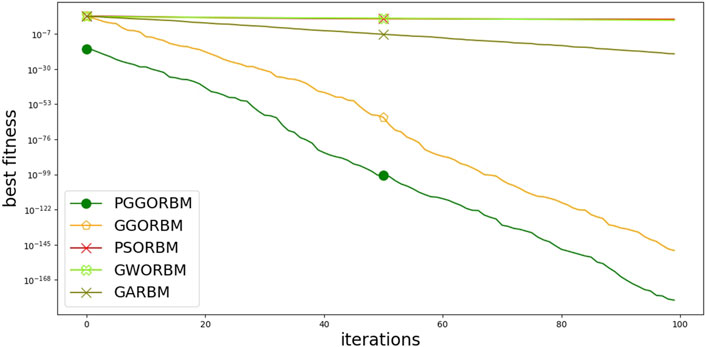
Figure 6. Convergence of the optimization algorithms.
Table 11 shows the results of an Analysis of Variance (ANOVA) test on optimized models for electric vehicle path recommendation using various optimization algorithms, including bPGGO and others. The ANOVA test determines if optimization algorithm recommendation results differ statistically. The ANOVA test findings are separated into Treatment, Residual, and Total. The Treatment section describes the heterogeneity in optimization algorithm suggestion results. The sum of squares (SS) for treatment is 0.005, with 4 degrees of freedom (DF), yielding a mean square (MS) of 0.0012. The estimated F-statistic, F(4,45) = 182.1, reveals significant differences in optimization algorithm recommendations (p < 0.0001). After treatment differences are taken into account, the residual portion shows variability within each optimization algorithm group. For residual variance, it comprises SS, DF, and MS. With 45 degrees of freedom, the residual SS is 0.0003, and the MS is 0.00001. This residual variance explains the unexplained variation in optimization algorithm group recommendation results. Finally, the Total section summarizes the recommendation outcomes’ total variability, including treatment (optimization method) and residual variability. The overall SS is 0.005, with 49 degrees of freedom. Optimization algorithms differ significantly in recommended results, according to ANOVA. One optimization technique appears to be more effective in recommending appropriate electric car paths. To discover algorithms with significant performance differences, post hoc analysis like pairwise comparisons may be performed. These findings emphasize the need to use an appropriate optimization technique to improve electric vehicle path suggestion systems.
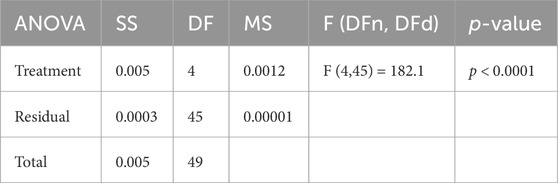
Table 11. ANOVA test results of the recommendation results based on the optimized models.
The Wilcoxon signed rank test on optimized models for electric vehicle path recommendation using various optimization algorithms, including bPGGO, GGO, PSO, GWO, and GA, is shown in Table 12. Suitable for assessing optimization algorithm performance, the Wilcoxon signed rank test determines if matched samples differ statistically. Many Wilcoxon-signed rank test measures are listed in Table 1 Theoretical median and real median: The theoretical median is 0, meaning optimization algorithm recommendation outcomes are identical. The median difference in recommendation accuracy for each method is 0.96–0.99. (2) Values: The Wilcoxon signed rank test for each optimization approach uses paired samples. (3) Sum of signed ranks, positive ranks, and negative rankings: These metrics measure the sum of ranks for positive and negative differences between paired samples, revealing their magnitude and direction. (4) p-value (two-tailed): The p-value is the probability of obtaining the observed difference (or more extreme) under the null hypothesis that there is no difference between optimization algorithm recommendation results. A small p-value (0.002) indicates statistical significance, suggesting that optimization algorithms offer different recommendation results. (5) Alpha = 0.05: This measure indicates that the Wilcoxon signed rank test’s significance level (alpha) is 0.05. (6) Discrepancy: This statistic quantifies the difference between the observed median recommendation accuracy and the theoretical median of zero, revealing the extent of optimization algorithm recommendation accuracy variances. Wilcoxon signed-rank test results indicate a statistically significant difference in optimization algorithm recommendation outcomes. Some optimization algorithms may be better at recommending appropriate electric car paths. Further investigation may reveal the optimization algorithms that perform well in electric vehicle path suggestion tasks and their causes.
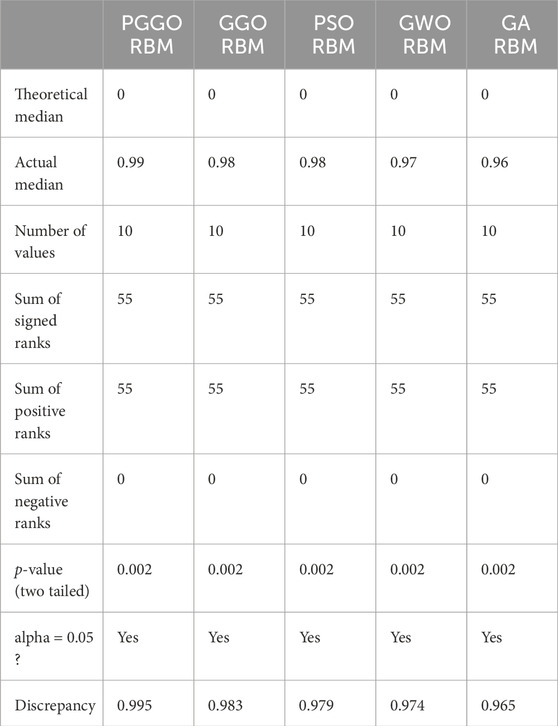
Table 12. Wilcoxon signed test results of the recommendation results based on the optimized models.
5 Conclusion
Establishing a charging infrastructure that is dependable and simple to use is becoming increasingly important as the number of electric vehicles (EVs) continues to increase. A recommendation system that is specifically designed to aid electric vehicle owners in discovering charging stations that are convenient for them, improving the charging experience, and reducing range anxiety is presented in this research. This study has the potential to make important contributions to the disciplines of machine learning and recommendation systems that are specifically designed for drivers of electric vehicles. This is because it incorporates techniques from machine learning and creates a recommendation system that caters specifically to this user demography. With its foundation in optimization concepts, the proposed methodology makes use of the algorithm known as Parallel Greylag Goose Optimization and Restricted Boltzmann Machines (PGGO-RBM). The goal is to construct an improved PGGO-RBM-based regression model with the expectation of achieving a higher level of prediction accuracy by making use of the investigated dataset. As part of the research, a comparative examination of the results produced by a number of different algorithms is being carried out in order to determine which outcomes are the most favorable. Evaluation of the findings is carried out through the utilization of statistical significance evaluations, such as the Wilcoxon rank-sum and ANOVA tests. The fact that the PGGO-RBM-based regression model can be evaluated and modified to incorporate a wide range of datasets highlights the adaptability of the model as well as its potential for wider application in the context of future research. This exemplifies the adaptability of the concept and draws attention to the fact that it has application potential in a larger context.
Data availability statement
The original contributions presented in the study are included in the article/sSupplementary material, further inquiries can be directed to the corresponding authors.
Author contributions
AA: Writing–original draft, Writing–review and editing. DK: Writing–original draft, Writing–review and editing. E-SE-K: Writing–original draft, Writing–review and editing. ME: Writing–original draft, Writing–review and editing. AI: Writing–original draft, Writing–review and editing. LA: Writing–original draft, Writing–review and editing. NK: Writing–original draft, Writing–review and editing. AA: Writing–original draft, Writing–review and editing.
Funding
The author(s) declare that no financial support was received for the research, authorship, and/or publication of this article.
Acknowledgments
Princess Nourah bint Abdulrahman University Researchers Supporting Project number (PNURSP2024R120), Princess Nourah bint Abdulrahman University, Riyadh, Saudi Arabia. The author would like to thank the Deanship of Scientific Research at Shaqra University for supporting this work.
Conflict of interest
The authors declare that the research was conducted in the absence of any commercial or financial relationships that could be construed as a potential conflict of interest.
Publisher’s note
All claims expressed in this article are solely those of the authors and do not necessarily represent those of their affiliated organizations, or those of the publisher, the editors and the reviewers. Any product that may be evaluated in this article, or claim that may be made by its manufacturer, is not guaranteed or endorsed by the publisher.
References
Abdelhamid, A. A., El-Kenawy, E. S. M., Khodadadi, N., Mirjalili, S., Khafaga, D. S., Alharbi, A. H., et al. (2022). Classification of monkeypox images based on transfer learning and the Al-biruni earth radius optimization algorithm. Mathematics 10, 3614. doi:10.3390/math10193614
Abdel Samee, N., M El-Kenawy, E. S., Atteia, G., M Jamjoom, M., Ibrahim, A., A Abdelhamid, A., et al. (2022). Metaheuristic optimization through deep learning classification of燙OVID-19 in chest X-ray images. Comput. Mater. Continua 73, 4193–4210. doi:10.32604/cmc.2022.031147
Afzal, M. Z., Aurangzeb, M., Iqbal, S., Pushkarna, M., Rehman, A. U., Kotb, H., et al. (2023). A novel electric vehicle battery management system using an artificial neural network-based adaptive droop control theory. Int. J. Energy Res. 2023, 1–15. doi:10.1155/2023/2581729
Arif, S. M., Lie, T. T., Seet, B. C., Ayyadi, S., and Jensen, K. (2021). Review of electric vehicle technologies, charging methods, standards and optimization techniques. Electronics 10, 1910. doi:10.3390/electronics10161910
Aurangzeb, M., Xin, A., Iqbal, S., Afzal, M. Z., Kotb, H., AboRas, K. M., et al. (2023). A novel hybrid approach for power quality improvement in a vehicle-to-grid setup using droop-ann model. Int. J. Energy Res. 2023, 1–30. doi:10.1155/2023/7786928
J. L Awange, B Paláncz, RH Lewis, L Völgyesi, P. Swarm Optimization, J. L. Awange, B. Paláncz, R. H. Lewis, and L. Völgyesi (2018). Mathematical geosciences: hybrid symbolic-numeric methods (Cham: Springer International Publishing), 167–184. doi:10.1007/978-3-319-67371-4_6
Babanezhad, M., Arabi Nowdeh, S., Abdelaziz, A. Y., AboRas, K. M., and Kotb, H. (2022). Reactive power based capacitors allocation in distribution network using mathematical remora optimization algorithm considering operation cost and loading conditions. Alexandria Eng. J. 61, 10511–10526. doi:10.1016/j.aej.2022.04.009
Buzna, L., De Falco, P., Ferruzzi, G., Khormali, S., Proto, D., Refa, N., et al. (2021). An ensemble methodology for hierarchical probabilistic electric vehicle load forecasting at regular charging stations. Appl. Energy 283, 116337. doi:10.1016/j.apenergy.2020.116337
Csiszár, C., Csonka, B., Földes, D., Wirth, E., and Lovas, T. (2019). Urban public charging station locating method for electric vehicles based on land use approach. J. Transp. Geogr. 74, 173–180. doi:10.1016/j.jtrangeo.2018.11.016
Dharavat, N., Golla, N. K., Sudabattula, S. K., Velamuri, S., Kantipudi, MVVP, Kotb, H., et al. (2023). Impact of plug-in electric vehicles on grid integration with distributed energy resources: a review. Front. Energy Res. 10. doi:10.3389/fenrg.2022.1099890
Djaafari, A., Ibrahim, A., Bailek, N., Bouchouicha, K., Hassan, M. A., Kuriqi, A., et al. (2022). Hourly predictions of direct normal irradiation using an innovative hybrid LSTM model for concentrating solar power projects in hyper-arid regions. Energy Rep. 8, 15548–15562. doi:10.1016/j.egyr.2022.10.402
Domínguez-Navarro, J., Dufo-López, R., Yusta-Loyo, J., Artal-Sevil, J., and Bernal-Agustín, J. (2019). Design of an electric vehicle fast-charging station with integration of renewable energy and storage systems. Int. J. Electr. Power & Energy Syst. 105, 46–58. doi:10.1016/j.ijepes.2018.08.001
El-kenawy, E. S. M., Ibrahim, A., Bailek, N., Bouchouicha, K., Hassan, M. A., Jamei, M., et al. (2022d). Sunshine duration measurements and predictions in Saharan Algeria region: an improved ensemble learning approach. Theor. Appl. Climatol. 147, 1015–1031. doi:10.1007/s00704-021-03843-2
El-kenawy, E. S. M., Khodadadi, N., Mirjalili, S., Abdelhamid, A. A., Eid, M. M., and Ibrahim, A. (2024). Greylag goose optimization: nature-inspired optimization algorithm. Expert Syst. Appl. 238, 122147. doi:10.1016/j.eswa.2023.122147
El-Kenawy, E. S. M., Khodadadi, N., Mirjalili, S., Makarovskikh, T., Abotaleb, M., Karim, F. K., et al. (2022a). Metaheuristic optimization for improving weed detection in wheat images captured by drones. Mathematics 10, 4421. doi:10.3390/math10234421
El-Kenawy, E. S. M., Mirjalili, S., Abdelhamid, A. A., Ibrahim, A., Khodadadi, N., and Eid, M. M. (2022b). Meta-heuristic optimization and keystroke dynamics for authentication of smartphone users. Mathematics 10, 2912. doi:10.3390/math10162912
El-kenawy, E. S. M., Zerouali, B., Bailek, N., Bouchouich, K., Hassan, M. A., Almorox, J., et al. (2022c). Improved weighted ensemble learning for predicting the daily reference evapotranspiration under the semi-arid climate conditions. Environ. Sci. Pollut. Res. 29, 81279–81299. doi:10.1007/s11356-022-21410-8
Fister, I., Fister, I., Yang, X. S., and Brest, J. (2013). A comprehensive review of firefly algorithms. Swarm Evol. Comput. 13, 34–46. doi:10.1016/j.swevo.2013.06.001
Golla, N. K., Dharavat, N., Sudabattula, S. K., Velamuri, S., Kantipudi, MVVP, Kotb, H., et al. (2023). Techno-economic analysis of the distribution system with integration of distributed generators and electric vehicles. Front. Energy Res. 11. doi:10.3389/fenrg.2023.1221901
Hasan, M. K., Mahmud, M., Ahasan Habib, A., Motakabber, S., and Islam, S. (2021). Review of electric vehicle energy storage and management system: standards, issues, and challenges. J. Energy Storage 41, 102940. doi:10.1016/j.est.2021.102940
Immanuel, S. D., and Chakraborty, U. K. (2019). “Genetic algorithm: an approach on optimization,” in 2019 International Conference on Communication and Electronics Systems (ICCES), 17-19, July 2019, 701–708. doi:10.1109/ICCES45898.2019.9002372
Ju, Y., Ju, D., Santibanez, G. E. D., Giannakis, M., and Wang, A. (2019). Study of site selection of electric vehicle charging station based on extended GRP method under picture fuzzy environment. Comput. Industrial Eng. 135, 1271–1285. doi:10.1016/j.cie.2018.07.048
Khafaga, D. S., Alhussan, A. A., El-Kenawy, E. S. M., Ibrahim, A., Eid, M. M., and Abdelhamid, A. A. (2022b). Solving optimization problems of metamaterial and double T-shape antennas using advanced meta-heuristics algorithms. IEEE Access 10, 74449–74471. doi:10.1109/ACCESS.2022.3190508
Khafaga, D. S., Ibrahim, A., El-Kenawy, E. S. M., Abdelhamid, A. A., Karim, F. K., Mirjalili, S., et al. (2022a). An Al-biruni earth radius optimization-based deep convolutional neural network for classifying monkeypox disease. Diagnostics 12, 2892. doi:10.3390/diagnostics12112892
Kleindorfer, S., Heger, B., Tohl, D., Frigerio, D., Hemetsberger, J., Fusani, L., et al. (2024). Cues to individuality in Greylag Goose faces: algorithmic discrimination and behavioral field tests. J. Ornithol. 165, 27–37. doi:10.1007/s10336-023-02113-4
Kumar, R. R., and Alok, K. (2020). Adoption of electric vehicle: a literature review and prospects for sustainability. J. Clean. Prod. 253, 119911. doi:10.1016/j.jclepro.2019.119911
Lakhan, A., Mohammed, M. A., Garcia-Zapirain, B., Nedoma, J., Martinek, R., Tiwari, P., et al. (2022). Fully homomorphic enabled secure task offloading and scheduling system for transport applications. IEEE Trans. Veh. Technol. 71, 12140–12153. doi:10.1109/TVT.2022.3190490
Liu, Y., Jiang, Y., Zhang, X., Pan, Y., and Wang, J. (2023). An improved grey wolf optimizer algorithm for identification and location of gas emission. J. Loss Prev. Process Industries 82, 105003. doi:10.1016/j.jlp.2023.105003
Lopez-Behar, D., Tran, M., Froese, T., Mayaud, J. R., Herrera, O. E., and Merida, W. (2019). Charging infrastructure for electric vehicles in Multi-Unit Residential Buildings: mapping feedbacks and policy recommendations. Energy Policy 126, 444–451. doi:10.1016/j.enpol.2018.10.030
Martínez-Rodríguez, D., Novella, R., Bracho, G., Gomez-Soriano, J., Fernandes, C., Lucchini, T., et al. (2023). A particle swarm optimization algorithm with novelty search for combustion systems with ultra-low emissions and minimum fuel consumption. Appl. Soft Comput. 143, 110401. doi:10.1016/j.asoc.2023.110401
M El-kenawy, E. S., Ibrahim, A., Mirjalili, S., Zhang, Y. D., Elnazer, S., and M Zaki, R. (2022). Optimized ensemble algorithm for predicting metamaterial antenna parameters. Comput. Mater. Continua 71, 4989–5003. doi:10.32604/cmc.2022.023884
Mirjalili, S., and Lewis, A. (2016). The whale optimization algorithm. Adv. Eng. Softw. 95, 51–67. doi:10.1016/j.advengsoft.2016.01.008
Mirjalili, S., Mirjalili, S. M., and Hatamlou, A. (2016). Multi-verse optimizer: a nature-inspired algorithm for global optimization. Neural Comput. Appl. 27, 495–513. doi:10.1007/s00521-015-1870-7
Mirjalili, S., Mirjalili, S. M., and Lewis, A. (2014). Grey wolf optimizer. Adv. Eng. Softw. 69, 46–61. doi:10.1016/j.advengsoft.2013.12.007
Mohamed, A., and Worku, H. (2020). Simulating urban land use and cover dynamics using cellular automata and Markov chain approach in Addis Ababa and the surrounding. Urban Clim. 31, 100545. doi:10.1016/j.uclim.2019.100545
Mohamed, N., Aymen, F., Ali, Z. M., Zobaa, A. F., and Abdel Aleem, S. H. E. (2021). Efficient power management strategy of electric vehicles based hybrid renewable energy. Sustainability 13, 7351. doi:10.3390/su13137351
Mohammad, A., Zamora, R., and Lie, T. T. (2020). Integration of electric vehicles in the distribution network: a review of PV based electric vehicle modelling. Energies 13, 4541. doi:10.3390/en13174541
Mohammed, M. A., Lakhan, A., Abdulkareem, K. H., Zebari, D. A., Nedoma, J., Martinek, R., et al. (2023). Homomorphic federated learning schemes enabled pedestrian and vehicle detection system. Internet Things 23, 100903. doi:10.1016/j.iot.2023.100903
Nogay, H. S. (2022). Estimating the aggregated available capacity for vehicle to grid services using deep learning and Nonlinear Autoregressive Neural Network. Sustain. Energy, Grids Netw. 29, 100590. doi:10.1016/j.segan.2021.100590
Pagani, M., Korosec, W., Chokani, N., and Abhari, R. (2019). User behaviour and electric vehicle charging infrastructure: an agent-based model assessment. Appl. Energy 254, 113680. doi:10.1016/j.apenergy.2019.113680
Pal, A., Bhattacharya, A., and Chakraborty, A. K. (2021). Allocation of electric vehicle charging station considering uncertainties. Sustain. Energy, Grids Netw. 25, 100422. doi:10.1016/j.segan.2020.100422
Pan, L., Yao, E., Yang, Y., and Zhang, R. (2020). A location model for electric vehicle (EV) public charging stations based on drivers’ existing activities. Sustain. Cities Soc. 59, 102192. doi:10.1016/j.scs.2020.102192
Rizk, F. H., Arkhstan, S., Zaki, A. M., Kandel, M. A., and Towfek, S. K. (2023). Integrated CNN and waterwheel plant algorithm for enhanced global traffic detection. J. Artif. Intell. Metaheuristics 6, 36–45. doi:10.54216/JAIM.060204
Samareh Moosavi, S. H., and Khatibi Bardsiri, V. (2017). Satin bowerbird optimizer: a new optimization algorithm to optimize anfis for software development effort estimation. Eng. Appl. Artif. Intell. 60, 1–15. doi:10.1016/j.engappai.2017.01.006
Sami Khafaga, D., Ali Alhussan, A., M El-kenawy, E. S., E Takieldeen, A., M Hassan, T., A Hegazy, E., et al. (2022). Meta-heuristics for feature selection and classification in diagnostic Breast燙ancer. Comput. Mater. Continua 73, 749–765. doi:10.32604/cmc.2022.029605
Savari, G. F., Krishnasamy, V., Sathik, J., Ali, Z. M., and Abdel Aleem, S. H. (2020). Internet of Things based real-time electric vehicle load forecasting and charging station recommendation. ISA Trans. 97, 431–447. doi:10.1016/j.isatra.2019.08.011
Savitha, R., Ambikapathi, A., and RajaramanOnline, KRBM (2020). Online RBM: growing restricted Boltzmann machine on the fly for unsupervised representation. Appl. Soft Comput. 92, 106278. doi:10.1016/j.asoc.2020.106278
Sdoukopoulos, A., Pitsiava-Latinopoulou, M., Basbas, S., and Papaioannou, P. (2019). Measuring progress towards transport sustainability through indicators: analysis and metrics of the main indicator initiatives. Transp. Res. Part D Transp. Environ. 67, 316–333. doi:10.1016/j.trd.2018.11.020
Sun, P., Bisschop, R., Niu, H., and Huang, X. (2020). A review of battery fires in electric vehicles. Fire Technol. 56, 1361–1410. doi:10.1007/s10694-019-00944-3
Varga, B., Sagoian, A., and Mariasiu, F. (2019). Prediction of electric vehicle range: a comprehensive review of current issues and challenges. Energies 12, 946. doi:10.3390/en12050946
Vazifeh, M. M., Zhang, H., Santi, P., and Ratti, C. (2019). Optimizing the deployment of electric vehicle charging stations using pervasive mobility data. Transp. Res. Part A Policy Pract. 121, 75–91. doi:10.1016/j.tra.2019.01.002
Wang, G., Chao, Y., Cao, Y., Jiang, T., Han, W., and Chen, Z. (2022). A comprehensive review of research works based on evolutionary game theory for sustainable energy development. Energy Rep. 8, 114–136. doi:10.1016/j.egyr.2021.11.231
Wang, L., Wang, X., and Yang, W. (2020). Optimal design of electric vehicle battery recycling network – from the perspective of electric vehicle manufacturers. Appl. Energy 275, 115328. doi:10.1016/j.apenergy.2020.115328
Xing, J., Leard, B., and Li, S. (2021). What does an electric vehicle replace? J. Environ. Econ. Manag. 107, 102432. doi:10.1016/j.jeem.2021.102432
Yao, E., Liu, T., Lu, T., and Yang, Y. (2020). Optimization of electric vehicle scheduling with multiple vehicle types in public transport. Sustain. Cities Soc. 52, 101862. doi:10.1016/j.scs.2019.101862
Keywords: machine learning, recommendation systems, charging stations, electric vehicles, gray goose optimization, restricted Boltzmann machine
Citation: Alharbi AH, Khafaga DS, El-kenawy E-SM, Eid MM, Ibrahim A, Abualigah L, Khodadadi N and Abdelhamid AA (2024) Optimizing electric vehicle paths to charging stations using parallel greylag goose algorithm and Restricted Boltzmann Machines. Front. Energy Res. 12:1401330. doi: 10.3389/fenrg.2024.1401330
Received: 15 March 2024; Accepted: 30 May 2024;
Published: 11 July 2024.
Edited by:
Furkan Ahmad, Indian Institute of Technology Delhi, IndiaReviewed by:
Hossam Kotb, Alexandria University, EgyptShady H. E. Abdel Aleem, Science Valley Academy, Egypt
Copyright © 2024 Alharbi, Khafaga, El-kenawy, Eid, Ibrahim, Abualigah, Khodadadi and Abdelhamid. This is an open-access article distributed under the terms of the Creative Commons Attribution License (CC BY). The use, distribution or reproduction in other forums is permitted, provided the original author(s) and the copyright owner(s) are credited and that the original publication in this journal is cited, in accordance with accepted academic practice. No use, distribution or reproduction is permitted which does not comply with these terms.
*Correspondence: Abdelaziz A. Abdelhamid, QWJkZWxheml6QHN1LmVkdS5zYQ==; El-Sayed M. El-kenawy, c2tlbmF3eUBpZWVlLm9yZw==