 Wei Zhang
 Zhe Zhang1*
94% of researchers rate our articles as excellent or good
Learn more about the work of our research integrity team to safeguard the quality of each article we publish.
Find out more
ORIGINAL RESEARCH article
Front. Energy Res. , 13 September 2024
Sec. Process and Energy Systems Engineering
Volume 12 - 2024 | https://doi.org/10.3389/fenrg.2024.1396074
This article is part of the Research Topic Smart Robust Operation and Trading of Integrated Energy Systems with Low Pollution Goals View all 25 articles
In the case of resistance-inductance lines in PV station area, the problem of voltage overstep is easy to occur. This article proposes a reactive power compensation control method to improve the voltage stability in the photovoltaic power plant area, which addresses the problem of voltage at the point of common coupling (PCC) exceeding the upper limit due to resistance circuits and exceeding the lower limit due to relatively insufficient reactive power output when the output active power is high. The idea is to achieve dynamic adjustment of PCC voltage by paralleling a static reactive power generator (SVG) at the grid connection point and using a variable droop control method. In addition, a reactive power optimization method based on improved particle swarm optimization (IPSO) algorithm is proposed to address the changes in power flow caused by photovoltaic integration in the distribution network system. The proposed improvement method not only effectively reduces network losses but also significantly improves voltage stability.
With the increasingly serious problems of energy shortage and environmental pollution, photovoltaic power generation has become a representative new energy generation technology. (Gunannan et al., 2016). Due to the uncertainty and intermittency of photovoltaic output, when photovoltaic is connected to the grid, it will have a certain impact on the power quality of the distribution network, such as voltage beyond limits, voltage imbalance, flicker, and harmonic overload. In the case of resistor-inductance circuits, the problem of voltage beyond limits is more serious. When the capacity of photovoltaic power supply is large, it may change the direction of the system’s power flow, which has a significant impact on the voltage deviation and network loss of the distribution network.
To maintain the voltage stability of the power grid, reactive power compensation devices are usually installed in renewable energy station. Traditional reactive power equipment mainly includes on load tap changer (OLTC), parallel capacitor (SC), parallel reactor (SR), and SVG. As the most widely used reactive power regulation device, SVG has advantages such as wide compensation space, fast response speed, and low harmonic content. In recent years, SVG has become the mainstream equipment for future reactive power compensation devices. (Woei-Luen et al., 2010). It is necessary to use SVG reasonably to improve the transmission stability and capacity of the new power system, avoid voltage fluctuations, which can also ensure low harmonic content, fast response speed, and high reliability in the output of PV station. (Ruiling et al., 2023).
The existing reactive power and voltage regulation strategies are mainly studied from two aspects. One is local voltage control, which only considers the impact of photovoltaic integration into the grid on the PCC voltage. The other, from a system perspective, aims at ensuring that the voltage deviation and network losses of each node in the distribution network are maintained within a reliable operating range.
For local control, Xiaohu et al. (2012), Young-Jin et al. (2013) propose a coordinated control method for active/reactive power, which adjusts the voltage by controlling the output power of the photovoltaic grid inverter. However, this method limits the capacity of photovoltaic power generation and reduce efficiency. Yan et al. (2017) proposes a method to compensate uncertain voltage fluctuations and maintain a safe voltage level under random load demands by changing the power of grid connected reactive power equipment and transformer joints. However, this method only focuses on voltage fluctuations at grid nodes and does not consider the impact of active power loss. Hiroo et al. (2012) uses a three-layer allocation strategy to coordinate the allocation of reactive power shortage in large photovoltaic power stations among SVG, photovoltaic power generation units, and photovoltaic inverters. This strategy adopts voltage reactive power sensitivity method to improve the accuracy of reactive power control in photovoltaic power stations. Huimin et al. (2022) presents a multi-layer coarse-to-fine grid searching approach for calibrating SVG dynamic model parameters using particle swarm optimization to address the known issues of low identification accuracy and long computation time faced by the traditional SVG parameter identification methods.
When considering the voltage of each node in the distribution network, Chao and Luis (2016) studies the combined effect of photovoltaic power sources and loads on the voltage fluctuations of each node. The result indicates that photovoltaic integration poses a risk of instability in node voltage. Puyu et al. (2022) study the impact of the PV location on the network power losses and voltage fluctuations under the premise of considering line impedance. A PSO algorithm is used to synthesize an optimal compromised solution so as to determine the PV location. Te-Tien et al. (2016) points out that the voltage of each node on the feeder line increases after the photovoltaic power sources connected, which is significantly different from the traditional trend of node voltage gradually decreasing from the first node to the end on the feeder line. Voltage sensitivity matrices are fundamental for the model-based control of the distribution networks. Maharjan et al. (2020) proposes an enhanced method, which comprises of analytical expressions for direct estimation of the voltage sensitivity to tap-position and active/reactive power injections for any strength of the external grid. A new virtual power/voltage sensitivity method is derived in Saurabh et al. (2019), Wenshu et al. (2021), and based on this, an optimal constraint method for wind farm group voltage is proposed. In Mendoza et al. (2018), a new method for optimal reactive power planning considering photovoltaic output fluctuations is proposed to minimize the annual equivalent operating cost. The reactive power allocation of SVG is based on the cumulative probability curve of annual power fluctuations. In Chenyu et al. (2022), a reactive power compensation model that combined reactive power compensation devices as a regulation method to reduce system line loss and voltage deviation was proposed. In Yu and Shan (2015), parallel capacitors and SVG are set as controllable variables, and particle swarm optimization (PSO) using Latin hypercube sampling is explored to minimize the annual equivalent operating cost.
In summary, the above local voltage control methods mainly focus on the voltage exceeding the lower limit at PCC when the line impedance is inductive and neglects the adverse effects of resistance in low-voltage distribution lines. In addition, traditional particle swarm control cannot balance optimization speed and accuracy. During the iteration process, the inertia factor and learning factor should be reasonably configured with the number of iterations.
Therefore, this paper mainly focuses on solving the three problems brought about by photovoltaic grid connection: PV access point voltage exceeding limits, distribution network voltage deviation, and distribution network loss. Firstly, the resistance and inductance lines of photovoltaic power plants will cause the voltage the upper limit at PCC. And when the output active power is relatively high, the relatively insufficient reactive power will cause the voltage to exceed the lower limit at PCC. Therefore, the method of parallel connection of a static reactive power generator at PCC was adopted, and an improved reactive voltage droop control method was proposed. This method is simple to implement, greatly improves voltage stability. For distribution network voltage deviation and distribution network loss, an improved particle swarm optimization algorithm is proposed to ensure the minimum voltage deviation and network active power loss under photovoltaic integration. Figure 1 gives the research route.
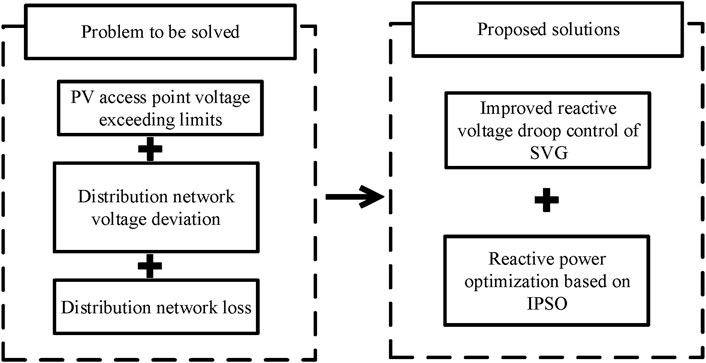
Figure 1. Research route.
Figure 2 is a structure chart of photovoltaic platform area, including PV inverter, AC bus, SVG, transmission line impedance Rs + jXs, load and grid. The photovoltaic inverter outlet is collected to the AC bus, and the AC bus is connected to the grid through the boost transformer and line impedance. The photovoltaic power generation cluster and the grid jointly supply power to the load. SVG is connected to the low voltage side of the transformer to compensate the reactive power and dynamically adjust the grid-connected voltage to improve static stability.
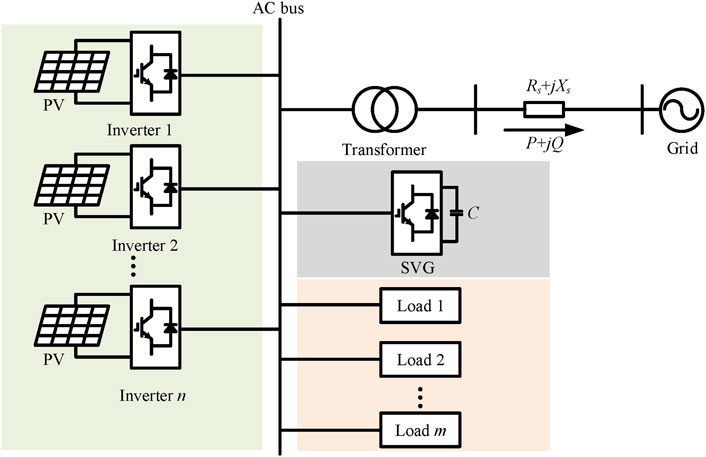
Figure 2. Structure chart of photovoltaic platform area.
SVG is essentially a grid following inverter that can achieve flexible reactive power compensation. It is possible to control reactive power by controlling the output current of SVG. The traditional control block diagram of SVG is shown in Figure 3.

Figure 3. Traditional control block diagram of SVG.
DC outer loop of SVG generates the d-axis reference current of inner loop through a PI controller after differential comparison between DC capacitor voltage and DC voltage reference value. The d-axis current reference can be obtained according to Equation 1.
where Udcref and Udc are the reference values of DC voltage and DC voltage respectively. kpv and kiv are proportional gain and integral gain of voltage regulator respectively.
The reactive power loop of SVG generates the q-axis reference current of the inner loop through a PI controller after comparing Qref and QSVG. The q-axis current reference can be obtained according to Equation 2.
where Qref and QSVG are the reactive power reference value and the reactive power provided by SVG respectively. kpq and kiq are the proportional gain and integral gain of the reactive power regulator respectively.
In the current inner loop, a PI controller is used to control the output reactive current of SVG. As shown in Figure 3, idref is the active current reference output by the DC outer loop, and iqref is the reactive current reference generated by the reactive outer loop. id and iq are the active and reactive components of the current output by SVG respectively. The ωL is decoupling of the current inner loop, ud and uq are voltage feedforward control to speed up the response, iCd and iCq are capacitive current proportional feedback to damp LCL resonance.
Figure 4 gives the photovoltaic grid connection diagram. The output active power and reactive power of the photovoltaic source are PPV and QPV, and the impedance value of transmission line is Rs + jXs.
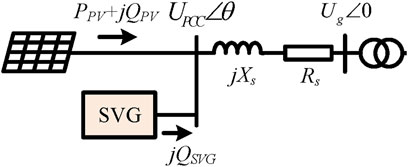
Figure 4. Photovoltaic grid connection diagram.
Phasor of grid voltage is
The complex power injected into the grid by the photovoltaic power station and SVG can be expressed as Equation 4.
Then, the PCC voltage can be derived as Equation 5.
where
The expression of the PCC voltage contains two different solutions according to Equations 5–6, a high voltage value and a low voltage value, corresponding to the stable and unstable points of the voltage respectively. When both the photovoltaic inverter and SVG do not emit reactive power, the above voltage expression can be simplified as
Figure 5 shows the relationship curve between photovoltaic output active power and PCC voltage. Equation. 7 corresponds to the situation Q = 0 in Figure 5A. When SVG provides reactive power output, P-U curve corresponds to the situation Q = −0.1p.u.and Q = 0.1p.u. which are also shown in Figure 5B. Due to line containing resistance and inductance, the voltage of PCC of rises first then decreases and finally reaches the critical stable point with the increase of active power. Therefore, if the reactive power capacity is insufficient, there is a risk of exceeding the lower voltage limit when the photovoltaic active power is large; The reactive power can support the voltage of PCC, but the fluctuation of output active power may cause the PCC voltage to exceed the upper limit.
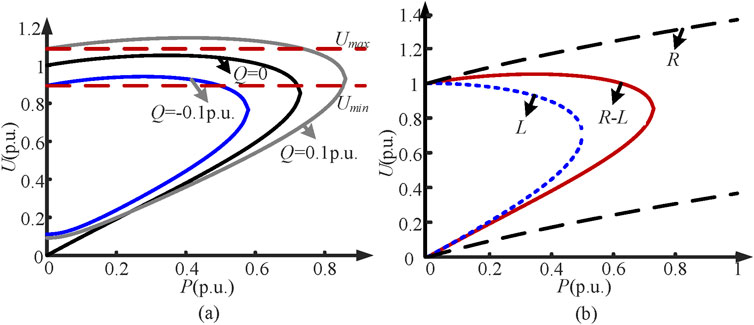
Figure 5. P-U curve of grid-connected point. (A) Different reactive power conditions. (B) Different line conditions.
P-U curves under different line impedances can also be obtained from the above formulas, as shown in Figure 5B. When the line is pure inductive, the voltage gradually decreases with the increase of the output active power. In this case, the problem of voltage beyond the lower limit caused by insufficient reactive power is more likely to occur. When the line is pure resistance, with the increase of output active power, the voltage gradually increases, in this case, the voltage will exceed the upper limit; When the line is resistance-inductance, both situations can occur.
Suppose that Uset is the target value of voltage, when the voltage exceeds the limit, SVG can adjust the voltage to the target value. When the photovoltaic inverter operates in unit power factor mode, the value of Uset is
According to the Equation 8, the reactive power required by SVG can be calculated as
From Equation 9, it can be seen that the SVG output reactive power QSVG is a function of PPV. The reactive power that SVG needs to emit can be obtained based on the active power output from the photovoltaic source. According to the above equation, a reactive power voltage droop control can be proposed, and the droop coefficient is set to a function of PPV, as shown in Figure 6. Then the droop coefficient multiplied by the difference between the Uref and Ud is reactive power reference of SVG. The droop coefficient of SVG can be derived as Equation 10.
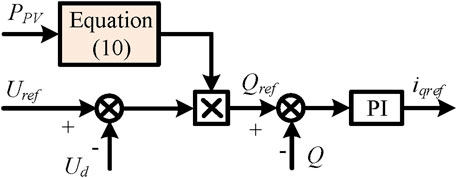
Figure 6. Variable droop coefficient control of SVG.
Figure 7 shows a diagram of photovoltaic connection to distribution network, assuming that the line has n nodes and PV is connected at k point. The following analysis will be conducted according to different situations.
A. Before photovoltaic connection
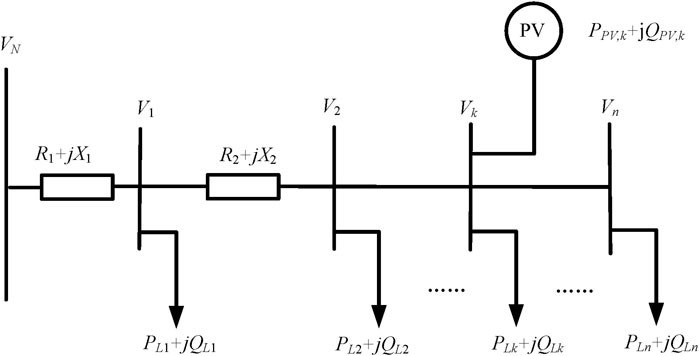
Figure 7. Diagram of photovoltaic connection to distribution network.
Before photovoltaic integration into the distribution network, the voltage Um at any point on the feeder line is
where PL,i is the active load at point i. Due to the majority of load power factor being above 0.9, when analysing the impact of active power, the reactive power of the load can be ignored first. Equation 11 can be transformed into
Due to the constant positive power consumption of the load, it can be seen from Equation 12 that Um is always less than UN. Therefore, the voltage always decreases from the beginning to the end of the feeder line.
B. After photovoltaic connection
Considering that photovoltaic inverters generally operate at a unit power factor when connected to the grid, Qpv is temporarily assumed to be 0. The node voltage Um at the front end of the photovoltaic connection point is
According to Equation 13, the voltage difference between the two points before the photovoltaic connection point can be expressed as
According to Equation 14, it can be concluded that:
When
When
As mentioned above, the output reactive power and load consumption reactive power of photovoltaic source will not be considered temporarily. The voltage Um at any point at the front end of the photovoltaic connection point is:
According to Equation 15, the voltage difference between the two points after the photovoltaic connection point is:
According to Equation 16, it can be concluded that due to the constant value of Um- Um-1 being less than 0, the voltage of the nodes at the back end of the photovoltaic connection point gradually decrease as the length of the feeder line.
C. Summary
By analysing the above derivation results, it can be seen that the voltage of the distribution network is related to the photovoltaic output power and load. Assuming that the system power supply voltage remains constant, as the photovoltaic output changes, the feeder voltage will have the following situations.
(1) When the photovoltaic output is low, the line voltage gradually decreases along the feeder line.
(2) As the photovoltaic output increases, the line voltage may show a trend of first decreasing, then increasing, and finally decreasing again.
(3) As the photovoltaic output exceeds the line load by a large amount, it may first increase and then decrease.
In cases (2) and (3) above, the photovoltaic connection point is the highest local voltage, and the voltage value can be expressed as Equation 17.
The widely used photovoltaic inverters currently have power scheduling functions, allowing them to operate at non unit power factors and send reactive power to regulate voltage. If only considering the reactive power output of the inverter, the impact on voltage can be expressed as:
According to Equation 18, when the inverter outputs inductive reactive power (with a specified direction of positive), the voltage can be reduced. When the inverter outputs capacitive reactive power (with a specified direction of negative), the voltage can be increased. In addition, the larger the reactive power output of distributed photovoltaic sources, the closer the installation position is to the end of the line, and the stronger the regulation effect on the feeder voltage. Photovoltaic integration has changed the original power flow of the distribution network and increased the risk of node voltage exceeding the limit.
The mathematical model of the reactive power optimization including photovoltaic power and SVG considering local control is expressed as follows.
A. The Objective Function
In this paper, the objective function of reactive power optimization is expressed as Equations 19–21.
Pl,total is the total active power loss; Vl,total is the accumulated voltage deviation;
B. The Equality Constraint of Power Flow
The power flow constraint condition is the power constraint balance equation for each node in the distribution network with photovoltaic power sources, which can be expressed as Equation 22.
PGi, QGi refer to the active and reactive power injected by node i. PDi, QDi refer to the active and reactive power of the load at node i; QCi represents the reactive power of compensation device for node i; N is the total number of distribution network nodes.
C. Node voltage constraint
In Equation 23, Vi,max, Vi,min are the upper and lower limits of the node voltage.
D. Reactive output constraint.
To prevent reactive power backflow caused by excessive reactive power compensation capacity, it is necessary to constrain the reactive power compensation capacity which can be expressed as Equation 24.
QCi,max, QCi,min refer to the upper and lower limits of reactive power compensation capacity.
The particle swarm optimizer (PSO) is a stochastic, population-based optimization technique that can be applied to a wide range of problems, including reactive power optimization. (Xiaofang et al., 2020). Reactive power optimization is a complex nonlinear optimization problem, which holds a large number of local minimum, multi discontinuous variables and constraints. On the premise of meeting all constraints, the reactive power optimization improves the quality of voltage, reduces the network loss of system operation and ensures stability of the system voltage, which are got by the existing optimization method to adjust controlled variables reasonable and utilize grid equipment resources. (Kennedy and Eberhart, 1995).
The speed and accuracy of particle iteration updates are directly affected by inertia weight factor and learning factor. Considering that standard particle swarm optimization algorithms cannot balance optimization speed and accuracy, it is necessary to improve the inertia weight coefficients and learning factors. Generally speaking, in the initial stage of algorithm iteration, it should meet the requirements of global search, and in the middle and later stages, it should meet the requirements of local optimization until it converges to the global optimal solution. The biggest problem with PSO is getting stuck in local optima. Therefore, improved PSO enhances the quality of the initialized population, and improving the search efficiency to enable the algorithm to escape local optima and seek global optimum solutions more effectively.
The probability density function of the standard normal distribution has good properties and can be used to improve the inertia factor and learning factor. The probability density function of the standard normal distribution can be expressed as Equation 25.
Based on the characteristics of the density function of a normal distribution, the probability of the numerical distribution in (u-3σ, u-3σ) is 0.9973. It can be considered that the values of x are almost entirely concentrated in (u-3σ, u-3σ). Therefore, the maximum number of iterations is applied to a normal distribution, which can be expressed as Equation 26.
According to a large number of experimental conclusions, the optimization effect of the algorithm is the best when w varies between 0.4 and 0.9. In addition, considering the possibility of the algorithm falling into local optima in the later stage, a random number part can be added to the formula, and the numerical characteristics of trigonometric functions can be used to limit the value of the random number to prevent the algorithm from converging. In summary, the improved inertia coefficient w can be expressed as Equation 27.
where, k is the number of iterations, kmax is the maximum number of iterations, and r is a random number in the range of [0,1].
The learning factor represents the self-learning and collective learning abilities of particles in the population. The learning factors c1 and c2 generally take values of 2. In order to ensure the efficiency of the algorithm, the learning factor can be obtained through Equation 28.
The range of values for learning factors c1 and c2 is [1,2], which is beneficial for global particle traversal in the early stage and convergence of the algorithm in the later stage.
Using the improved particle swarm optimization algorithm to solve the optimization model, the flowchart is shown in Figure 8.
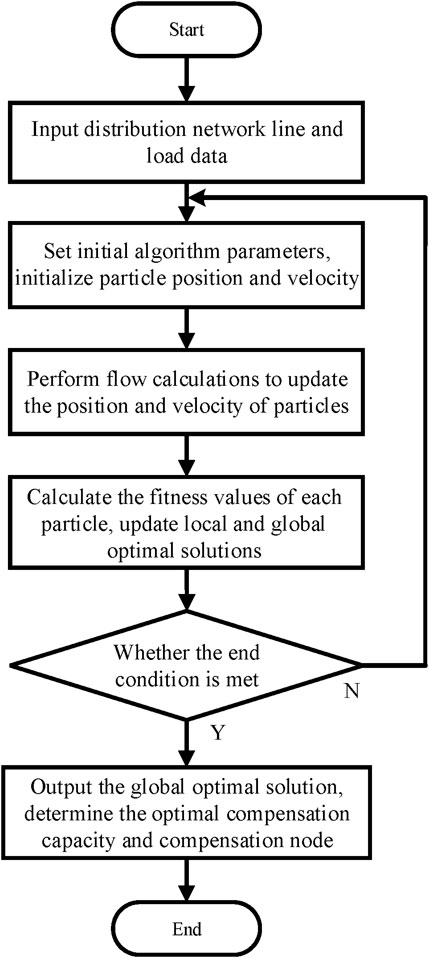
Figure 8. Particle swarm optimization algorithm flowchart.
In order to verify the effectiveness of the theoretical analysis and design mentioned above, a simulation model was built in the Matlab/Simulink environment for verification. First is the verification of local control. Figure 9 is structure of photovoltaic grid connected system, which includes DC side PV system, SVG, line impedance and grid. SVG is connected to the PCC. Figure 10 is control structure of SVG. It can be seen that the d-axis current reference is generated by DC voltage loop, and the q-axis current reference is generated by the variable droop coefficient control mentioned above. Under local control, SVG detects the voltage at the PCC to determine if the voltage is beyond the limit. When the voltage exceeds the limit, SVG adopts the reactive voltage droop control to output the corresponding reactive power and adjust voltage at the PCC. Set the upper and lower limits of voltage at 390 V and 375 V respectively, which satisfies the grid connection standards. The line impedance contains the resistive and inductive, and the voltage beyond limits occurs as the photovoltaic output active power increases. Add the control strategy of SVG mentioned above at 1 s, and the d-axis voltage reference value of SVG is set to 311 V, which corresponds to the rated voltage of 380 V. The simulation results are shown in the following figures. Figures 11, 12 show the waveform of the PCC voltage exceeding the upper and lower limits under the local control. It can be seen that the SVG adjusts the PCC voltage to set value at approximately 1.05 s. Figure 13 shows the line voltage at PCC, it can be seen that the addition of the above control enables SVG to quickly adjust the PCC voltage to 380 V.
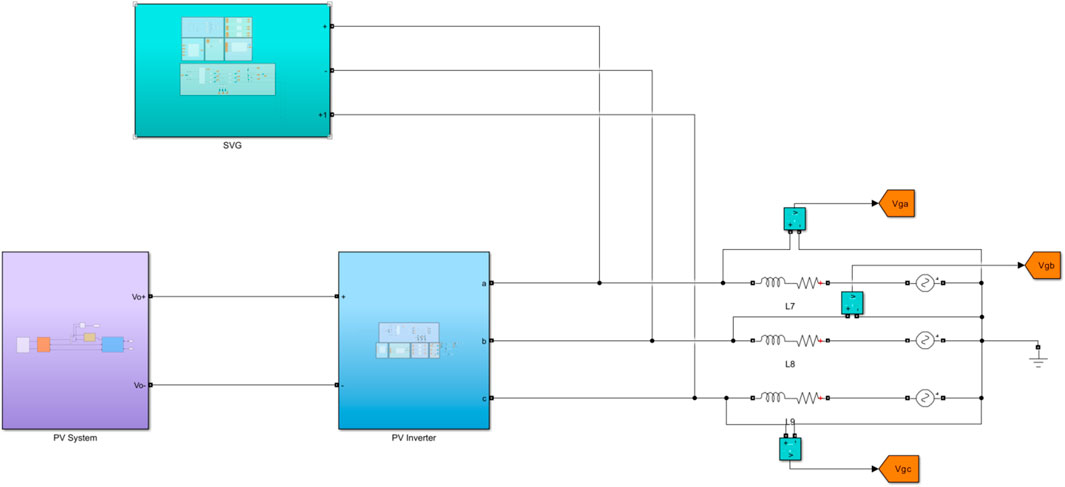
Figure 9. System structure.
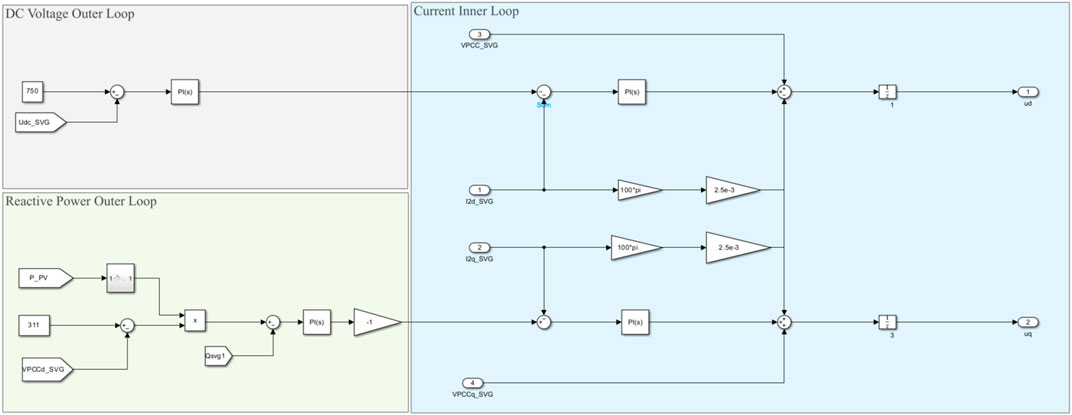
Figure 10. SVG control structure.
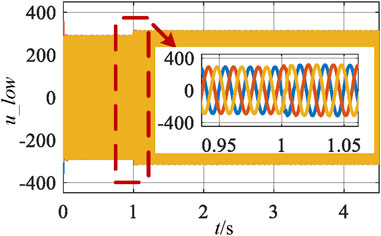
Figure 11. Voltage waveform exceeding the lower limit.
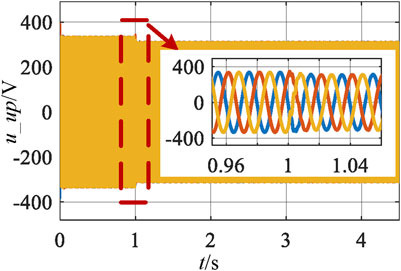
Figure 12. Voltage waveform exceeding the upper limit.
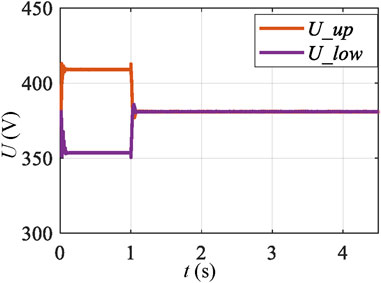
Figure 13. PCC voltage adjustment process for local control.
The next is verification of the reactive power optimization method based on improved particle swarm optimization. Taking a 33 node distribution network as an example, the photovoltaic system is connected to the 15th node. Through sensitivity analysis, SVG access points are selected as the 18th node and 33rd node. The simulation results for voltage deviation and power loss in the distribution network are shown as follows. The comparison of node voltages before and after optimization is shown in Figure 14. It can be seen that the average voltage of distribution network nodes is significantly improved and the voltage deviation is reduced after reactive power compensation. The comparison of network power loss before and after optimization is shown in Figure 15. It can be seen that the power loss of each node in the system has been reduced after optimization.
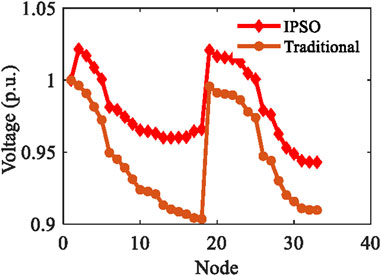
Figure 14. Node voltage variation diagram.
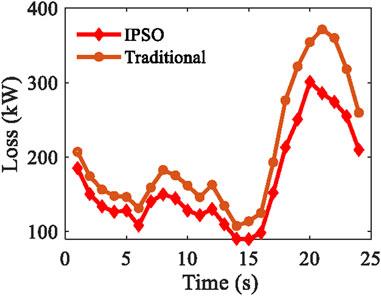
Figure 15. Network loss variation diagram.
This paper mainly conducts research from two aspects. First is the problem of exceeding the voltage limits of photovoltaic grid connection points under resistive and inductive lines. It is revealed that when the line is pure inductive, the voltage gradually decreases with the increase of the output active power, the problem of voltage beyond the lower limit caused by insufficient reactive power may occur. When the line is pure resistance, the voltage gradually increases with the increase of output active power, the voltage will exceed the upper limit problem; When the line is resistance-inductance, with the increase of the output active power, the PCC voltage increases first, and then decreases, finally reaches the critical stable point, in which case the voltage beyond the upper and lower limits may occur. In order to ensure the voltage stability of photovoltaic station area, a variable droop control method for SVG is proposed. The effectiveness of this method in regulating the voltage of photovoltaic grid connection points is verified through simulation.
Next is voltage deviation and network loss issues caused by photovoltaic integration into the distribution network. Photovoltaic integration has changed the power flow distribution of the distribution network, making voltage deviation related to photovoltaic injection power. When the output active power of photovoltaic source is large, it is not only possible to cause the voltage of photovoltaic grid connection to exceed the limits, but also increase the voltage deviation. At the same time, the active power loss of the distribution network also increases. To address these issues, this paper establishes a mathematical model for reactive power optimization with the objectives of minimizing active power loss and node voltage deviation in the distribution network. On this basis, an improved particle swarm optimization algorithm is proposed to optimize the scheduling of reactive power in distribution network. The validation is conducted using a 33 nodes distribution network as an example. The results show that the reactive power optimization method based on IPSO algorithm can effectively reduce voltage deviation and network loss, and improve voltage stability.
The original contributions presented in the study are included in the article/Supplementary material, further inquiries can be directed to the corresponding author.
WZ: Conceptualization, Methodology, Software, Writing–original draft. ZZ: Methodology, Writing–review and editing. YD: Conceptualization, Supervision, Writing–review and editing. CD: Funding acquisition, Methodology, Writing–review and editing. ZY: Methodology, Writing–review and editing. YH: Conceptualization, Supervision, Writing–review and editing.
The author(s) declare that financial support was received for the research, authorship, and/or publication of this article. This work is supported by the Institute of Economic and Technological Research of State Grid Changzhou Power Supply Company “Analysis and improvement of voltage stability in the distribution station area under large-scale photovoltaic connection,” grant number: SGJSCZ00KJJS2311040.
The authors thank the State Grid Changzhou Power Supply Company.
Authors WZ, ZZ, YD, CD, and ZY were employed by The State Grid Changzhou Power Supply Company.
The author declares that the research was conducted in the absence of any commercial or financial relationships that could be construed as a potential conflict of interest.
The authors declare that this study received funding from State Grid Changzhou Power Supply Company. The funder had the following involvement in the study: the study design and collection, analysis, interpretation of data.
All claims expressed in this article are solely those of the authors and do not necessarily represent those of their affiliated organizations, or those of the publisher, the editors and the reviewers. Any product that may be evaluated in this article, or claim that may be made by its manufacturer, is not guaranteed or endorsed by the publisher.
Chao, L., and Luis, F. O. (2016). Voltage control of PV-Rich LV networks OLTC-Fitted transformer and capacitor banks. IEEE Trans. Power Syst. 31 (5), 4016–4025. doi:10.1109/TPWRS.2015.2494627
Chenyu, X., Haoming, Li., Zhihao, Y., and Jian, W. (2022). “Optimal reactive power dispatch of distribution network considering voltage security. in 2022 IEEE symposium series on computational intelligence (SSCI), Singapore, Singapore, 04-07 December 2022, (IEEE), 4–7.
Gunannan, H., Qinxin, C., Chongqing, K., and Qing, X. (2016). Optimal offering strategy for concentrating solar power plants in joint energy, reserve and regulation markets. IEEE Trans. Sustain Energy 7 (3), 1245–1254. doi:10.1109/TSTE.2016.2533637
Hiroo, K., Takeshi, I., and Hiroaki, M. (2012) Verification test of grid stabilization and evaluation of PV module characteristics for large-scale PV generation system, in Telecommunications energy conference (INTELEC), Scottsdale, AZ, USA, 30 September 2012 - 04 October 2012, (IEEE), 1–6.
Huimin, G., Ruisheng, D., Zhuo, H., Yi, Z., Yanfang, M., and Wenbin, T. (2022). Parameter identification of SVG using multilayer coarse-to-fine grid searching and particle swarm optimization. IEEE Access 10, 77137–77146. doi:10.1109/ACCESS.2022.3192538
Kennedy, J., and Eberhart, R. (1995) Particle swarm optimization, in Proceedings of ICNN’95 - International Conference on Neural Networks, Perth, WA, Australia, 27 November 1995 - 01 December 1995, (IEEE), 1942–1948.
Maharjan, S., Khambadkone, A., and Peng, J. (2020). Enhanced Z-bus method for analytical computation of voltage sensitivities in distribution networks. IET Gener. Transm. Distrib. 14 (16), 3187–3197. doi:10.1049/iet-gtd.2019.1602
Mendoza, E., Vacas, M., and Ferreira, R. (2018) Optimal capacitor allocation and sizing in distribution networks using particle swarm optimization algorithm, in 2018 workshop on communication networks and power systems (WCNPS), Brasília, Brazil, 07-09 November 2018, (IEEE), 7–9.
Puyu, W., Fangyu, L., Jinyuan, S., Xiaoping, Z., and Ling, G. (2022). Impact of the PV location in distribution networks on network power losses and voltage fluctuations with PSO analysis. CSEE J. Power Energy Syst. 8 (2), 523–534. doi:10.17775/CSEEJPES.2020.03030
Ruiling, H., Hongbing, W., and He, H. (2023) Overview of the application of SVG in new power systems, in 2023 IEEE 7th Information Technology and Mechatronics Engineering Conference ITOEC, Chongqing, China (IEEE), 15–17.
Saurabh, R., Rajive, T., Niazi, K. R., and Bansal, R. C. (2019). Optimal coordinated control of OLTCs using Taguchi method to enhance voltage stability of power systems. Energy Procedia 158, 3957–3963. doi:10.1016/j.egypro.2019.01.846
Te-Tien, K., Chia-Hung, L., Chao-Shun, C., Cheng-Ting, H., Wei-Lin, H., and Shih-Chieh, H. (2016). Coordination of PV inverters to mitigate voltage violation for load transfer between distribution feeders with high penetration of PV installation. IEEE Trans. Ind. Appl. 52 (2), 1167–1174. doi:10.1109/TIA.2015.2491268
Wenshu, J., Jian, C., Qiuwei, W., Canbing, L., Bin, Z., and Sheng, H. (2021). Distributed coordinated voltage control for distribution networks with DG and OLTC based on MPC and gradient projection. IEEE Trans. Power Syst. 37 (1), 680–690. doi:10.1109/TPWRS.2021.3095523
Woei-Luen, C., Wei-Gang, L., and Hrong-Sheng, G. (2010). Design of a mode decoupling STATCOM for voltage control of wind-driven induction generator systems. IEEE Trans. Power Deliv. 25 (3), 1758–1767. doi:10.1109/TPWRD.2009.2035915
Xiaofang, S., Yong, Z., Yinan, G., Xiaoyan, S., and Yongli, L. (2020). Variable-size cooperative coevolutionary particle swarm optimization for feature selection on high-dimensional data. IEEE Trans. Evol. Comput. 24 (5), 882–895. doi:10.1109/TEVC.2020.2968743
Xiaohu, L., Andreas, A., Liming, L., and Hui, L. (2012). Coordinated control of distributed energy storage system with tap changer transformers for voltage rise mitigation under high photovoltaic penetration. IEEE Trans. Smart Grid 3 (2), 897–906. doi:10.1109/TSG.2011.2177501
Yan, X., Zhaoyang, D., Rui, Z., and David J, H. (2017). Multi-timescale coordinated voltage/var control of high renewable-penetrated distribution systems. IEEE Trans. Power Syst. 32 (6), 4398–4408. doi:10.1109/tpwrs.2017.2669343
Young-Jin, K., Seon-Ju, A., Pyeong-Ik, H., Gi-Chan, P., and Seung-Il, M. (2013). Coordinated control of a DG and voltage control devices using a dynamic programming algorithm. IEEE Trans. Power Syst. 28 (1), 42–51. doi:10.1109/TPWRS.2012.2188819
Yu, L., and Shan, G. (2015). Reactive power planning with large-scale PV generation systems considering power fluctuation. in IEEE Power & Energy Society General Meeting, Denver, CO, USA, 26-30 July 2015 (IEEE), 1–5.
Keywords: distributed network, droop control, particle swarm optimization, photovoltaic generation, reactive power compensation, voltage beyond limits
Citation: Zhang W, Zhang Z, Dai Y, Dong C, Yu Z and Hu Y (2024) Research on reactive power compensation control method for improving the voltage stability of photovoltaic station area. Front. Energy Res. 12:1396074. doi: 10.3389/fenrg.2024.1396074
Received: 05 March 2024; Accepted: 10 June 2024;
Published: 13 September 2024.
Edited by:
Shiwei Xie, Fuzhou University, ChinaReviewed by:
Srete Nikolovski, Josip Juraj Strossmayer University of Osijek, CroatiaCopyright © 2024 Zhang, Zhang, Dai, Dong, Yu and Hu. This is an open-access article distributed under the terms of the Creative Commons Attribution License (CC BY). The use, distribution or reproduction in other forums is permitted, provided the original author(s) and the copyright owner(s) are credited and that the original publication in this journal is cited, in accordance with accepted academic practice. No use, distribution or reproduction is permitted which does not comply with these terms.
*Correspondence: Zhe Zhang, MTU2MDg3NzE5QHFxLmNvbQ==
Disclaimer: All claims expressed in this article are solely those of the authors and do not necessarily represent those of their affiliated organizations, or those of the publisher, the editors and the reviewers. Any product that may be evaluated in this article or claim that may be made by its manufacturer is not guaranteed or endorsed by the publisher.
Research integrity at Frontiers
Learn more about the work of our research integrity team to safeguard the quality of each article we publish.