 Xu Duoting
 Wei Xiaoyan
- China Nuclear Power Technology Research Institute Co., Ltd., Shenzhen, China
Corrosion resistance is the critical in-pile property for developing new Zircaloy cladding. As a new Zircaloy developed by China General Nuclear Power Corporation, CZ will be used as fuel rod cladding. This study is devoted to investigating the corrosion behavior of CZ. A two-stage Arrhenius equation is proposed to model the corrosion rate. A total of 1,510 measurement data points taken from 151 fuel rods irradiated for 1–4 cycles were used to develop the corrosion model. The burnup of these fuel rods ranges from 13.7 MWd/kgU to 55.9 MWd/kgU. The mean value and standard deviation of P−M (predicted value minus measured value) are 0.54 and 3.65 microns, respectively, and the mean value and standard deviation of P/M (predicted value divided by measured value) are 1.09 and 0.34 microns, respectively. P−M and P/M increase with the local burnup. When the burnup is greater than 40 MWd/kgU, the mean values of P−M and P/M are 6.2 and 1.20 microns, respectively; on the other hand, the prediction of the proposed model is more conservative in high burnup. In the typical case in which the average burnup reaches 57 MWd/kgU, the oxide thickness of CZ cladding is much less than 30 microns, whereas the oxide thickness of Zr-4 cladding is approximately 80 microns, and this manifests that CZ cladding possesses excellent performance in corrosion resistance.
1 Introduction
Fuel rod cladding is the first safety barrier in a nuclear reactor. Its integrity profoundly impacts the safety, reliability, and economy of a nuclear power plant (NPP). When the NPP is under normal operation, the cladding is exposed to high temperature, high pressure, and intense neutron irradiation. Under extreme conditions, the zirconium alloy cladding will undergo corrosion and form an oxide film on the outer surface. The corrosion behavior will result in a thinning of the cladding metal layer and a deterioration of heat transfer. Hence, the corrosion-resistance behavior defines an important criterion for the design of fuel rods.
Cladding corrosion is a kinetic process in which the zirconium of the cladding reacts with the coolant water and produces hydrogen and zirconia. Under the normal operation of an NPP, corrosion is usually characterized by a two-phase process (MacDonald and Thompson, 1976; Garzarolli et al., 1982; Massih and Vesterlund, 1992; Polley and Evans, 1993; Lee et al., 2008; Geelhood et al., 2011). During the first phase, the metal layer of the cladding is covered with a dense oxide film. The reaction is controlled by the diffusion of anion species through the oxide. The kinetics of the oxidation can be described by a parabolic or cubic Arrhenius relationship. The mismatch between the oxide and metallic layers results in tensile stress within the cladding, and when the oxide layer breaks, the corrosion enters the second phase. The whole oxide layer now consists of a dense inner layer and a cracked outer layer through which the oxidizing species migrate toward the metal layer. In this phase, the thickness of the oxide layer increases linearly with time (Forsberg et al., 1995; Lee et al., 2008). The transition from the first phase to the second phase usually occurs at a thickness of 2–6 microns (Garzarolli et al., 2012).
CZ is a new zirconium alloy (Xu et al., 2017; Shi et al., 2018; Xin et al., 2020) developed by China General Nuclear Power Corporation (CGN). Its elemental composition is shown in Table 1 (Xin et al., 2020). Used in the pilot fuel rods and the pilot fuel assemblies, CZ cladding has undergone multiple cycles of irradiation in commercial nuclear reactors, and the maximum burnup of the fuel rod has reached 55 MWd/kgU. During every cycle of irradiation, a pool examination of the CZ fuel rods was carried out, and the thickness of the oxide film was measured. In this research, the process of CZ in-pile corrosion modeling, along with measurement information on cladding oxide film, will be presented.

Table 1. Elemental composition of CZ cladding.
Investigation and prediction of the in-pile corrosion behavior are essential prerequisites for evaluating the fuel rod performance. The present study first presents the in situ measurement of the thickness of the oxide layer of CZ cladding in Section 2 and proposes a kinetics model for predicting the thickness of the oxide layer in Section 3, followed by the evaluation of the established model in Section 4. A short summary is presented in Section 5.
2 Measurement of cladding oxide thickness
After every cycle of irradiation, the oxide thickness of the CZ fuel rods in the spent fuel pool was measured using the SICOM-COR system (developed by ENUSA and TECNATOM, Figure 1). The SICOM-COR system makes use of the eddy current signal to measure the oxide thickness, and the resolution is 5 microns. During the measurement process, the probe moves from the bottom to the top of the fuel rod, and the axial distribution of the oxide thickness is recorded (Figure 2). The thickness is zero at the grid zone.
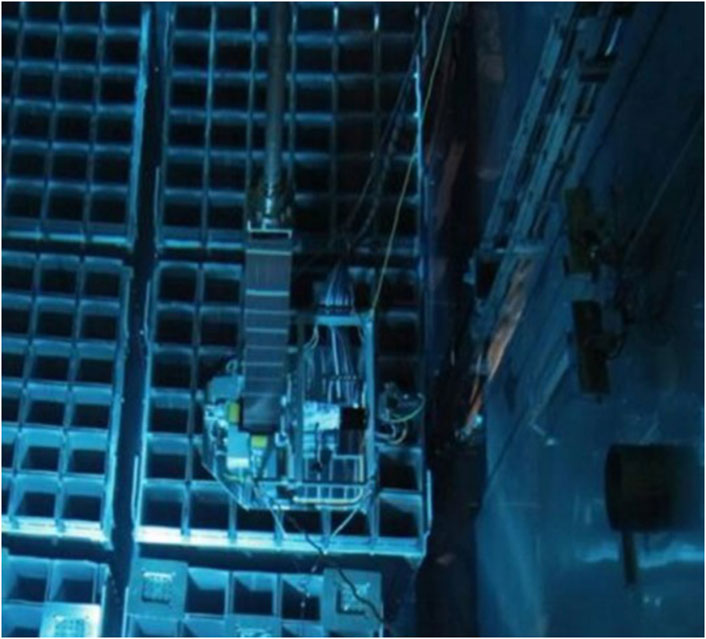
Figure 1. Photo of the SICOM-COR device.
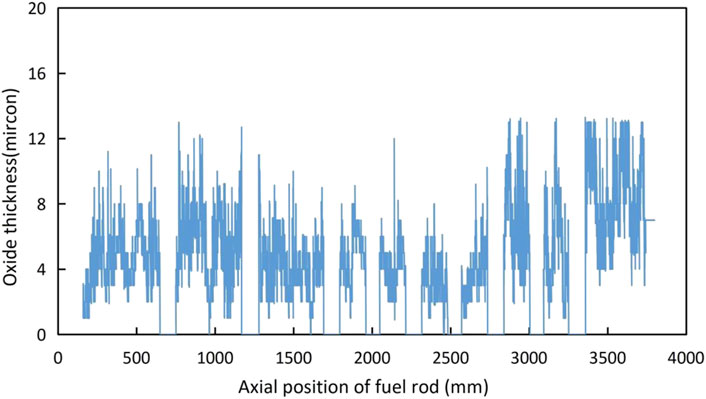
Figure 2. Axial distribution of oxide thickness of CZ cladding.
As the corrosion model is required to be integrated into the fuel rod performance analysis code to predict cladding corrosion performance, and the fuel rod will be divided into several axial segments in the code, the oxide thickness of every axial segment must be known. The oxide thickness of every axial segment equals the average value of all oxide thicknesses in the axial segment zone.
3 Kinetics and model of corrosion
In Pressurized Water Reactor (PWR), zirconium reacts with water (or steam) and yields oxide and hydrogen:
The reaction rate is influenced by several factors, such as the temperature, heat flux, neutron irradiation, and chemical composition of the coolant. Plenty of studies (International Atomic Energy Agency, 1993; Abram, 1994; Billot et al., 1994; Cheng et al., 1996; Abe and Takeda, 2006; Bouineau et al., 2008; Bailly-Salins et al., 2021) have been conducted to develop models for describing and predicting the oxidation process. The models can be generally classified as mechanisms and empirical models. The former type of models, such as the expanded C4 (coupled-current charge compensation) model (Bailly-Salins et al., 2021), usually include mesoscopic and microscopic parameters to describe the oxidation process. Considering the evolution of these parameters is difficult to predict under complex conditions, these mechanism-based models find limited applications in engineering. The empirical models are usually simpler in mathematical expressions and thus can be easily integrated into fuel rod performance analysis codes. The typical empirical models such as MATPRO (MacDonald and Thompson, 1976), EPRI (Garzarolli et al., 1982), FRAPCON (Geelhood et al., 2011), ABB Atom (Massih and Vesterlund, 1992), and ZRIC models (Polley and Evans, 1993) are all expressed by the two-phase Arrhenius equation.
The same two-phase Arrhenius equation, as shown in Eq. 2, is also adopted to develop the CZ corrosion model, which will be integrated into the fuel rod analysis code JASMINE (Jin et al., 2016).
where S denotes the oxide thickness and Sc denotes the transition oxide thickness. t is the time, and T is the temperature at the interface between the metal and oxide layers. Cpre and Cpost are empirical coefficients. Qpre and Qpost are activation energies.
3.1 Introduction of input data
Because the corrosion measurement is done after the end of every cycle, the measurement data represent the cladding corrosion for a long period. In order to predict the cladding corrosion according to Eq. 2, the history of the oxide surface temperature and cladding surface heat flux must be known. The form of the input data is as follows:
Si: the ith measurement data [i = 1,2,3 … n].
Ti,j: the history of oxide surface temperature on the ith measurement data [j = 1,2,3 … ]
Qi,j: the history of cladding surface heat flux on the ith measurement data [j = 1,2,3 … ]
ti,j: the irradiation history on the ith measurement data [j = 1,2,3 … ]
Every measurement data point possesses corresponding Ti,j, Qi,j, and ti,j, which are calculated by the fuel rod performance analysis code JASMINE.
3.2 Modeling procedure
The five undetermined constants in Eq. 2 need to be determined based on the measurement data. The determined principle is minimizing the sum of squared differences between prediction and measurement, as shown in Eq. 3.
where
The development of the cladding corrosion model is mathematically a nonlinear least-squares problem. The procedure of solving the nonlinear least-squares problem includes three steps.
Step 1: Initial variable guess: The initial values of the undetermined constants are determined based on the form of the equation and the data.
Step 2: Forward solving: The prediction is calculated based on the iteration values of the undetermined constants and the equation. In this paper, the prediction is oxide thickness.
Step 3: Converse solution: The following iteration values of the undetermined constants are calculated based on the differences between prediction and measurement data.
If the prediction differences or the undetermined constants between two adjacent iteration steps satisfy the convergence condition, the calculation will end; otherwise, repeat steps 2 and 3.
3.3 Initial variable guess
According to the fact that the corrosion of the second phase takes up a large proportion of whole corrosion, the initial values of Cpost and Qpost will be first calculated. Two assumptions are adopted for calculating the initial values of Cpost and Qpost. The first assumption is that the second phase is only considered; the second assumption is that the metal/oxide temperature is constant and equals the average value of metal/oxide temperature in the irradiation history. By integrating Eq. 2, we obtain the following equation:
In Eqs 5–7, M is the number of measurement data points,
where Ti,avg is the cladding surface average temperature of the ith measurement data, Qi,avg is the cladding surface heat flux of the ith measurement data, and kZrO2 is the thermal conductivity of zirconia.
The linear least-squares method is adopted to calculate the initial values of Cpost and Qpost.
Let x1 = ln (Cpost) and x2 = Qpost, then the solution of Eq. 7 is
The calculated Cpost and Qpost are then substituted into Eq. 2, and the same method is adopted to calculate Cpre, Qpre, and Sc.
3.4 Forward solving
According to the iteration values of five undetermined constants, the forward Euler method is adopted to solve Eq. 2. An adaptive method is applied for time step division. The initial time step is 70 h, and the time step will be halved until the oxide thickness increment in the time step is less than 1 micron. Because of the adaptive method, the time steps for calculating the oxide thickness are not identical to the time steps of the measurement data. Instead, the linear interpolation method is applied to calculate cladding surface heat flux and temperature in time steps for calculating the oxide thickness.
where
3.5 Converse solution
The Gauss–Newton method is used to calculate the following iteration values of the undetermined constants. ti, j, Qi, j, and Ti, j, respectively, represent time series, the history of cladding surface heat flux, and temperature on the ith measurement data.
The whole procedure of converse solution is as follows.
Step 1: Solving JTJdk = −JT r (xk) to calculate dk. J is the Jacobian matrix of the residual matrix r(x).
Step 2: xk+1 = xk + dk and k = k + 1.
Step 3: If the convergence condition is satisfied, end the calculation; otherwise, go to Step 1.
The two convergence conditions are standard termination and model constant termination, and meeting with one convergence condition means the convergence. For standard termination, the relative difference in oxide prediction between the adjacent iterations is less than ε. For model constant termination, the relative difference in model constant between the adjacent iterations is less than η. The default values of ε and η are, respectively, 1 × 10⁻⁶ and 1 × 10⁻³.
3.6 Algorithm test
The algorithm for corrosion model development is given in the above section. It is necessary to conduct the algorithm test in order to ensure its stability, correctness, and convergence. Eq. 16, which is a Zircaloy corrosion model, is adopted to produce the oxide thickness as the test data. A random disturbance will be added to the test data to simulate the measurement error. There are three examples in the test, which are, respectively, the non-disturbance example, 5-micron-disturbance example, and 10-micron-disturbance example. The objective of the non-disturbance example is to test the algorithm’s performance in the ideal condition, and the objective of the disturbance example is to test its performance in the actual condition.
The results of the three examples are shown in Figure 3 and Table 2. According to the results, the following conclusions can be drawn:
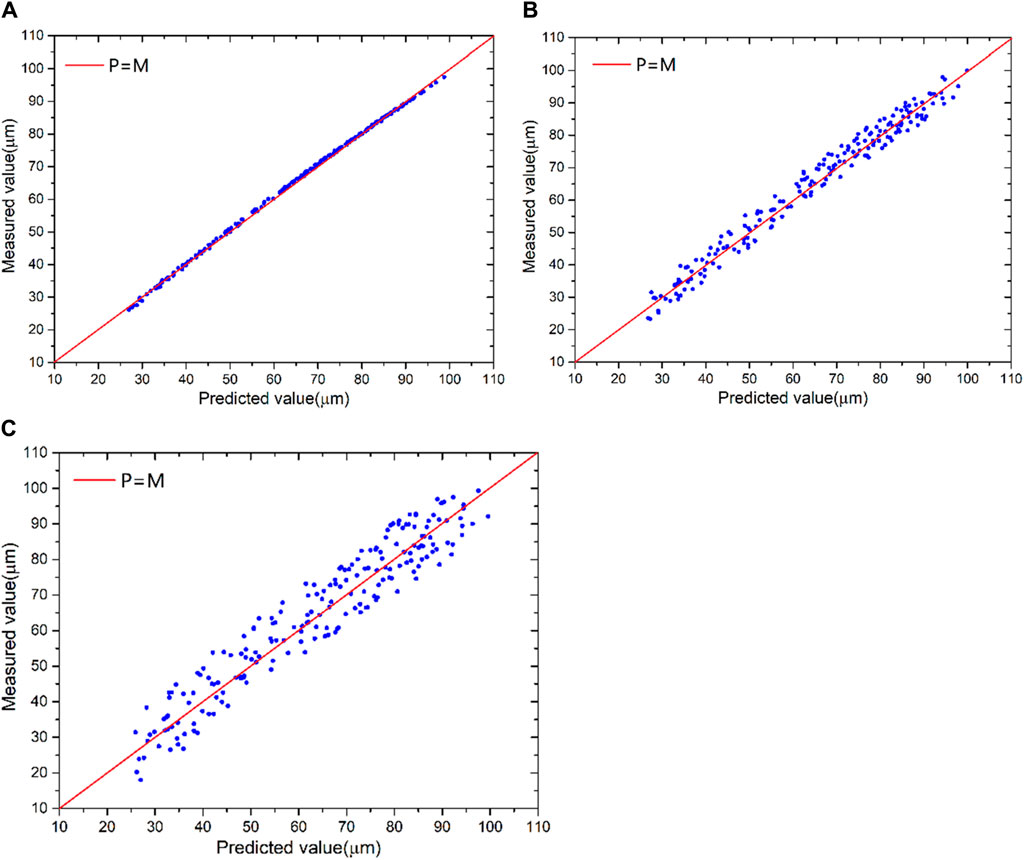
Figure 3. Results of three examples in the algorithm test: (A) non-disturbance example, (B) 5-micron disturbance example, and (C) 10-microns disturbance example.
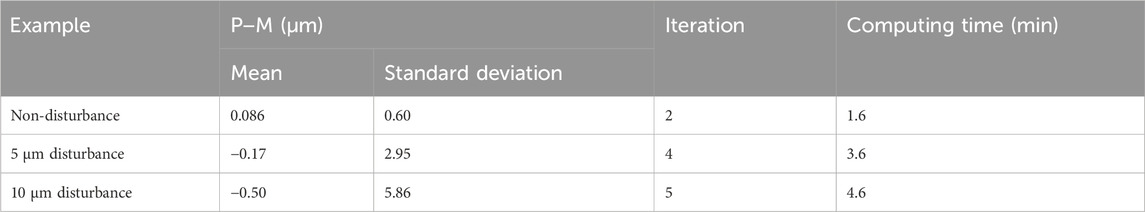
Table 2. Statistical results of three examples.
First: The precision of the algorithm is high, and its stability is excellent. For the non-disturbance example, the difference between the prediction value (P) and measurement value (M) is close to zero; for the two disturbance examples, the average values of P−M are less than 0.51 microns, and the standard deviation of P−M is 0.6 times the disturbance.
Second: The convergence rate of the algorithm is faster. After less than 5 iterations, the calculation reaches convergence for three examples, and the computing time is less than 5 min.
4 Modeling and discussion
The nonlinear regression method is used to determine the unknown parameters in Eq. 2. A total of 1,510 measurement data points are used, and they are taken from 151 fuel rods irradiated for 1–4 cycles in the Ling Ao NPP. The average burnup of the fuel rods ranges from 13.7 MWd/kgU to 55.9 MWd/kgU. The best-fitting model is shown in Eq. 17:
The comparison between the measurement and the best-fitting result is shown in Figure 4, and the mean value of P−M is 0.54 microns. The standard deviation of P−M is shown in Table 3, which means that the predicted value of the CZ corrosion model is more concentrated than the corrosion models of Zr-2, Zr-4, ZIRLO, and M5 in the FRAPCON code. Figure 5 indicates that P−M generally increases with the local burnup. When the burnup is greater than 40 MWd/kgU, the model overestimates the oxide thickness, and the mean value of P−M is approximately 6.2 microns, which means that the CZ model prediction is much more conservative in high burnup.
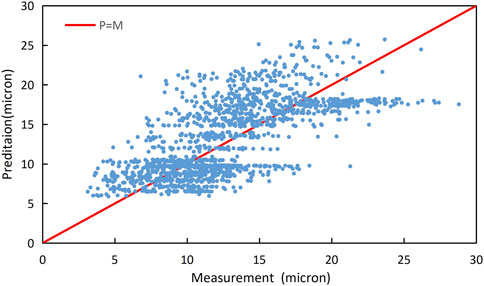
Figure 4. Comparison between the measurement and prediction.
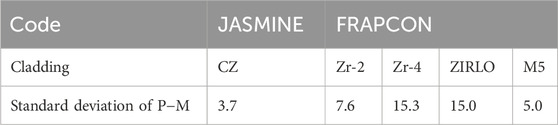
Table 3. Standard deviation of P−M (microns).
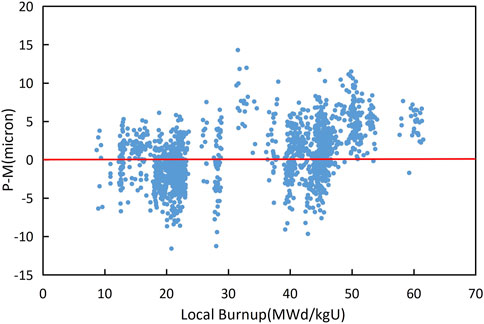
Figure 5. Variation of P−M with the local burnup.
The mean value and standard deviation of P/M are 1.09 and 0.34 microns, respectively. This means that the prediction of the corrosion model is slightly larger than the measurement. According to Figure 6, P/M generally increases with the local burnup. When the burnup is greater than 40 MWd/kgU, the mean value of P/M is 1.20 microns.
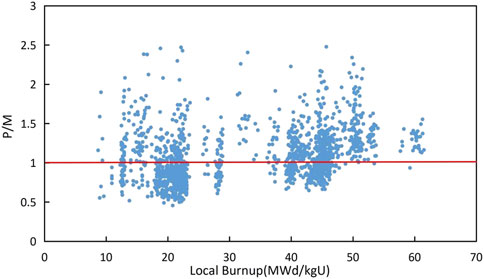
Figure 6. Variation of P/M with the local burnup.
The predicted thicknesses of CZ cladding and Zr-4 cladding are compared in Figure 7. The results of Zr-4 cladding are generated using the FRAPCON 4.0 code (Geelhood and Luscher, 2015). It is seen that the oxide thickness of Zr-4 cladding is slightly smaller than that of CZ below 20 MWd/kgU. However, the oxide thickness of Zr-4 cladding quickly increases when the burnup is greater than 20 MWd/kgU. After the burnup, the growth rate of the oxide thickness of CZ cladding is much lower than that of Zr-4 cladding. When the burnup reaches 57 MWd/kgU, the oxide thickness of CZ cladding is less than 30 microns, while the oxide thickness of Zr-4 cladding is approximately 80 microns.
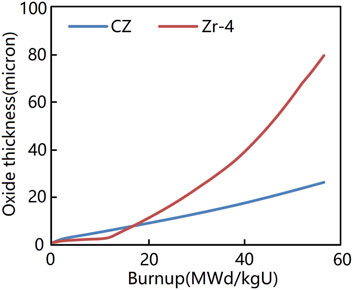
Figure 7. Comparison between the predicted oxide thickness of CZ cladding and Zr-4 cladding.
5 Summary
Taken from 151 fuel rods irradiated for 1 to 4 cycles, 1,510 measurement data points of the oxide thickness of CZ cladding are used to develop an empirical model. The burnup of these fuel rods ranges from 13.7 MWd/kgU to 55.9 MWd/kgU. The mean value and standard deviation of P−M are 0.54 and 3.65 microns, respectively, and the mean value and standard deviation of P/M are 1.09 and 0.34 microns, respectively; both P−M and P/M increase with the local burnup, which indicates that the prediction of the model is slightly larger than the measurement. When the burnup is greater than 40 MWd/kgU, the mean values of P−M and P/M are 6.2 and 1.20 microns, respectively, and the prediction is more conservative at high burnup. The predicted oxide thickness shows that CZ cladding possesses better performance in corrosion resistance than Zr-4 cladding does.
Data availability statement
The raw data supporting the conclusion of this article will be made available by the authors, without undue reservation.
Author contributions
XD: investigation, software, and writing–original draft. WX: formal analysis, validation, and writing–review and editing. XL: resources and writing–review and editing. XJ: conceptualization, project administration, and writing–review and editing. TW: methodology and writing–review and editing.
Funding
The authors declare that financial support was received for the research, authorship, and/or publication of this article. This work was financially supported by the “13th Five-year Plan,” Shenzhen Science and Technology Research and Development Fund (JSGG20210629144537005).
Conflict of interest
Authors XD, WX, LX, JX, and WT were employed by the company China Nuclear Power Technology Research Institute Co., Ltd.
Publisher’s note
All claims expressed in this article are solely those of the authors and do not necessarily represent those of their affiliated organizations, or those of the publisher, the editors, and the reviewers. Any product that may be evaluated in this article, or claim that may be made by its manufacturer, is not guaranteed or endorsed by the publisher.
References
Abe, H., and Takeda, K. (2006). Development of advanced Zr alloy cladding tube(S2) for PWR. Annu. Meet. AESJ Private Inf.
Abram, T. J. (1994) Modelling the waterside corrosion of PWR fuel rods. IAEA Technical Committee Meeting on Water Reactor Fuel Element Modelling at High Burnup.
Bailly-Salins, L., Borrel, L., Jiang, W., Spencer, B. W., Shirvan, K., and Couet, A. (2021). Modeling of high-temperature corrosion of Zirconium alloys using the extended finite element method (X-FEM). Corros. Sci. 189 (0), 109603. doi:10.1016/j.corsci.2021.109603
Billot, P., Robin, J.-C., Giordano, A., Peybernes, J., and Thomazet, J. (1994) Experimental and theoretical studies of parameters that influence corrosion of Zircaloy-4. West Conshohocken, PA: ASTM STP, 1295.
Bouineau, V., Ambard, A., Bénier, G., Pêcheur, D., Godlewski, J., Fayrtte, L., et al. (2008). A new model to predict the oxidation kinetics of Zr alloys in Pressurized water reactor. J. ASTM Int. 5 (5), 101312–101334.
Cheng, B., Gilmore, P. M., and Klepfer, H. H. (1996) “PWR zircaloy fuel cladding corrosion performance,” in mechanisms, and modeling. West Conshohocken, PA: ASTM STP, 137–160.
Forsberg, K., Limback, M., and Massih, A. R. (1995). A model for uniform Zircaloy clad corrosion in pressurized water reactors. Nucl. Eng. Des. 2 (154), 157–168. doi:10.1016/0029-5493(94)00915-l
Garzarolli, F., Jung, W., Shoenfeld, H., Garde, A. M., Parray, G. W., and Smerd, P. G. (1982) Waterside corrosion of zircaloy fuel rods. EPRI-NP-2789.
Geelhood, K. J., and Luscher, W. G. (2015). FRAPCON-4.0: integral assessment. PNNL-19418, VOl.2 Rev. 2, 81.
Geelhood, K. J., Luscher, W. G., and Beyer, C. E. (2011) FRAPCON-3.4: a computer code for the calculation of steady-state thermal-mechanical behavior of oxide fuel rods for high burnup. NUREG/CR-7022.
International Atomic Energy Agency (1993). Waterside corrosion of zirconium alloys. Nucl. power plants 684, 1–177.
Jin, X., Wei, X., Liu, X., and Deng, Y. (2016). JASMINE: a Fuel rod thermal-mechanical performance code. Top. Fuel, 601–608.
Lee, B.-Ho, Koo, Y.-H., Oh, J.-Y., and Sohn, D. S. (2008). Zircaloy-4 cladding corrosion model covering a wide range of PWR experiences. J. Nucl. Mater. 378, 127–133. doi:10.1016/j.jnucmat.2008.04.019
MacDonald, P. E., and Thompson, L. B. (1976) MATPRO: a handbook of materials properties for use in the analysis of light water reactor fuel rod behavior. TREE-NUREG-1180.
Massih, A. R., and Vesterlund, G. (1992). Developments in PWR cladding corrosion: materials and models. Nucl. Eng. Des. 137 (1), 57–63. doi:10.1016/0029-5493(92)90048-z
Polley, M. V., and Evans, H. E. (1993) A comparison of zircaloy oxide thicknesses on Millstone-3 and North Anna-1 PWR fuel cladding. EPRI-TR-102826.
Shi, L., Chen, L., Xu, Y., Gao, C., Tan, J., and Deng, Y. (2018). Effect of final annealing temperature on axial creep property of CZ alloys. ICNONE26. doi:10.1115/icone26-81540
Xin, J., Lin, Y., and Zhang, L. (2020). Thermal creep behavior of CZ cladding under biaxial stress state. Nucl. Eng. Des. 52, 2901–2909. doi:10.1016/j.net.2020.05.026
Keywords: CZ, cladding, corrosion, Arrhenius equation, Gauss–Newton method
Citation: Duoting X, Xiaoyan W, Xiaohan L, Xin J and Tao W (2024) A corrosion model for CZ cladding based on in-pile irradiation data. Front. Energy Res. 12:1395354. doi: 10.3389/fenrg.2024.1395354
Received: 03 March 2024; Accepted: 06 May 2024;
Published: 23 May 2024.
Edited by:
Turgay Korkut, Sinop University, TürkiyeReviewed by:
Zhang Chunyu, Sun Yat-sen University, ChinaEzekiel Villarreal, Sandia National Laboratories (DOE), United States
Copyright © 2024 Duoting, Xiaoyan, Xiaohan, Xin and Tao. This is an open-access article distributed under the terms of the Creative Commons Attribution License (CC BY). The use, distribution or reproduction in other forums is permitted, provided the original author(s) and the copyright owner(s) are credited and that the original publication in this journal is cited, in accordance with accepted academic practice. No use, distribution or reproduction is permitted which does not comply with these terms.
*Correspondence: Xu Duoting, eHVkdW90aW5nNDExNzY3NDMwQDE2My5jb20=