 Liangchang Fei
 Zhiqin Ma2
94% of researchers rate our articles as excellent or good
Learn more about the work of our research integrity team to safeguard the quality of each article we publish.
Find out more
ORIGINAL RESEARCH article
Front. Energy Res., 26 June 2024
Sec. Process and Energy Systems Engineering
Volume 12 - 2024 | https://doi.org/10.3389/fenrg.2024.1393436
The interturn short circuit fault is one of the common faults in power transformers. At present, research on interturn short circuit faults focuses on high, medium, and low voltage windings, while there is relatively little research on interturn short circuit in regulating windings. Specifically, there is a lack of reported studies on the transient electromagnetic processes, magnetic field distribution, and electromagnetic force characteristics of interturn short circuits in regulating windings unconnected to the circuit. This study presents an actual fault scenario involving interturn short circuits occurring in the untapped portion of the regulating windings of a specific power transformer. A field-circuit coupled model was established to analyze the transient electromagnetic processes during the fault, and the model’s effectiveness was validated by comparing its results with actual fault recording data. Additionally, the magnetic field distribution and electromagnetic force characteristics during the fault were analyzed, and discussions were carried out regarding various ratios of short-circuit turns in the regulating windings. The results indicate that even when an interturn short circuit occurs in the portion of the regulating winding that is not connected to the circuit, the current in the short-circuited turns can reach several tens of times the rated value. Additionally, the leakage magnetic field and the electromagnetic force experienced by the short-circuited ring also increase significantly. The short-circuit ratio has a significant impact on the current of the short-circuited ring, leakage magnetic field intensity, and electromagnetic force. This study contributes to a better understanding of the impact of interturn short-circuit faults in the untapped portion of the regulating windings, offering crucial technical support for fault diagnosis and prevention of power transformers.
The power transformer, as a crucial equipment within the power system, plays a pivotal role in ensuring system stability and reliable power supply. The malfunction of a power transformer has the potential to cause equipment damage as well as power supply interruptions, thereby yielding adverse impacts on the entire power distribution system (Dong et al., 2018). Interturn short circuit is one of the common faults in power transformers. During interturn short circuit, the short-circuit current on the short-circuit turns can surge to tens of times the rated value. This high current can generate abnormal temperature rises and electromagnetic forces, potentially causing deformation in the winding or even melting of the conductor. Simultaneously, it might induce significant vibrations, impacting the safety and operational lifespan of the equipment (Liu et al., 2023).
In-depth investigation of the causes of interturn short-circuit faults and analyzing the variations in voltage, current, leakage flux, and electromagnetic force during faults contribute to enhancing fault prevention, monitoring, and ensuring the stable operation of power systems (Venikar et al., 2016; Guillen et al., 2019). Due to variations in winding design and manufacturing processes among different types and specifications of transformers, the investigation of interturn short circuit has become complex (Li and Xian, 2017). Especially, for large power transformers, conducting experimental studies on interturn short circuit is highly challenging due to site constraints and significant costs involved. Developing appropriate models and conducting numerical simulation analyses serve as effective methodologies for analyzing interturn short circuit faults in transformers.
Currently, researchers have conducted extensive studies in this field and have achieved significant outcomes. The reference (Yang et al., 2018) conducted finite element simulation calculations based on the field-circuit coupling method for a rectifier transformer’s interturn short circuit, obtaining the fault current waveform at the line end. In another study (Ye et al., 2019), a simulation model was established using the FLUX software for a single-phase isolation transformer, and the internal electromagnetic field was investigated under different types of interturn short circuits. For different types of transformers, references (Pan et al., 2019; Pan et al., 2020; Yang et al., 2021) analyzed the variation patterns of current and magnetic fields under various interturn short circuit scenarios. The results revealed that near the short-circuited turns, the iron core experienced excitation saturation, accompanied by a sharp increase in leakage flux. Zheng et al. (2022) analyzed and summarized the leakage magnetic field distribution characteristics during high, medium, and low-voltage winding interturn short circuit faults, and proposed a leakage magnetic sensor deployment scheme inside the transformer. Apart from the electromagnetic characteristics of interturn short circuits, reference (Zhu et al., 2023) also delved into the mechanical aspects of these faults in transformers. Additionally, Soleimani et al. (2020) researched the early impact of insulation degradation on the internal temperature of a transformer and proposed a fault diagnosis method based on online sensors for predictive decision-making. Zhang Lijing and colleagues from Shanghai Jiao Tong University (Zhang et al., 2023) conducted finite element simulation analysis on single-phase double-winding transformer interturn short-circuit faults. They found that parameters related to electrical and thermal characteristics, such as top oil temperature, tank shell temperature, and winding current, could be utilized to identify early-stage interturn short-circuit faults. Furthermore, focusing on distribution transformers, references (Zhang et al., 2021; Xian et al., 2024) analyzed the variations in multiple physical parameters such as electromagnetic, mechanical, and temperature changes when a single-turn short circuit occurred at different positions in the low-voltage winding, and a method was proposed for identifying interturn short-circuit faults in distribution transformers.
Based on the above, existing research on transformer interturn short circuit faults primarily focuses on analyzing short circuits occurring in high, medium, and low-voltage windings. Discussions involve variations in voltage and current during faults, as well as the analysis of the electromagnetic, mechanical, and temperature distribution characteristics during faults. However, there is relatively little research on interturn short circuit in regulating windings. Specifically, there is a lack of reported research on the transient electromagnetic processes and characteristics of interturn short circuits in regulating windings unconnected to the circuit.
This paper takes an actual scenario of an interturn short circuit occurring in the untapped portion of the regulating windings of a three-phase power transformer. A field-circuit coupling model was established to analyze the transient electromagnetic processes during the fault, and the effectiveness of the model was validated by comparing its results with actual fault recording data. Additionally, the magnetic field distribution and electromagnetic force characteristics during the fault were analyzed, and discussions were carried out regarding various ratios of short-circuited turns in the regulating windings. This study contributes to a better understanding of the impact of interturn short circuit faults on the internal electromagnetic transient processes, offering vital technical support for the diagnosis and prevention of faults in power transformers.
The remaining sections of this paper are organized as follows: Section 2 establishes a field-circuit coupling model for interturn short circuit in power transformer regulating winding and validates the model’s accuracy. Section 3 analyzes the distribution characteristics of the internal magnetic field of the transformer following an interturn short circuit. Section 4 examines the alterations of the electromagnetic forces exerted on windings after interturn short circuits. In Section 5, the short-circuit current, leakage magnetic field, and electromagnetic force are discussed under different short-circuit turns ratios in regulating windings. Finally, Section 6 provides a summary of this paper.
This paper investigates a fault in a power transformer operating in a specific substation as a case study, the main electrical parameters of this transformer are shown in Table 1. The transformer experienced an unexpected trip-off during its regular operation, triggered by the sudden operation of the differential protection. Subsequently, the circuit breakers on the high, medium, and low voltage sides were tripped, leading to an unplanned shutdown. Subsequent analysis revealed that the fault was caused by inadequate sealing at the top of the high-voltage bushing of the transformer. Moisture infiltrated the oil tank through the bushing, resulting in insulation degradation between the upper two lead wires of phase B regulating winding, causing an interturn short circuit in the regulating windings.
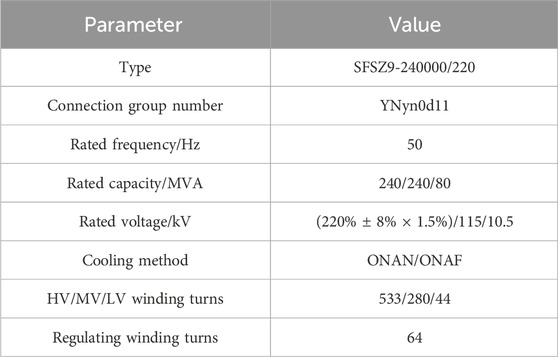
Table 1. Main electrical parameters of transformer.
The regulating windings of the transformer are of a spiral structure, and the short-circuit occurred between the upper fourth and sixth lead wires, causing coils d and e to form a short-circuit ring, as depicted in Figure 1.
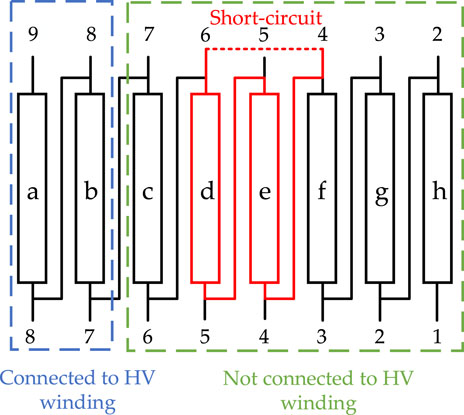
Figure 1. Sketch map of short-circuit positions in regulating winding.
In Figure 1, coils a, b, c, d, e, f, g, and h represent the positive and negative eight-tap coils of the regulating winding. Before the interturn short circuit fault, coils a and b are connected to the high-voltage winding, while the other coils are not connected to the high-voltage winding.
The transformer is a 220% ± 8% × 1.5%/115/10.5 kV three-phase power transformer, consisting of windings including low-voltage, medium-voltage, high-voltage, and regulating windings. The medium-voltage winding is divided into two parts: one part is located between the low-voltage winding and the high-voltage winding, and the other part is external to the regulating winding. From the core to the outer section, it is arranged as follows: low-voltage winding, medium-voltage winding 1, high-voltage winding, regulating winding, and medium-voltage winding 2.
According to the actual structure of the transformer, a three-dimensional geometric model of the transformer was established in finite element software, as shown in Figure 2A. The transformer core is of a three-phase five-column type, and its geometric model and dimensions are illustrated in Figure 2B.
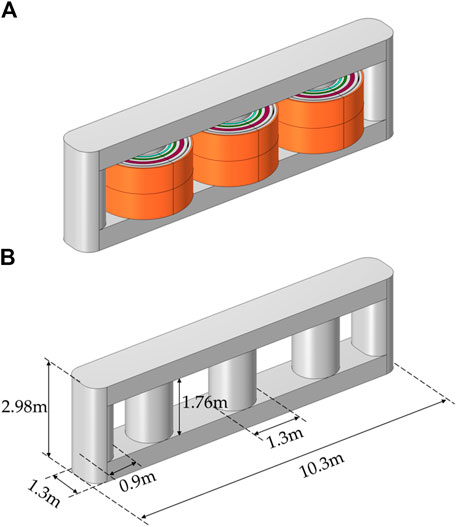
Figure 2. (A) Transformer model; (B) The dimensions of the core.
Before the interturn short circuit, only coils a and b of the regulating winding are connected to the high-voltage winding. However, a short circuit occurred between the fourth and sixth leads of the upper section of the regulating winding, which involved coils d and e. The spiral structure winding is formed by parallel wires continuously wound around the core in a spiral fashion and parallel wires undergo permutation during the winding process. It is challenging to individually model various parts of the regulating winding when establishing the 3D model such as coils connected to the high-voltage circuit or the coils in the short-circuit section. To simplify the modeling process, the regulating winding is divided into three coils W1, W2, and W3 along the radial direction, as illustrated in Figure 3. The central coil W2 is designated as a coil with 16 turns of short-circuit, while the other two coils W1 and W3 represent the coils in the regulating winding that have not experienced interturn short circuit. The dimensional parameters of the windings are presented in Table 2.
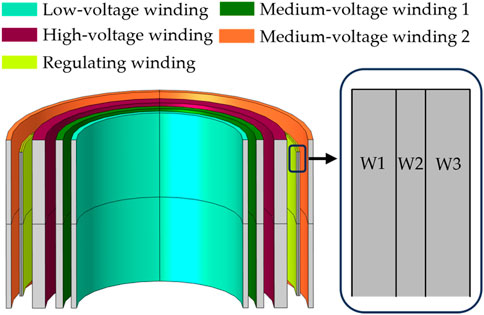
Figure 3. Structure of windings.
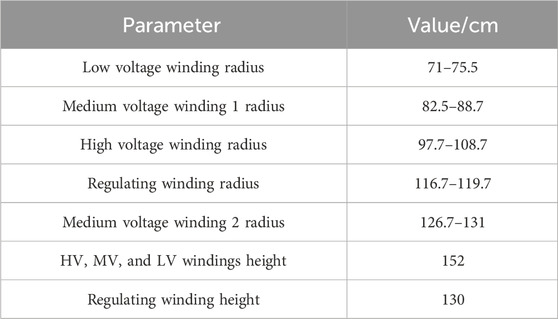
Table 2. The dimensional parameters of the windings.
To simulate the actual transformer interturn short circuit fault operating condition, a field-circuit coupled external circuit was established on the high, medium, and low voltage sides, as illustrated in Figure 4.
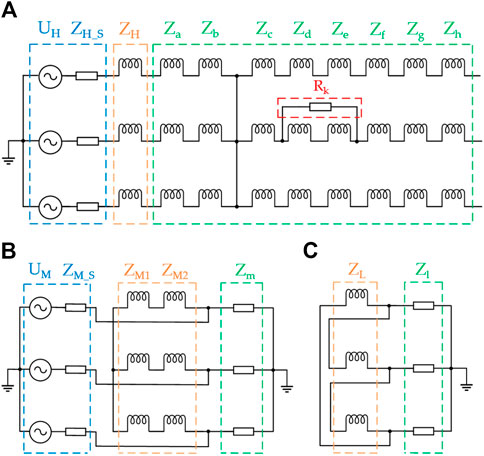
Figure 4. (A) High-voltage side circuit; (B) Medium-voltage side circuit; (C) Low-voltage side circuit.
In Figure 4A, UH represents the source of the high-voltage side; ZH_S represents the system impedance of the high-voltage side; ZH represents the impedance of high-voltage windings; Za ∼ Zh represent the impedance of regulating windings; Rk is the interturn insulation resistance (Zhang et al., 2015).
In Figure 4B, UM represents the sources of the medium-voltage side; ZM_S represents the system impedance of the medium-voltage side; ZM1 represents the impedance of medium-voltage winding 1; ZM2 represents the impedance of medium-voltage winding 2; Zm represents the load of medium-voltage side. In Figure 4C, ZL represents the impedance of low-voltage windings, and Zl represents the load of the low-voltage side.
Based on the actual measured voltage, the phase voltages of high and medium sources UH and UM are set as sinusoidal voltage with amplitudes of 182.5 kV and 92.5 kV, respectively. The system impedance can be approximately considered as inductive reactance. In accordance with the China national standard GB1094.5, the system impedances of the high and medium side ZH_S and ZM_S are set to inductive reactance of 7.697 Ω and 8.294 Ω, respectively. According to actual voltage and current data, the loads of the medium and low sides Zm and Zl are set as 37.89 + 7.698j Ω and 10.741–1.53j Ω, respectively.
The interturn short circuit is controlled by the value of the short-circuit contact resistance Rk. When the value of Rk is infinite, the transformer operates in a normal operating state. However, when the value of Rk becomes 0.5 mΩ, an interturn short circuit occurs.
To validate the effectiveness of the field-circuit coupling model, the simulated data was compared with the actual measured voltage and current data of the high, and medium sides 50 ms before and after the interturn short circuit, as shown in Figure 5.
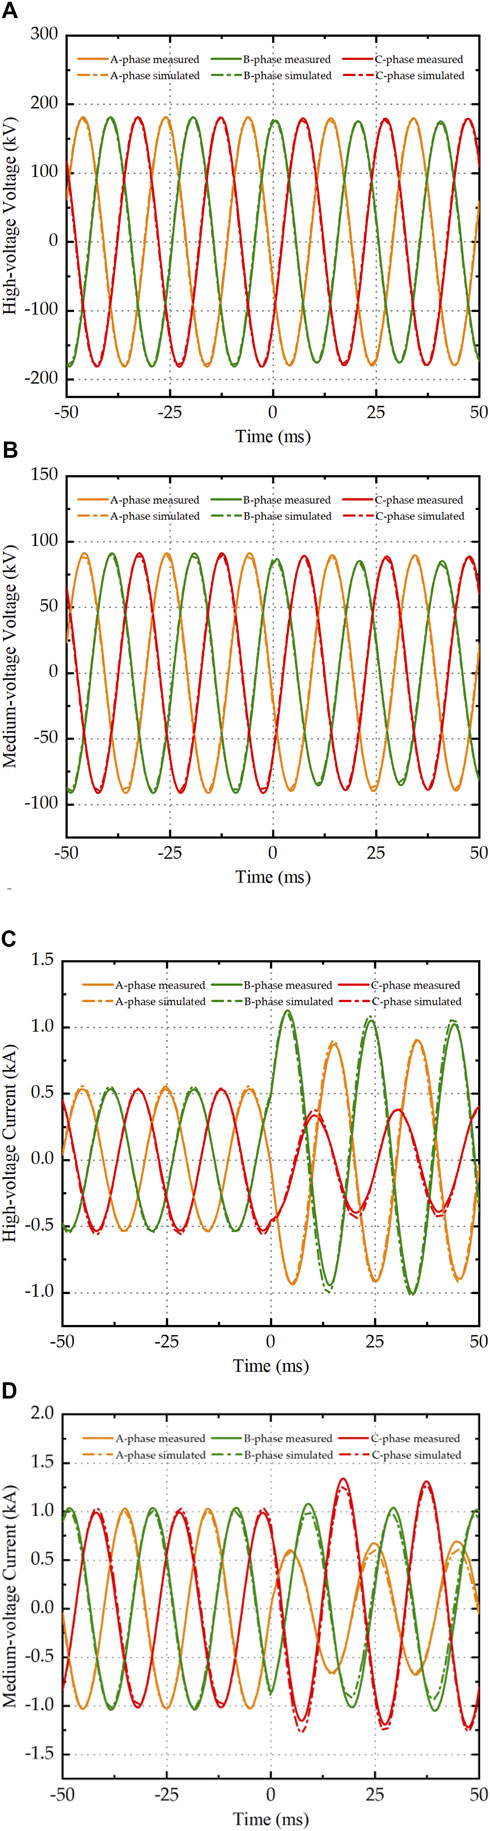
Figure 5. Comparison of actual measured data and simulated results: (A) Three-phase voltage of the high-voltage side; (B) Three-phase voltage of the medium-voltage side; (C) Three-phase current of the high-voltage side; (D) Three-phase current of the medium-voltage side.
From Figure 5, it can be observed that there is a slight discrepancy between the simulated results and the actual recorded fault data at certain peak points, but the overall waveforms are closely consistent.
To visually analyze the deviation between the simulation values and the actual values, the voltage average error Uo and current average error Io are defined by Eqs 1, 2.
Uas, Ubs, Ucs, Ias, Ibs, Ics are the simulated values of three-phase voltage and current, respectively; Uar, Ubr, Ucr, Iar, Ibr, Icr are the measured values of three-phase voltage and current, respectively.
The waveform of Uo and Io before and after short-circuit are shown in Figure 6. From Figure 6, it can be observed that the amplitude range of Uo on the high-voltage side is approximately between 4 ∼ 6.5 kV, while on the medium-voltage side, it is approximately between 2 ∼ 3.5 kV. After the short circuit fault, the current average error slightly increases. The maximum amplitude of Io on the high-voltage side before the short circuit is 0.0229 kA, which increases to 0.0873 kA after the short circuit. On the medium-voltage side, the maximum amplitude of Io before the short circuit is 0.0523 kA, which increases to 0.1019 kA after the short circuit.
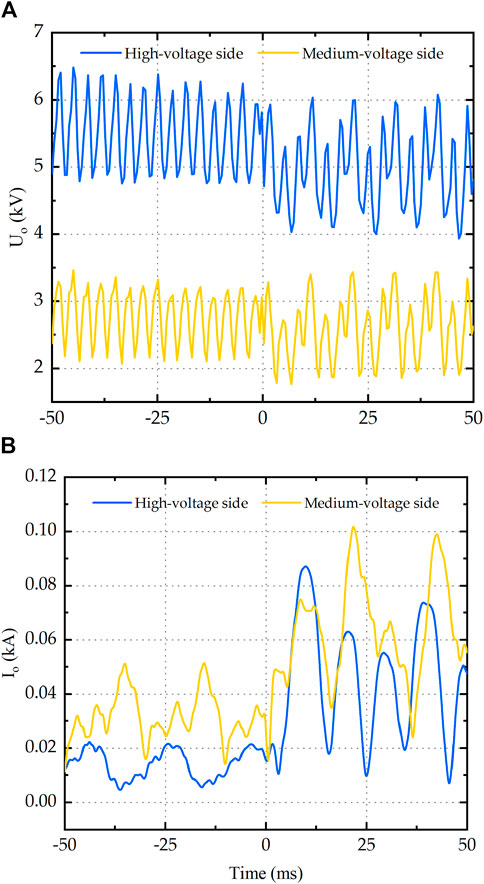
Figure 6. (A) The waveform of Uo before and after short-circuit; (B) The waveform of Io before and after short-circuit.
The results of the voltage average error and current average error show a high consistency between the simulation results and the actual fault record data, confirming the effectiveness of the simulation model.
When an interturn short circuit fault occurs in the transformer, currents far exceeding the rated value are generated in the short-circuited ring, resulting in a modification of the intensity distribution of the leakage magnetic field. The current of the short-circuit ring is illustrated in Figure 7. It can be seen that before the interturn short circuit, there was no current flowing through the coils d and e of regulating windings because coils d and e are not connected to the high-voltage winding. However, following the occurrence of the interturn short circuit, the current in the short-circuited ring reaches a peak of 61.1 kA. This indicates that even though coils d and e are not connected to the high-voltage winding, their current reaches high values after the interturn short circuit. This is attributed to the fact that coils d and e are located in the magnetic circuit, and the low impedance of the short-circuit ring, combined with the induced electromotive force after the short circuit, leads to a substantial current flow.
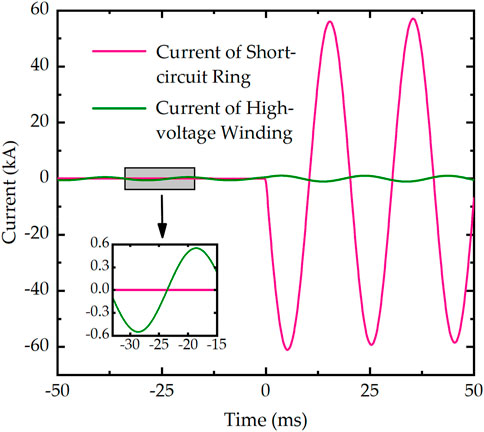
Figure 7. The current of short-circuit ring.
When the current in the B-phase winding reaches its maximum value before and after the interturn short circuit, the magnetic flux density distribution characteristics are depicted in Figure 8. It can be seen that the magnetic flux is mainly concentrated within the iron core. After the interturn short circuit, the leakage magnetic flux in the B-phase winding significantly increases, with the most significant changes occurring in the regulating winding and the high-voltage winding.
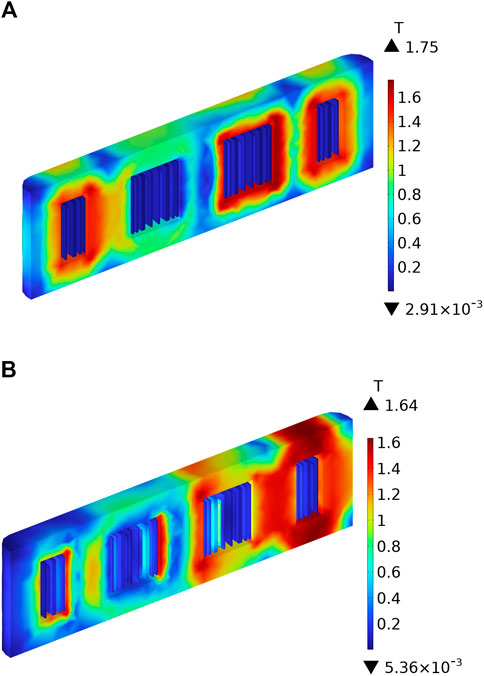
Figure 8. Distribution of magnetic flux density: (A) Before interturn short circuit; (B) After interturn short circuit.
The radial and axial components of leakage magnetic flux density before and after the interturn short circuit are illustrated in Figure 9. From Figures 9A, B, it can be observed that, before the short circuit, the highest radial leakage magnetic flux density is located at the upper and lower ends of the B-phase high-voltage winding, with a maximum value of 30.5 mT. After the short circuit, the highest radial leakage magnetic flux density shifts to the upper and lower ends of the B-phase regulating winding, reaching a maximum of 240 mT. According to Figures 9C, D, the highest axial leakage magnetic flux density before the short circuit is in the middle of the regulating winding, and the maximum is 88.6 mT. After the short circuit, the axial leakage magnetic flux density in the middle of the regulating winding is significantly higher than elsewhere, with a maximum value of 857 mT.
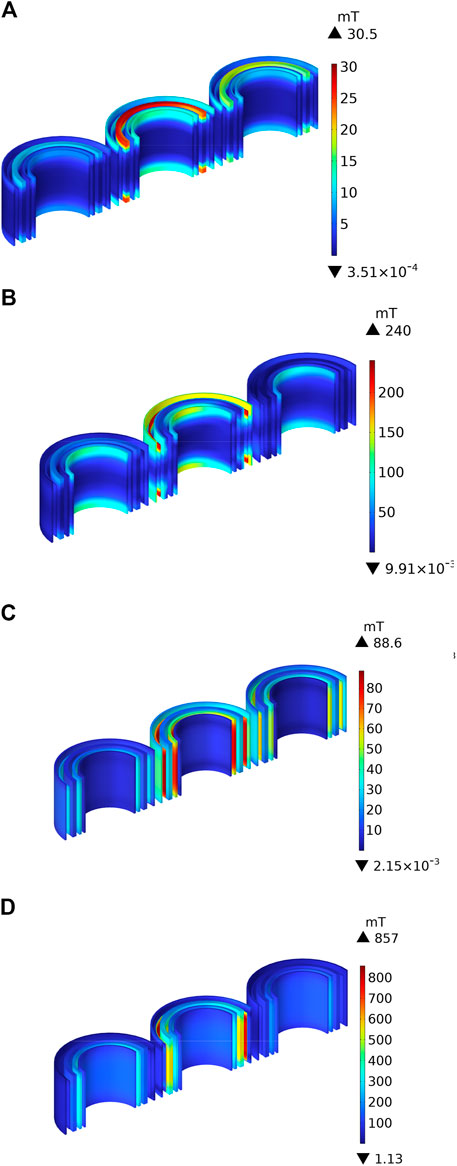
Figure 9. Distribution of leakage magnetic flux density: (A) Radial direction before interturn short circuit (B) Radial direction after interturn short circuit; (C) Axial direction before interturn short circuit; (D) Axial direction after interturn short circuit.
In order to further analyze the changes in the leakage magnetic flux density during the interturn short circuit fault, an observation path, with a length of 1.6 m, was established at the location where the leakage magnetic flux density variation is most significant, which is between the B-phase regulating winding and the high-voltage winding, as shown in Figure 10A. Three-dimensional curves depicting the leakage magnetic flux density variations over time along the observation path are shown in Figure 10B.
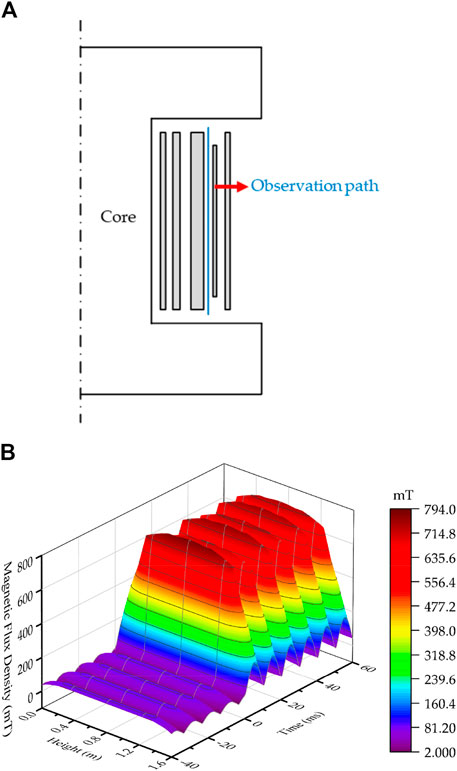
Figure 10. (A) The position of the observation path; (B) The distribution of leakage magnetic flux density overtime on the observation path.
As shown in Figure 10B, the maximum leakage magnetic flux density is located in the middle of the observation path, and the leakage magnetic flux density gradually decreases from the middle towards both ends. Before the interturn short circuit, the maximum leakage magnetic flux density at the middle of the observation path reaches 98.8 mT. When the transformer experiences a fault starting from 0 ms, the overall leakage magnetic flux density on the observation path rapidly increases, reaching a maximum of 794 mT, approximately 8 times higher, and slightly attenuating after the first peak.
When the current in the B-phase winding reaches its maximum value before and after the interturn short circuit, the distribution characteristics of the electromagnetic forces on the windings are illustrated in Figure 11. One can observe that the maximum electromagnetic force density occurs on the B-phase medium-voltage winding 1 during normal operation, reaching a maximum of 0.195 MN/m³. After the interturn short circuit, the maximum electromagnetic force density shifts to the short-circuit turns in the regulating winding, which is significantly higher than other locations, reaching a maximum of 47.4 MN/m³.
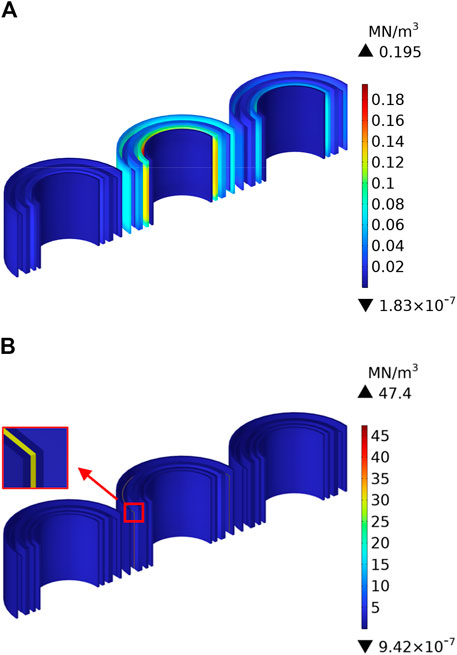
Figure 11. Distribution of electromagnetic force: (A) Before short circuit; (B) After short circuit.
To conduct a detailed and in-depth analysis of the electromagnetic force acting on short-circuit turns, the force is decomposed into radial components in the x and y direction and an axial component in the z direction. When the current of the short-circuit ring reaches its peak amplitude, the electromagnetic force density in the three directions is illustrated in Figure 11.
Combining Figures 12A, B, it can be seen that the short-circuit turns experience radial forces directed from the inside to the outside, and the radial force density in the x direction 35.5 MN/m3 slightly exceeds that in the y direction 33.5 MN/m3. As shown in Figure 12C, the short-circuit turns are subjected to an axial force compressing towards the middle, with the magnitude gradually decreasing from both ends towards the middle.
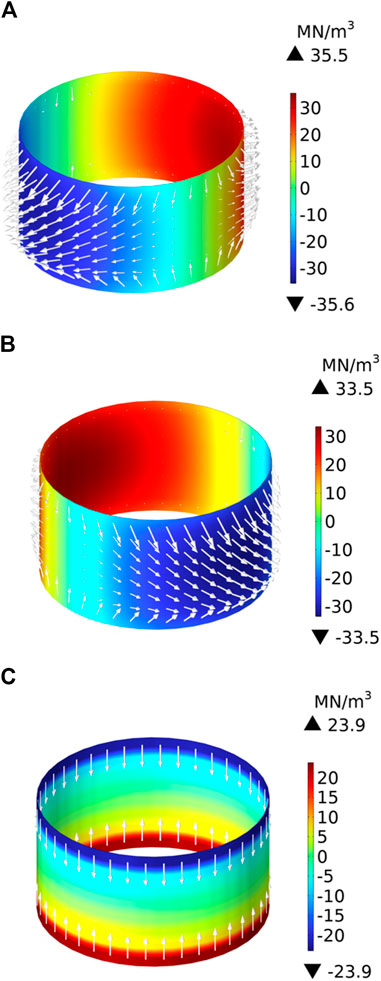
Figure 12. Distribution of electromagnetic forces density acting on the short-circuit turns in the x, y, and z directions after the interturn short circuit: (A) x-direction; (B) y-direction; (C) z-direction.
To calculate the magnitude of the electromagnetic force, the regulating winding is uniformly divided into right and left sides in the x-direction, front, and back sides in the y-direction, and upper and lower sides in the z-direction. The electromagnetic force acting on each part before and after the short circuit is depicted in Figure 13.
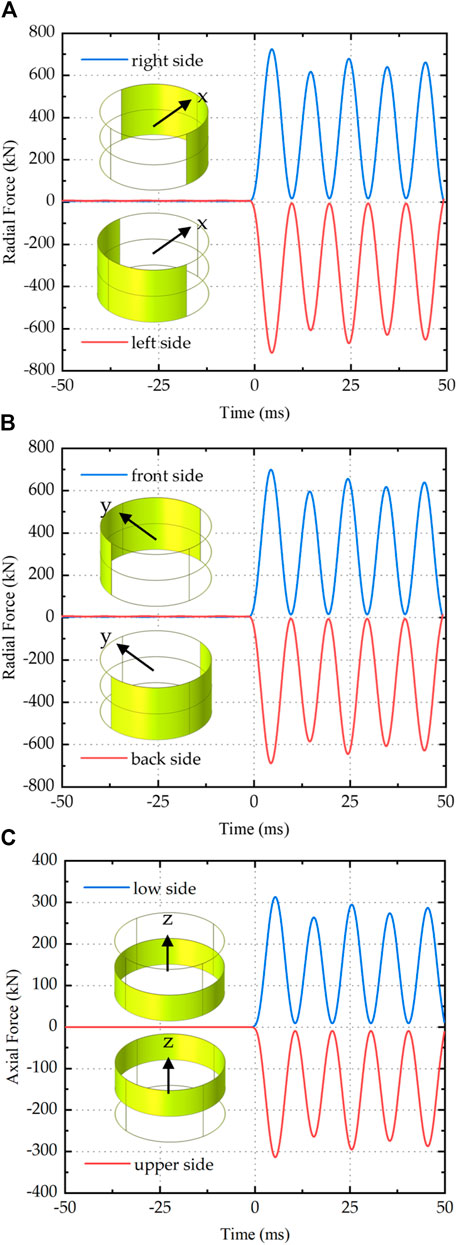
Figure 13. The force subjected to short-circuit turns: (A) The x-direction; (B) The y-direction; (C) The z-direction.
Combining Figures 13A, B, it can be observed that the regulating winding experiences a maximum radial force of 745.9 kN outward in the x-direction and a maximum radial force of 719.7 kN outward in the y-direction. From Figure 13C, it can be seen that the regulating winding experiences a maximum compressive axial force of 316.7 kN toward the center.
In summary, after the interturn short circuit, the maximum electromagnetic force acting on the regulating winding occurs at the first cycle of the short-circuit current, and the radial force is much greater than the axial force. Due to the maximum radial force acting on the midsection of the coil, deformation is most likely to occur.
To investigate the variations in electromagnetic parameters under different short-circuit ratios, the regulating coil experiencing interturn short circuits was extended from one coil d to five coils d, e, f, g, and h.
The short-circuited ring current changes under the different short-circuit ratios are illustrated in Figure 14. One can see that the short-circuit current gradually decreases with the increase in the number of short-circuit coils. This is because the short-circuited ring is not connected to the circuit, and energy supply is provided through electromagnetic induction.
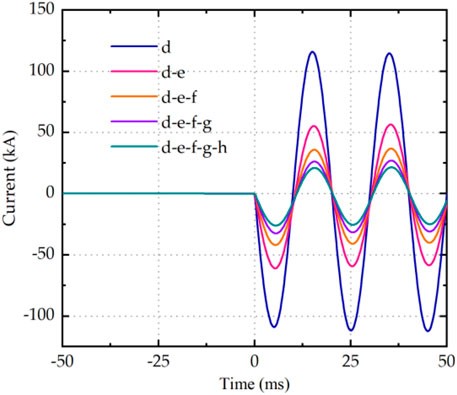
Figure 14. The current of the short-circuited ring under the different short-circuit ratios.
When a single coil is short-circuited, the maximum leakage magnetic flux density is 723 mT. When two coils are short-circuited, the maximum leakage magnetic flux density increases to 794 mT, with an increase of approximately 71 mT. With four coils short-circuited, the maximum leakage magnetic flux density reaches 820.5 mT, and when five coils are short-circuited, it reaches 834 mT, with an increase of approximately 13.5 mT. It can be observed that as the number of short-circuited turns increases, the leakage magnetic flux density gradually increases, but the rate of increase decreases.
Figure 15 indicates the distribution of leakage magnetic flux density at the same observation path shown in Figure 10A under different short-circuit ratios.

Figure 15. Distribution of leakage magnetic flux density under the different short-circuit ratios.
When one coil d is short-circuited, the maximum current peak on the short-circuited ring is 118.9 kA. When two coils d and e are short-circuited, the maximum current peak is 61.1 kA, representing a reduction of approximately 48.6%. When three coils d, e, and f are short-circuited, the maximum current peak is 42.2 kA, representing a reduction of approximately 30.9%, compared to the two coils’ short-circuited situation. Furthermore, when four coils and five coils are short-circuited, the maximum current peaks respectively are 32.5 kA and 26.2 kA, representing a reduction of approximately 23.0% and 19.4%.
Figure 16 shows the magnitude of radial and axial electromagnetic forces acting on the short-circuit turns under different short-circuit ratios. As the ratio of short-circuit coils increases, it has an increase in the radial and axial force acting on the short-circuit turns. When the short-circuit coils increase from 1 coil to 5 coils, the radial force increases from 607 kN to 798 kN, and the axial force increases from 249 kN to 358 kN.
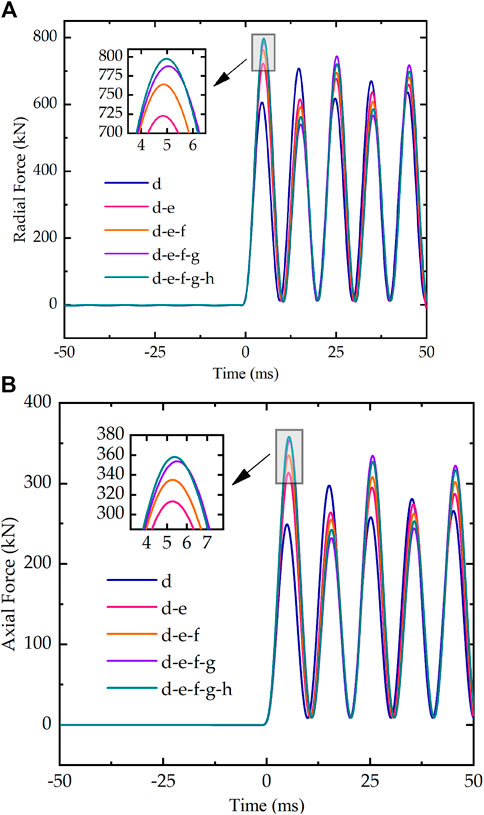
Figure 16. Electromagnetic forces under different short-circuit ratios: (A) Radial electromagnetic forces; (B) Axial electromagnetic forces.
This paper takes an actual transformer as an example to establish a three-dimensional field circuit coupling model for the fault of interturn short circuit in the untapped portion of regulating windings. Through comparing simulation results with actual fault recording data, the effectiveness of the model was validated. The magnetic field distribution and electromagnetic force characteristics during the fault were analyzed, and discussions were carried out regarding different ratios of short-circuit turns in the regulating windings. The main conclusions are as follows:
1) Even though the coils d and e in the regulating winding are not connected to the high-voltage winding, the short-circuit current in the short-circuit ring reaches a peak of 61.1 kA when a short circuit occurs. Simultaneously, the maximum radial leakage flux density in the windings increases from 30.5 mT to 240 mT, and the highest axial leakage flux density increases from 88.6 mT to 857 mT. The most significant variation in leakage magnetic flux between the windings occurred in the region between the regulating winding and the high-voltage winding. Before the fault, the maximum flux density measured along the path was 98.8 mT, which increased approximately 8 times to a maximum of 794 mT after the fault occurred.
2) After the interturn short circuit, the maximum electromagnetic force density on the short-circuited turns in the regulating winding is significantly higher than at other locations, reaching a maximum of 47.4 MN/m³. The short-circuit turns experience both radial forces from the inside out and axial forces compressing towards the center. In the x-direction, the regulating winding experiences a maximum radial force of 745.9 kN, in the y-direction it undergoes a maximum axial force of 719.7 kN, and in the z-direction, it encounters a maximum axial force of 316.7 kN.
3) As the number of short-circuited coils increases from 1 to 5, the current on the short-circuit ring gradually decreases from a maximum peak of 118.9 kA–26.2 kA. Following the short circuit, the maximum leakage flux density in the observation path of the transformer increases gradually from 723 mT to 834 mT. The radial force on the short-circuit turns increases from 607 kN to 798 kN, and the axial force on the short-circuit turns increases from 249 kN to 358 kN.
The probability of an interturn short circuit fault in the regulating winding of the transformer, especially the portion not connected to the high-voltage winding, is relatively small. However, the damage caused to the transformer should not be ignored. This study holds significant importance in comprehending the impact of interturn short circuit faults in the untapped portion of regulating windings. This research provides crucial technical support for fault diagnosis and prevention in power systems, aiming to enhance their reliability and stability. Due to experimental limitations, this study only conducted a simulation analysis on this specific fault case. If possible, further research could be conducted in the future by combining relevant experiments to enhance the understanding of this phenomenon.
The original contributions presented in the study are included in the article/Supplementary Material, further inquiries can be directed to the corresponding author.
LF: Writing–original draft, Writing–review and editing. ZM: Writing–original draft, Writing–review and editing. LC: Writing–original draft, Writing–review and editing. DZ: Writing–original draft, Writing–review and editing. XS: Writing–original draft, Writing–review and editing. ZL: Writing–original draft, Writing–review and editing. CL: Writing–original draft, Writing–review and editing. XL: Writing–original draft, Writing–review and editing.
The author(s) declare that financial support was received for the research, authorship, and/or publication of this article. This work was supported by the Guangdong Key Laboratory of Electric Power Equipment Reliability, Electric Power Research Institute of Guangdong Power Grid Co., Ltd., Guangzhou, Guangdong 510080, China (No. GDDKY2022KF01).
Authors ZM, LC, DZ, XS, ZL, and CL were employed by Electric Power Research Institute of Guangdong Power Grid Co., Ltd.
The remaining authors declare that the research was conducted in the absence of any commercial or financial relationships that could be construed as a potential conflict of interest.
The authors declare that this study received funding from the Guangdong Key Laboratory of Electric Power Equipment Reliability, Electric Power Research Institute of Guangdong Power Grid Co., Ltd. The funder had the following involvement in the study: study design, collection, analysis, interpretation of data, the writing of this article, and the decision to submit it for publication.
All claims expressed in this article are solely those of the authors and do not necessarily represent those of their affiliated organizations, or those of the publisher, the editors and the reviewers. Any product that may be evaluated in this article, or claim that may be made by its manufacturer, is not guaranteed or endorsed by the publisher.
Dong, C., Li, D., Zhao, J., Li, J., Ma, Y., and Feng, Y. (2018). Numerical simulation on winding force of 220 kV transformer in short-circuit condition. Guangdong Electr. Power 31, 124–129. doi:10.3969/j.issn.1007-290X.2018.007.019
Guillen, D., Olivares-Galvan, J. C., Escarela-Perez, R., Granados-Lieberman, D., and Barocio, E. (2019). Diagnosis of interturn faults of single-distribution transformers under controlled conditions during energization. Measurement 141, 24–36. doi:10.1016/j.measurement.2019.03.044
Li, Q., and Xian, R. (2017). Analysis on an accident of main transformer low voltage winding fuse in 220 kV substation. Guangdong Electr. Power 30, 89–92. doi:10.3969/j.issn.1007-290X.2017.01.017
Liu, G., Yu, G., Ming, D., Ma, X., Tang, Y., Liu, B., et al. (2023). Research progress in characteristics and detection of transformer interturn fault. Insul. Mater. 56, 7–15. doi:10.16790/j.cnki.1009-9239.im.2023.11.002
Pan, C., Mi, J., Wang, G., Cai, G., and Zhang, Y. (2019). Electromagnetic harmonic response analysis method of inter-turn short circuit in transformer winding based on field circuit coupling. Trans. China Electrotech. Soc. 34, 673–682. doi:10.19595/j.cnki.1000-6753.tces.180172
Pan, C., Shi, W., and Meng, T. (2020). Study on electromagnetic characteristics of interturn short circuit of single-phase transformer. High. Volt. Eng. 46, 1839–1852. doi:10.13336/j.1003-6520.hve.20200515040
Soleimani, M., Faiz, J., Nasab, P. S., and Moallem, M. (2020). Temperature measuring-based decision-making prognostic approach in electric power transformers winding failures. IEEE Trans. Instrum. Meas. 69, 6995–7003. doi:10.1109/TIM.2020.2975386
Venikar, P. A., Ballal, M. S., Umre, B. S., and Suryawanshi, H. M. (2016). A novel offline to online approach to detect transformer interturn fault. IEEE Trans. Power Deliv. 31, 482–492. doi:10.1109/TPWRD.2015.2440448
Xian, R., Wang, L., Zhang, B., Li, J., Xian, R., and Li, J. (2024). Identification method of interturn short circuit fault for distribution transformer based on power loss variation. IEEE Trans. Ind. Inf. 20, 2444–2454. doi:10.1109/TII.2023.3292972
Yang, C., Ding, Y., Qiu, H., and Xiong, B. (2021). Analysis of turn-to-turn fault on split-winding transformer using coupled field-circuit approach. Processes 9, 1314. doi:10.3390/pr9081314
Yang, J., Wang, S., Yuan, Y., Cheng, J., Zhang, X., and Liu, S. (2018). Research on interturn short-circuit fault of converter transformer based on field-circuit coupling method. South. Power Syst. Technol. 12, 17–22. doi:10.13648/j.cnki.issn1674-0629.2018.08.003
Ye, Z., Gou, J., Cai, J., and Zeng, W. (2019). Analysis of parameters and characteristics of inter-turn short-circuit fault on primary side of transformer. Automation Electr. Power Syst. 43, 213–220. doi:10.7500/AEPS20180702003
Zhang, B., Xian, R., Yu, Y., Xie, T., Gao, H., and Chen, L. (2021). Analysis of physical characteristics of power transformer windings under inter-turn short circuit fault. High. Volt. Eng. 47, 2177–2185. doi:10.13336/j.1003-6520.hve.20201178
Zhang, J., Liu, L., Liu, D., Liu, L., Zhang, X., and Hu, Q. (2015). A method of simulating the fault current using field-circuit coupling for partially short-circuited transformer winding. Trans. China Electrotech. Soc. 30, 65–70. doi:10.3969/j.issn.1000-6753.2015.20.008
Zhang, L., Sheng, G., Ni, Z., and Jiang, X. (2023). Study on electrothermal characteristics of oil-immersed power transformers in early stage of interturn faults. Proc. CSEE 43, 6124–6136. doi:10.13334/j.0258-8013.pcsee.220591
Zheng, Y., Gong, X., Pan, S., Sun, J., and Deng, J. (2022). Analysis on leakage flux characteristics of turn-to-turn short-circuit fault for power transformer. Automation Electr. Power Syst. 46, 121–127. doi:10.7500/AEPS20210816003
Keywords: transformer, regulating winding, interturn short circuit, leakage flux, electromagnetic force
Citation: Fei L, Ma Z, Cai L, Zhou D, Shu X, Liao Z, Lin C and Li X (2024) Analysis of interturn short circuit in regulating winding of power transformer based on field-circuit coupling. Front. Energy Res. 12:1393436. doi: 10.3389/fenrg.2024.1393436
Received: 29 February 2024; Accepted: 07 June 2024;
Published: 26 June 2024.
Edited by:
Xiaohu Yang, Xi’an Jiaotong University, ChinaReviewed by:
Yongbin Wu, Southeast University, ChinaCopyright © 2024 Fei, Ma, Cai, Zhou, Shu, Liao, Lin and Li. This is an open-access article distributed under the terms of the Creative Commons Attribution License (CC BY). The use, distribution or reproduction in other forums is permitted, provided the original author(s) and the copyright owner(s) are credited and that the original publication in this journal is cited, in accordance with accepted academic practice. No use, distribution or reproduction is permitted which does not comply with these terms.
*Correspondence: Xianqiang Li, bHhxQHdodXQuZWR1LmNu
Disclaimer: All claims expressed in this article are solely those of the authors and do not necessarily represent those of their affiliated organizations, or those of the publisher, the editors and the reviewers. Any product that may be evaluated in this article or claim that may be made by its manufacturer is not guaranteed or endorsed by the publisher.
Research integrity at Frontiers
Learn more about the work of our research integrity team to safeguard the quality of each article we publish.